Example of Carbon Balance and Management format
Recent searches

Example of Carbon Balance and Management format Example of Carbon Balance and Management format Example of Carbon Balance and Management format Example of Carbon Balance and Management format Example of Carbon Balance and Management format Example of Carbon Balance and Management format Example of Carbon Balance and Management format Example of Carbon Balance and Management format Example of Carbon Balance and Management format Example of Carbon Balance and Management format Example of Carbon Balance and Management format Example of Carbon Balance and Management format Example of Carbon Balance and Management format Example of Carbon Balance and Management format Example of Carbon Balance and Management format Example of Carbon Balance and Management format Example of Carbon Balance and Management format Example of Carbon Balance and Management format
Sample paper formatted on SciSpace - SciSpace
This content is only for preview purposes. The original open access content can be found here.
Look Inside
Example of Carbon Balance and Management format Example of Carbon Balance and Management format Example of Carbon Balance and Management format Example of Carbon Balance and Management format Example of Carbon Balance and Management format Example of Carbon Balance and Management format Example of Carbon Balance and Management format Example of Carbon Balance and Management format Example of Carbon Balance and Management format Example of Carbon Balance and Management format Example of Carbon Balance and Management format Example of Carbon Balance and Management format Example of Carbon Balance and Management format Example of Carbon Balance and Management format Example of Carbon Balance and Management format Example of Carbon Balance and Management format Example of Carbon Balance and Management format Example of Carbon Balance and Management format
Sample paper formatted on SciSpace - SciSpace
This content is only for preview purposes. The original open access content can be found here.
open access Open Access
recommended Recommended

Carbon Balance and Management — Template for authors

Publisher: Springer
Categories Rank Trend in last 3 yrs
Earth and Planetary Sciences (all) #15 of 186 up up by 9 ranks
Earth and Planetary Sciences (miscellaneous) #9 of 106 up up by 10 ranks
Management, Monitoring, Policy and Law #34 of 355 up up by 12 ranks
Global and Planetary Change #19 of 93 up up by 7 ranks
journal-quality-icon Journal quality:
High
calendar-icon Last 4 years overview: 90 Published Papers | 648 Citations
indexed-in-icon Indexed in: Scopus
last-updated-icon Last updated: 09/06/2020
Related journals
Insights
General info
Top papers
Popular templates
Get started guide
Why choose from SciSpace
FAQ

Related Journals

open access Open Access
recommended Recommended

Elsevier

Quality:  
High
CiteRatio: 12.5
SJR: 1.623
SNIP: 1.998
open access Open Access
recommended Recommended

Elsevier

Quality:  
High
CiteRatio: 20.2
SJR: 4.659
SNIP: 3.687
open access Open Access
recommended Recommended

Elsevier

Quality:  
High
CiteRatio: 11.2
SJR: 2.053
SNIP: 1.984
open access Open Access

Inderscience Publishers

Quality:  
Medium
CiteRatio: 1.4
SJR: 0.258
SNIP: 0.385

Journal Performance & Insights

CiteRatio

SCImago Journal Rank (SJR)

Source Normalized Impact per Paper (SNIP)

A measure of average citations received per peer-reviewed paper published in the journal.

Measures weighted citations received by the journal. Citation weighting depends on the categories and prestige of the citing journal.

Measures actual citations received relative to citations expected for the journal's category.

7.2

16% from 2019

CiteRatio for Carbon Balance and Management from 2016 - 2020
Year Value
2020 7.2
2019 6.2
2018 5.5
2017 4.1
2016 3.9
graph view Graph view
table view Table view

1.148

22% from 2019

SJR for Carbon Balance and Management from 2016 - 2020
Year Value
2020 1.148
2019 1.475
2018 1.21
2017 0.977
2016 1.578
graph view Graph view
table view Table view

1.68

15% from 2019

SNIP for Carbon Balance and Management from 2016 - 2020
Year Value
2020 1.68
2019 1.462
2018 1.169
2017 0.899
2016 1.147
graph view Graph view
table view Table view

insights Insights

  • CiteRatio of this journal has increased by 16% in last years.
  • This journal’s CiteRatio is in the top 10 percentile category.

insights Insights

  • SJR of this journal has decreased by 22% in last years.
  • This journal’s SJR is in the top 10 percentile category.

insights Insights

  • SNIP of this journal has increased by 15% in last years.
  • This journal’s SNIP is in the top 10 percentile category.

Carbon Balance and Management

Guideline source: View

All company, product and service names used in this website are for identification purposes only. All product names, trademarks and registered trademarks are property of their respective owners.

Use of these names, trademarks and brands does not imply endorsement or affiliation. Disclaimer Notice

Springer

Carbon Balance and Management

Approved by publishing and review experts on SciSpace, this template is built as per for Carbon Balance and Management formatting guidelines as mentioned in Springer author instructions. The current version was created on and has been used by 195 authors to write and format their manuscripts to this journal.

Biosphere

i
Last updated on
09 Jun 2020
i
ISSN
1606-8610
i
Open Access
Yes
i
Sherpa RoMEO Archiving Policy
White faq
i
Plagiarism Check
Available via Turnitin
i
Endnote Style
Download Available
i
Citation Type
Author Year
(Blonder et al, 1982)
i
Bibliography Example
Beenakker CWJ (2006) Specular andreev reflection in graphene. Phys Rev Lett 97(6):067,007, URL 10.1103/PhysRevLett.97.067007

Top papers written in this journal

open accessOpen access Journal Article DOI: 10.1186/1750-0680-4-2
Mapping and monitoring carbon stocks with satellite observations: a comparison of methods

Abstract:

Mapping and monitoring carbon stocks in forested regions of the world, particularly the tropics, has attracted a great deal of attention in recent years as deforestation and forest degradation account for up to 30% of anthropogenic carbon emissions, and are now included in climate change negotiations. We review the potential ... Mapping and monitoring carbon stocks in forested regions of the world, particularly the tropics, has attracted a great deal of attention in recent years as deforestation and forest degradation account for up to 30% of anthropogenic carbon emissions, and are now included in climate change negotiations. We review the potential for satellites to measure carbon stocks, specifically aboveground biomass (AGB), and provide an overview of a range of approaches that have been developed and used to map AGB across a diverse set of conditions and geographic areas. We provide a summary of types of remote sensing measurements relevant to mapping AGB, and assess the relative merits and limitations of each. We then provide an overview of traditional techniques of mapping AGB based on ascribing field measurements to vegetation or land cover type classes, and describe the merits and limitations of those relative to recent data mining algorithms used in the context of an approach based on direct utilization of remote sensing measurements, whether optical or lidar reflectance, or radar backscatter. We conclude that while satellite remote sensing has often been discounted as inadequate for the task, attempts to map AGB without satellite imagery are insufficient. Moreover, the direct remote sensing approach provided more coherent maps of AGB relative to traditional approaches. We demonstrate this with a case study focused on continental Africa and discuss the work in the context of reducing uncertainty for carbon monitoring and markets. read more read less

Topics:

Satellite imagery (51%)51% related to the paper
View PDF
377 Citations
open accessOpen access Journal Article DOI: 10.1186/S13021-017-0072-2
Greenhouse gas emissions from tropical forest degradation: an underestimated source

Abstract:

The degradation of forests in developing countries, particularly those within tropical and subtropical latitudes, is perceived to be an important contributor to global greenhouse gas emissions. However, the impacts of forest degradation are understudied and poorly understood, largely because international emission reduction p... The degradation of forests in developing countries, particularly those within tropical and subtropical latitudes, is perceived to be an important contributor to global greenhouse gas emissions. However, the impacts of forest degradation are understudied and poorly understood, largely because international emission reduction programs have focused on deforestation, which is easier to detect and thus more readily monitored. To better understand and seize opportunities for addressing climate change it will be essential to improve knowledge of greenhouse gas emissions from forest degradation. Here we provide a consistent estimation of forest degradation emissions between 2005 and 2010 across 74 developing countries covering 2.2 billion hectares of forests. We estimated annual emissions of 2.1 billion tons of carbon dioxide, of which 53% were derived from timber harvest, 30% from woodfuel harvest and 17% from forest fire. These percentages differed by region: timber harvest was as high as 69% in South and Central America and just 31% in Africa; woodfuel harvest was 35% in Asia, and just 10% in South and Central America; and fire ranged from 33% in Africa to only 5% in Asia. Of the total emissions from deforestation and forest degradation, forest degradation accounted for 25%. In 28 of the 74 countries, emissions from forest degradation exceeded those from deforestation. The results of this study clearly demonstrate the importance of accounting greenhouse gases from forest degradation by human activities. The scale of emissions presented indicates that the exclusion of forest degradation from national and international GHG accounting is distorting. This work helps identify where emissions are likely significant, but policy developments are needed to guide when and how accounting should be undertaken. Furthermore, ongoing research is needed to create and enhance cost-effective accounting approaches. read more read less

Topics:

Deforestation (63%)63% related to the paper, Land use, land-use change and forestry (55%)55% related to the paper, Greenhouse gas (55%)55% related to the paper
View PDF
257 Citations
open accessOpen access Journal Article DOI: 10.1186/1750-0680-8-10
Uncertainty in the spatial distribution of tropical forest biomass: a comparison of pan-tropical maps.

Abstract:

Mapping the aboveground biomass of tropical forests is essential both for implementing conservation policy and reducing uncertainties in the global carbon cycle. Two medium resolution (500 m – 1000 m) pantropical maps of vegetation biomass have been recently published, and have been widely used by sub-national and national-le... Mapping the aboveground biomass of tropical forests is essential both for implementing conservation policy and reducing uncertainties in the global carbon cycle. Two medium resolution (500 m – 1000 m) pantropical maps of vegetation biomass have been recently published, and have been widely used by sub-national and national-level activities in relation to Reducing Emissions from Deforestation and forest Degradation (REDD+). Both maps use similar input data layers, and are driven by the same spaceborne LiDAR dataset providing systematic forest height and canopy structure estimates, but use different ground datasets for calibration and different spatial modelling methodologies. Here, we compare these two maps to each other, to the FAO’s Forest Resource Assessment (FRA) 2010 country-level data, and to a high resolution (100 m) biomass map generated for a portion of the Colombian Amazon. We find substantial differences between the two maps, in particular in central Amazonia, the Congo basin, the south of Papua New Guinea, the Miombo woodlands of Africa, and the dry forests and savannas of South America. There is little consistency in the direction of the difference. However, when the maps are aggregated to the country or biome scale there is greater agreement, with differences cancelling out to a certain extent. When comparing country level biomass stocks, the two maps agree with each other to a much greater extent than to the FRA 2010 estimates. In the Colombian Amazon, both pantropical maps estimate higher biomass than the independent high resolution map, but show a similar spatial distribution of this biomass. Biomass mapping has progressed enormously over the past decade, to the stage where we can produce globally consistent maps of aboveground biomass. We show that there are still large uncertainties in these maps, in particular in areas with little field data. However, when used at a regional scale, different maps appear to converge, suggesting we can provide reasonable stock estimates when aggregated over large regions. Therefore we believe the largest uncertainties for REDD+ activities relate to the spatial distribution of biomass and to the spatial pattern of forest cover change, rather than to total globally or nationally summed carbon density. read more read less
View PDF
195 Citations
open accessOpen access Journal Article DOI: 10.1186/1750-0680-2-3
Africa and the global carbon cycle

Abstract:

The African continent has a large and growing role in the global carbon cycle, with potentially important climate change implications. However, the sparse observation network in and around the African continent means that Africa is one of the weakest links in our understanding of the global carbon cycle. Here, we combine data... The African continent has a large and growing role in the global carbon cycle, with potentially important climate change implications. However, the sparse observation network in and around the African continent means that Africa is one of the weakest links in our understanding of the global carbon cycle. Here, we combine data from regional and global inventories as well as forward and inverse model analyses to appraise what is known about Africa's continental-scale carbon dynamics. With low fossil emissions and productivity that largely compensates respiration, land conversion is Africa's primary net carbon release, much of it through burning of forests. Savanna fire emissions, though large, represent a short-term source that is offset by ensuing regrowth. While current data suggest a near zero decadal-scale carbon balance, interannual climate fluctuations (especially drought) induce sizeable variability in net ecosystem productivity and savanna fire emissions such that Africa is a major source of interannual variability in global atmospheric CO2. Considering the continent's sizeable carbon stocks, their seemingly high vulnerability to anticipated climate and land use change, as well as growing populations and industrialization, Africa's carbon emissions and their interannual variability are likely to undergo substantial increases through the 21st century. read more read less

Topics:

Carbon cycle (56%)56% related to the paper, Greenhouse gas (56%)56% related to the paper, Land use, land-use change and forestry (56%)56% related to the paper, Climate change (55%)55% related to the paper
View PDF
189 Citations
open accessOpen access Journal Article DOI: 10.1186/S13021-017-0078-9
Current remote sensing approaches to monitoring forest degradation in support of countries measurement, reporting and verification (MRV) systems for REDD+
Anthea Mitchell1, Ake Rosenqvist, Brice Mora2

Abstract:

Forest degradation is a global phenomenon and while being an important indicator and precursor to further forest loss, carbon emissions due to degradation should also be accounted for in national reporting within the frame of UN REDD+. At regional to country scales, methods have been progressively developed to detect and map ... Forest degradation is a global phenomenon and while being an important indicator and precursor to further forest loss, carbon emissions due to degradation should also be accounted for in national reporting within the frame of UN REDD+. At regional to country scales, methods have been progressively developed to detect and map forest degradation, with these based on multi-resolution optical, synthetic aperture radar (SAR) and/or LiDAR data. However, there is no one single method that can be applied to monitor forest degradation, largely due to the specific nature of the degradation type or process and the timeframe over which it is observed. The review assesses two main approaches to monitoring forest degradation: first, where detection is indicated by a change in canopy cover or proxies, and second, the quantification of loss (or gain) in above ground biomass (AGB). The discussion only considers degradation that has a visible impact on the forest canopy and is thus detectable by remote sensing. The first approach encompasses methods that characterise the type of degradation and track disturbance, detect gaps in, and fragmentation of, the forest canopy, and proxies that provide evidence of forestry activity. Progress in these topics has seen the extension of methods to higher resolution (both spatial and temporal) data to better capture the disturbance signal, distinguish degraded and intact forest, and monitor regrowth. Improvements in the reliability of mapping methods are anticipated by SAR-optical data fusion and use of very high resolution data. The second approach exploits EO sensors with known sensitivity to forest structure and biomass and discusses monitoring efforts using repeat LiDAR and SAR data. There has been progress in the capacity to discriminate forest age and growth stage using data fusion methods and LiDAR height metrics. Interferometric SAR and LiDAR have found new application in linking forest structure change to degradation in tropical forests. Estimates of AGB change have been demonstrated at national level using SAR and LiDAR-assisted approaches. Future improvements are anticipated with the availability of next generation LiDAR sensors. Improved access to relevant satellite data and best available methods are key to operational forest degradation monitoring. Countries will need to prioritise their monitoring efforts depending on the significance of the degradation, balanced against available resources. A better understanding of the drivers and impacts of degradation will help guide monitoring and restoration efforts. Ultimately we want to restore ecosystem service and function in degraded forests before the change is irreversible. read more read less
View PDF
182 Citations
Author Pic

SciSpace is a very innovative solution to the formatting problem and existing providers, such as Mendeley or Word did not really evolve in recent years.

- Andreas Frutiger, Researcher, ETH Zurich, Institute for Biomedical Engineering

Get MS-Word and LaTeX output to any Journal within seconds
1
Choose a template
Select a template from a library of 40,000+ templates
2
Import a MS-Word file or start fresh
It takes only few seconds to import
3
View and edit your final output
SciSpace will automatically format your output to meet journal guidelines
4
Submit directly or Download
Submit to journal directly or Download in PDF, MS Word or LaTeX

(Before submission check for plagiarism via Turnitin)

clock Less than 3 minutes

What to expect from SciSpace?

Speed and accuracy over MS Word

''

With SciSpace, you do not need a word template for Carbon Balance and Management.

It automatically formats your research paper to Springer formatting guidelines and citation style.

You can download a submission ready research paper in pdf, LaTeX and docx formats.

Time comparison

Time taken to format a paper and Compliance with guidelines

Plagiarism Reports via Turnitin

SciSpace has partnered with Turnitin, the leading provider of Plagiarism Check software.

Using this service, researchers can compare submissions against more than 170 million scholarly articles, a database of 70+ billion current and archived web pages. How Turnitin Integration works?

Turnitin Stats
Publisher Logos

Freedom from formatting guidelines

One editor, 100K journal formats – world's largest collection of journal templates

With such a huge verified library, what you need is already there.

publisher-logos

Easy support from all your favorite tools

Automatically format and order your citations and bibliography in a click.

SciSpace allows imports from all reference managers like Mendeley, Zotero, Endnote, Google Scholar etc.

Frequently asked questions

1. Can I write Carbon Balance and Management in LaTeX?

Absolutely not! Our tool has been designed to help you focus on writing. You can write your entire paper as per the Carbon Balance and Management guidelines and auto format it.

2. Do you follow the Carbon Balance and Management guidelines?

Yes, the template is compliant with the Carbon Balance and Management guidelines. Our experts at SciSpace ensure that. If there are any changes to the journal's guidelines, we'll change our algorithm accordingly.

3. Can I cite my article in multiple styles in Carbon Balance and Management?

Of course! We support all the top citation styles, such as APA style, MLA style, Vancouver style, Harvard style, and Chicago style. For example, when you write your paper and hit autoformat, our system will automatically update your article as per the Carbon Balance and Management citation style.

4. Can I use the Carbon Balance and Management templates for free?

Sign up for our free trial, and you'll be able to use all our features for seven days. You'll see how helpful they are and how inexpensive they are compared to other options, Especially for Carbon Balance and Management.

5. Can I use a manuscript in Carbon Balance and Management that I have written in MS Word?

Yes. You can choose the right template, copy-paste the contents from the word document, and click on auto-format. Once you're done, you'll have a publish-ready paper Carbon Balance and Management that you can download at the end.

6. How long does it usually take you to format my papers in Carbon Balance and Management?

It only takes a matter of seconds to edit your manuscript. Besides that, our intuitive editor saves you from writing and formatting it in Carbon Balance and Management.

7. Where can I find the template for the Carbon Balance and Management?

It is possible to find the Word template for any journal on Google. However, why use a template when you can write your entire manuscript on SciSpace , auto format it as per Carbon Balance and Management's guidelines and download the same in Word, PDF and LaTeX formats? Give us a try!.

8. Can I reformat my paper to fit the Carbon Balance and Management's guidelines?

Of course! You can do this using our intuitive editor. It's very easy. If you need help, our support team is always ready to assist you.

9. Carbon Balance and Management an online tool or is there a desktop version?

SciSpace's Carbon Balance and Management is currently available as an online tool. We're developing a desktop version, too. You can request (or upvote) any features that you think would be helpful for you and other researchers in the "feature request" section of your account once you've signed up with us.

10. I cannot find my template in your gallery. Can you create it for me like Carbon Balance and Management?

Sure. You can request any template and we'll have it setup within a few days. You can find the request box in Journal Gallery on the right side bar under the heading, "Couldn't find the format you were looking for like Carbon Balance and Management?”

11. What is the output that I would get after using Carbon Balance and Management?

After writing your paper autoformatting in Carbon Balance and Management, you can download it in multiple formats, viz., PDF, Docx, and LaTeX.

12. Is Carbon Balance and Management's impact factor high enough that I should try publishing my article there?

To be honest, the answer is no. The impact factor is one of the many elements that determine the quality of a journal. Few of these factors include review board, rejection rates, frequency of inclusion in indexes, and Eigenfactor. You need to assess all these factors before you make your final call.

13. What is Sherpa RoMEO Archiving Policy for Carbon Balance and Management?

SHERPA/RoMEO Database

We extracted this data from Sherpa Romeo to help researchers understand the access level of this journal in accordance with the Sherpa Romeo Archiving Policy for Carbon Balance and Management. The table below indicates the level of access a journal has as per Sherpa Romeo's archiving policy.

RoMEO Colour Archiving policy
Green Can archive pre-print and post-print or publisher's version/PDF
Blue Can archive post-print (ie final draft post-refereeing) or publisher's version/PDF
Yellow Can archive pre-print (ie pre-refereeing)
White Archiving not formally supported
FYI:
  1. Pre-prints as being the version of the paper before peer review and
  2. Post-prints as being the version of the paper after peer-review, with revisions having been made.

14. What are the most common citation types In Carbon Balance and Management?

The 5 most common citation types in order of usage for Carbon Balance and Management are:.

S. No. Citation Style Type
1. Author Year
2. Numbered
3. Numbered (Superscripted)
4. Author Year (Cited Pages)
5. Footnote

15. How do I submit my article to the Carbon Balance and Management?

It is possible to find the Word template for any journal on Google. However, why use a template when you can write your entire manuscript on SciSpace , auto format it as per Carbon Balance and Management's guidelines and download the same in Word, PDF and LaTeX formats? Give us a try!.

16. Can I download Carbon Balance and Management in Endnote format?

Yes, SciSpace provides this functionality. After signing up, you would need to import your existing references from Word or Bib file to SciSpace. Then SciSpace would allow you to download your references in Carbon Balance and Management Endnote style according to Elsevier guidelines.

Fast and reliable,
built for complaince.

Instant formatting to 100% publisher guidelines on - SciSpace.
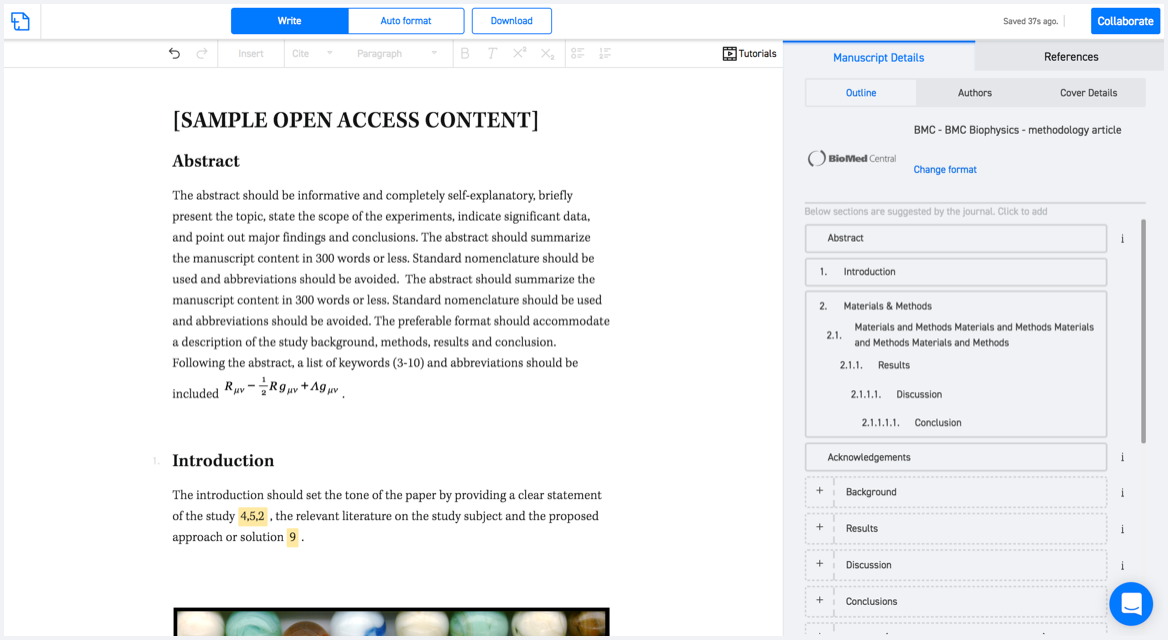
Available only on desktops 🖥

No word template required

Typset automatically formats your research paper to Carbon Balance and Management formatting guidelines and citation style.
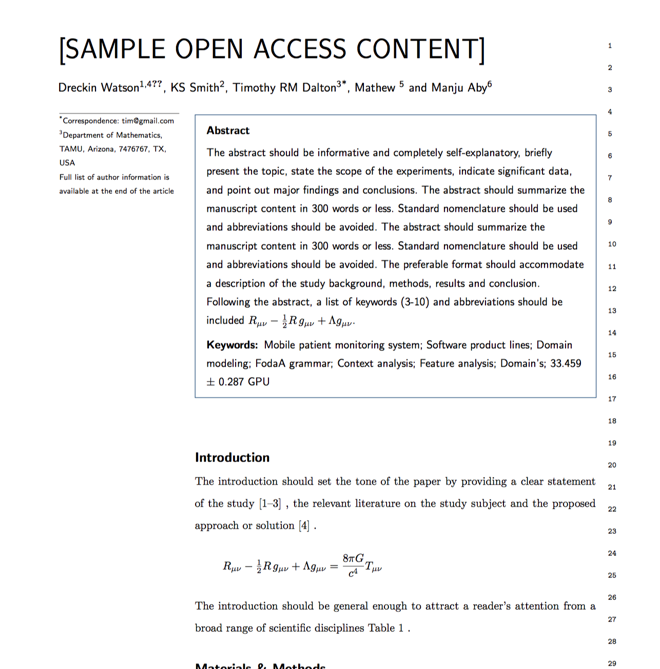
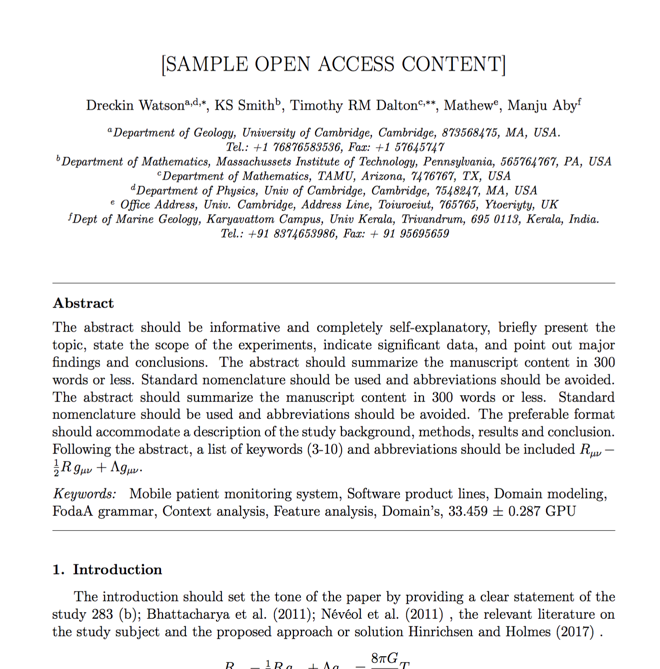
Verifed journal formats

One editor, 100K journal formats.
With the largest collection of verified journal formats, what you need is already there.

Trusted by academicians

I spent hours with MS word for reformatting. It was frustrating - plain and simple. With SciSpace, I can draft my manuscripts and once it is finished I can just submit. In case, I have to submit to another journal it is really just a button click instead of an afternoon of reformatting.

Andreas Frutiger
Researcher & Ex MS Word user
Use this template