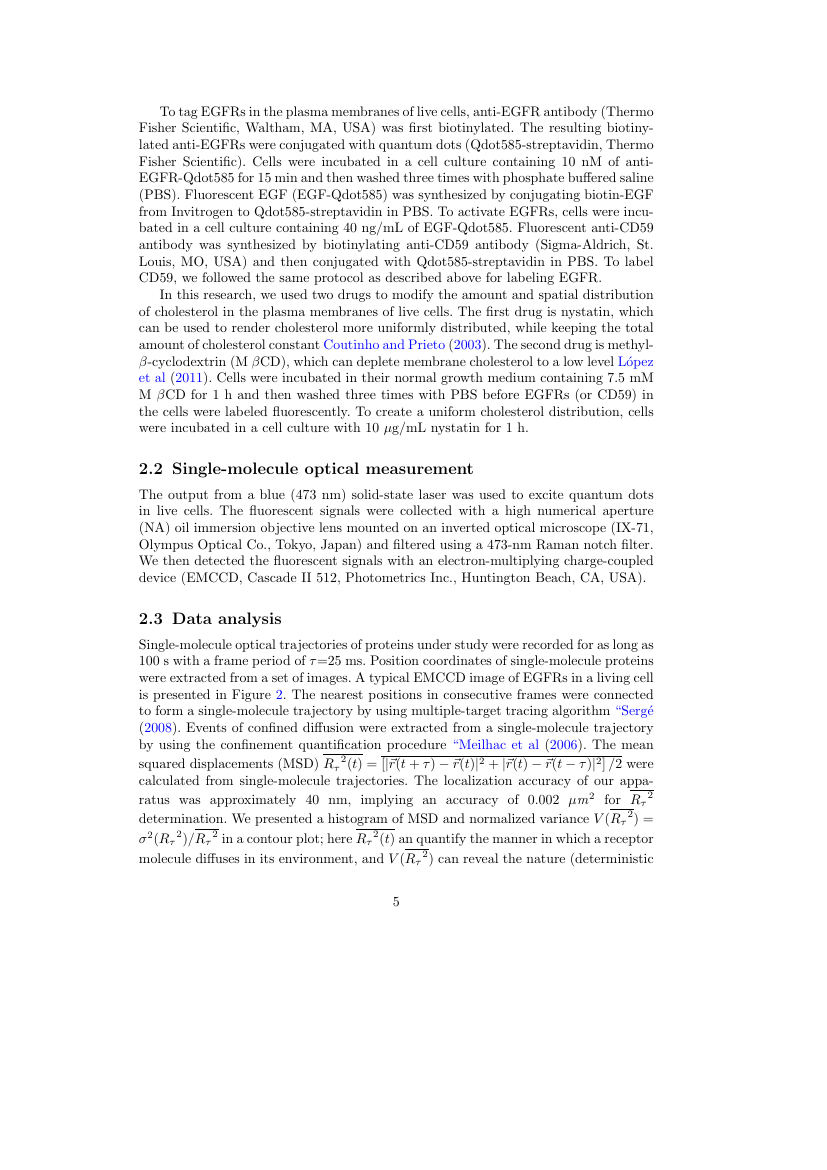
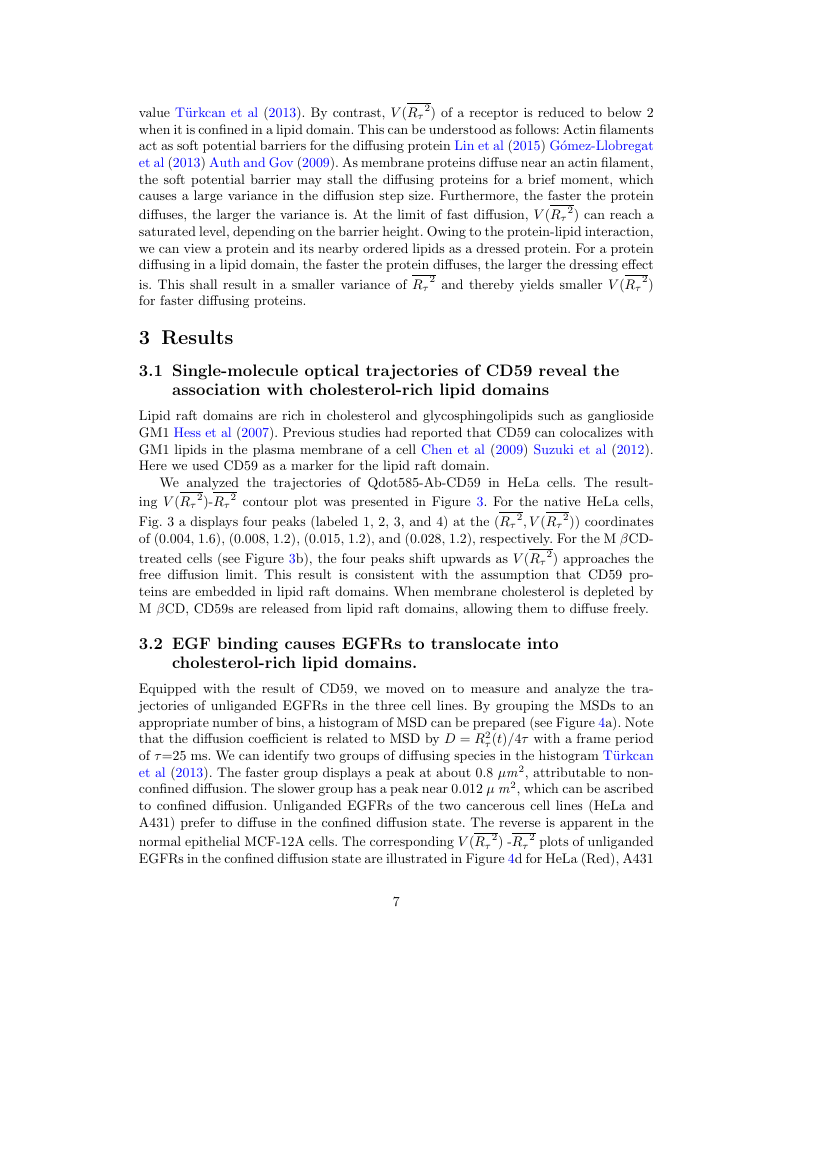
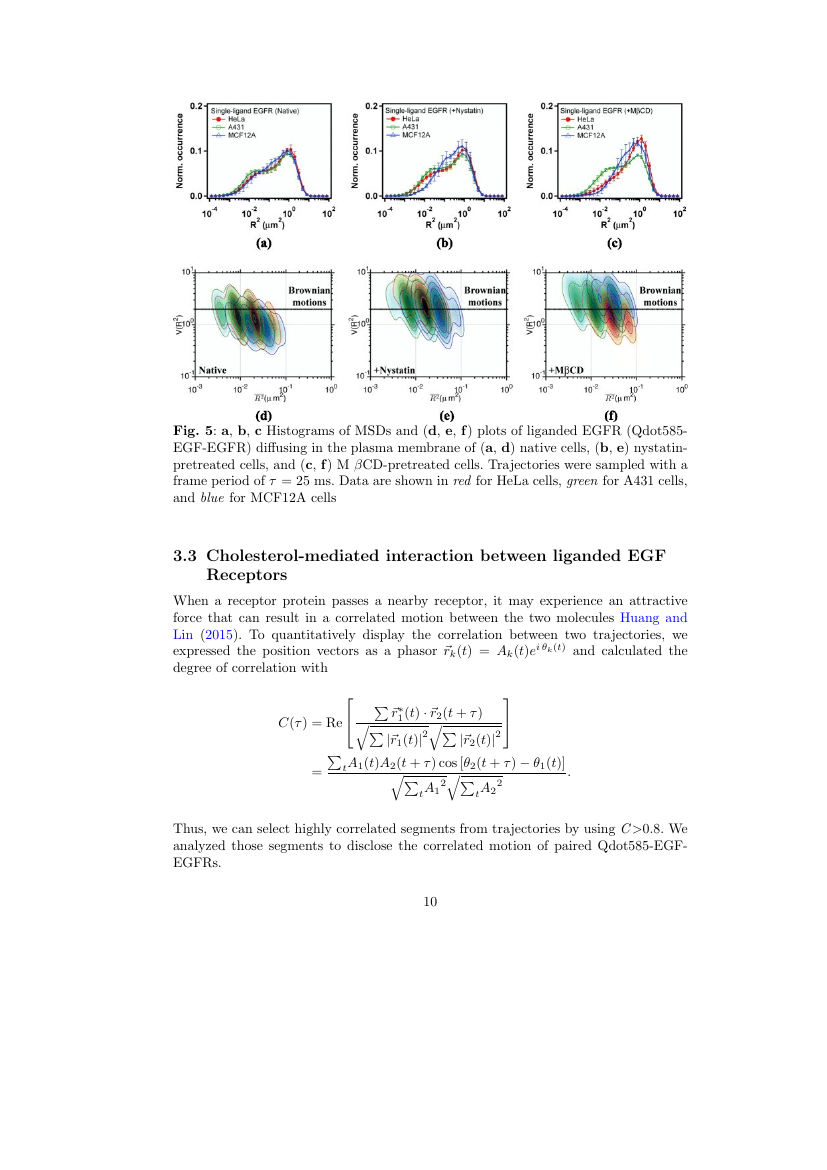
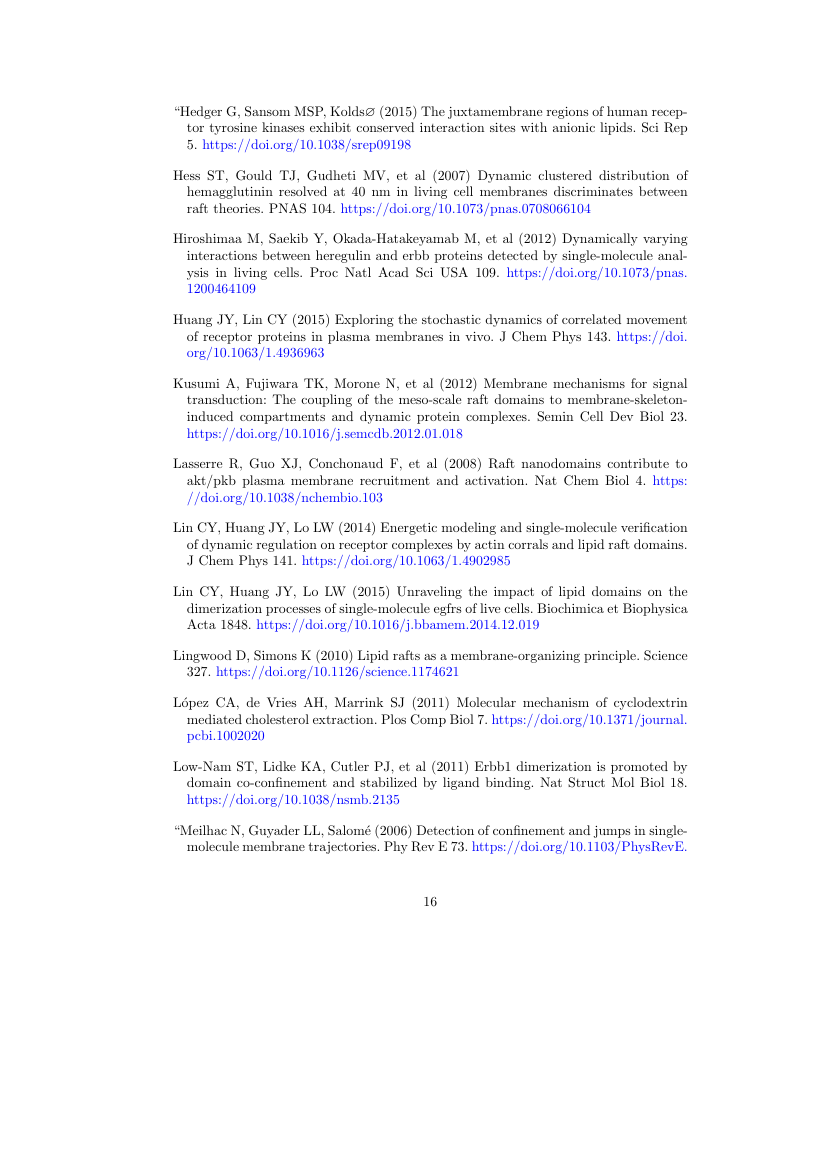
Example of Lifetime Data Analysis format
Recent searches

Example of Lifetime Data Analysis format Example of Lifetime Data Analysis format Example of Lifetime Data Analysis format Example of Lifetime Data Analysis format Example of Lifetime Data Analysis format Example of Lifetime Data Analysis format Example of Lifetime Data Analysis format Example of Lifetime Data Analysis format Example of Lifetime Data Analysis format Example of Lifetime Data Analysis format Example of Lifetime Data Analysis format Example of Lifetime Data Analysis format Example of Lifetime Data Analysis format Example of Lifetime Data Analysis format Example of Lifetime Data Analysis format Example of Lifetime Data Analysis format Example of Lifetime Data Analysis format Example of Lifetime Data Analysis format
Sample paper formatted on SciSpace - SciSpace
This content is only for preview purposes. The original open access content can be found here.
Look Inside
Example of Lifetime Data Analysis format Example of Lifetime Data Analysis format Example of Lifetime Data Analysis format Example of Lifetime Data Analysis format Example of Lifetime Data Analysis format Example of Lifetime Data Analysis format Example of Lifetime Data Analysis format Example of Lifetime Data Analysis format Example of Lifetime Data Analysis format Example of Lifetime Data Analysis format Example of Lifetime Data Analysis format Example of Lifetime Data Analysis format Example of Lifetime Data Analysis format Example of Lifetime Data Analysis format Example of Lifetime Data Analysis format Example of Lifetime Data Analysis format Example of Lifetime Data Analysis format Example of Lifetime Data Analysis format
Sample paper formatted on SciSpace - SciSpace
This content is only for preview purposes. The original open access content can be found here.
open access Open Access

Lifetime Data Analysis — Template for authors

Publisher: Springer
Categories Rank Trend in last 3 yrs
Applied Mathematics #290 of 548 down down by 52 ranks
journal-quality-icon Journal quality:
Medium
calendar-icon Last 4 years overview: 141 Published Papers | 250 Citations
indexed-in-icon Indexed in: Scopus
last-updated-icon Last updated: 13/07/2020
Related journals
Insights
General info
Top papers
Popular templates
Get started guide
Why choose from SciSpace
FAQ

Related Journals

open access Open Access

Taylor and Francis

Quality:  
High
CiteRatio: 1.4
SJR: 0.214
SNIP: 0.992
open access Open Access
recommended Recommended

Taylor and Francis

Quality:  
High
CiteRatio: 6.8
SJR: 1.321
SNIP: 1.764
open access Open Access

Taylor and Francis

Quality:  
High
CiteRatio: 2.5
SJR: 0.685
SNIP: 1.143
open access Open Access

Taylor and Francis

Quality:  
High
CiteRatio: 4.6
SJR: 0.601
SNIP: 1.294

Journal Performance & Insights

Impact Factor

CiteRatio

Determines the importance of a journal by taking a measure of frequency with which the average article in a journal has been cited in a particular year.

A measure of average citations received per peer-reviewed paper published in the journal.

0.794

16% from 2018

Impact factor for Lifetime Data Analysis from 2016 - 2019
Year Value
2019 0.794
2018 0.948
2017 1.0
2016 0.823
graph view Graph view
table view Table view

1.8

20% from 2019

CiteRatio for Lifetime Data Analysis from 2016 - 2020
Year Value
2020 1.8
2019 1.5
2018 1.5
2017 1.5
2016 1.3
graph view Graph view
table view Table view

insights Insights

  • Impact factor of this journal has decreased by 16% in last year.
  • This journal’s impact factor is in the top 10 percentile category.

insights Insights

  • CiteRatio of this journal has increased by 20% in last years.
  • This journal’s CiteRatio is in the top 10 percentile category.

SCImago Journal Rank (SJR)

Source Normalized Impact per Paper (SNIP)

Measures weighted citations received by the journal. Citation weighting depends on the categories and prestige of the citing journal.

Measures actual citations received relative to citations expected for the journal's category.

1.677

125% from 2019

SJR for Lifetime Data Analysis from 2016 - 2020
Year Value
2020 1.677
2019 0.744
2018 1.329
2017 0.985
2016 0.596
graph view Graph view
table view Table view

1.427

31% from 2019

SNIP for Lifetime Data Analysis from 2016 - 2020
Year Value
2020 1.427
2019 1.09
2018 0.999
2017 1.013
2016 0.726
graph view Graph view
table view Table view

insights Insights

  • SJR of this journal has increased by 125% in last years.
  • This journal’s SJR is in the top 10 percentile category.

insights Insights

  • SNIP of this journal has increased by 31% in last years.
  • This journal’s SNIP is in the top 10 percentile category.

Lifetime Data Analysis

Guideline source: View

All company, product and service names used in this website are for identification purposes only. All product names, trademarks and registered trademarks are property of their respective owners.

Use of these names, trademarks and brands does not imply endorsement or affiliation. Disclaimer Notice

Springer

Lifetime Data Analysis

The objective of Lifetime Data Analysis is to advance and promote statistical science in the various applied fields that deal with lifetime data, including: Actuarial Science ? Economics ? Engineering Sciences ? Environmental Sciences ? Management Science ? Medicine ? Operatio...... Read More

Medicine

i
Last updated on
13 Jul 2020
i
ISSN
1380-7870
i
Impact Factor
Medium - 0.676
i
Open Access
No
i
Sherpa RoMEO Archiving Policy
Green faq
i
Plagiarism Check
Available via Turnitin
i
Endnote Style
Download Available
i
Bibliography Name
SPBASIC
i
Citation Type
Author Year
(Blonder et al, 1982)
i
Bibliography Example
Blonder GE, Tinkham M, Klapwijk TM (1982) Transition from metallic to tunneling regimes in superconducting microconstrictions: Excess current, charge imbalance, and supercurrent conversion. Phys Rev B 25(7):4515–4532, URL 10.1103/PhysRevB.25.4515

Top papers written in this journal

Journal Article DOI: 10.1007/BF00985760
Frailty models for survival data
Philip Hougaard1
01 Jan 1995 - Lifetime Data Analysis

Abstract:

A frailty model is a random effects model for time variables, where the random effect (the frailty) has a multiplicative effect on the hazard. It can be used for univariate (independent) failure times, i.e. to describe the influence of unobserved covariates in a proportional hazards model. More interesting, however, is to con... A frailty model is a random effects model for time variables, where the random effect (the frailty) has a multiplicative effect on the hazard. It can be used for univariate (independent) failure times, i.e. to describe the influence of unobserved covariates in a proportional hazards model. More interesting, however, is to consider multivariate (dependent) failure times generated as conditionally independent times given the frailty. This approach can be used both for survival times for individuals, like twins or family members, and for repeated events for the same individual. The standard assumption is to use a gamma distribution for the frailty, but this is a restriction that implies that the dependence is most important for late events. More generally, the distribution can be stable, inverse Gaussian, or follow a power variance function exponential family. Theoretically, large differences are seen between the choices. In practice, using the largest model makes it possible to allow for more general dependence structures, without making the formulas too complicated. read more read less

Topics:

Proportional hazards model (54%)54% related to the paper, Random effects model (54%)54% related to the paper, Gamma distribution (52%)52% related to the paper, Conditional independence (51%)51% related to the paper, Inverse Gaussian distribution (51%)51% related to the paper
541 Citations
Journal Article DOI: 10.1023/B:LIDA.0000036389.14073.DD
Covariates and random effects in a gamma process model with application to degradation and failure.
J. F. Lawless1, Martin Crowder2
01 Sep 2004 - Lifetime Data Analysis

Abstract:

The gamma process is a natural model for degradation processes in which deterioration is supposed to take place gradually over time in a sequence of tiny increments. When units or individuals are observed over time it is often apparent that they degrade at different rates, even though no differences in treatment or environmen... The gamma process is a natural model for degradation processes in which deterioration is supposed to take place gradually over time in a sequence of tiny increments. When units or individuals are observed over time it is often apparent that they degrade at different rates, even though no differences in treatment or environment are present. Thus, in applying gamma-process models to such data, it is necessary to allow for such unexplained differences. In the present paper this is accomplished by constructing a tractable gamma-process model incorporating a random effect. The model is fitted to some data on crack growth and corresponding goodness-of-fit tests are carried out. Prediction calculations for failure times defined in terms of degradation level passages are developed and illustrated. read more read less

Topics:

Random effects model (53%)53% related to the paper, Gamma process (51%)51% related to the paper
525 Citations
Journal Article DOI: 10.1023/A:1009664101413
Modelling Accelerated Degradation Data Using Wiener Diffusion With A Time Scale Transformation
G. A. Whitmore1, Fred Schenkelberg2
01 Jan 1997 - Lifetime Data Analysis

Abstract:

Engineering degradation tests allow industry to assess the potential life span of long-life products that do not fail readily under accelerated conditions in life tests. A general statistical model is presented here for performance degradation of an item of equipment. The degradation process in the model is taken to be a Wien... Engineering degradation tests allow industry to assess the potential life span of long-life products that do not fail readily under accelerated conditions in life tests. A general statistical model is presented here for performance degradation of an item of equipment. The degradation process in the model is taken to be a Wiener diffusion process with a time scale transformation. The model incorporates Arrhenius extrapolation for high stress testing. The lifetime of an item is defined as the time until performance deteriorates to a specified failure threshold. The model can be used to predict the lifetime of an item or the extent of degradation of an item at a specified future time. Inference methods for the model parameters, based on accelerated degradation test data, are presented. The model and inference methods are illustrated with a case application involving self-regulating heating cables. The paper also discusses a number of practical issues encountered in applications. read more read less

Topics:

Accelerated life testing (59%)59% related to the paper, Statistical model (52%)52% related to the paper
449 Citations
Journal Article DOI: 10.1007/S10985-005-5237-8
Accelerated Degradation Models for Failure Based on Geometric Brownian Motion and Gamma Processes
Chanseok Park1, W. J. Padgett1
01 Dec 2005 - Lifetime Data Analysis

Abstract:

Based on a generalized cumulative damage approach with a stochastic process describing degradation, new accelerated life test models are presented in which both observed failures and degradation measures can be considered for parametric inference of system lifetime. Incorporating an accelerated test variable, we provide sever... Based on a generalized cumulative damage approach with a stochastic process describing degradation, new accelerated life test models are presented in which both observed failures and degradation measures can be considered for parametric inference of system lifetime. Incorporating an accelerated test variable, we provide several new accelerated degradation models for failure based on the geometric Brownian motion or gamma process. It is shown that in most cases, our models for failure can be approximated closely by accelerated test versions of Birnbaum–Saunders and inverse Gaussian distributions. Estimation of model parameters and a model selection procedure are discussed, and two illustrative examples using real data for carbon-film resistors and fatigue crack size are presented. read more read less

Topics:

Geometric Brownian motion (54%)54% related to the paper, Inverse Gaussian distribution (52%)52% related to the paper, Stochastic process (52%)52% related to the paper, Gamma process (50%)50% related to the paper, Model selection (50%)50% related to the paper
380 Citations
Journal Article DOI: 10.1007/BF00985762
Estimating degradation by a wiener diffusion process subject to measurement error
G. A. Whitmore1
01 Jan 1995 - Lifetime Data Analysis

Abstract:

Most materials and components degrade physically before they fail. Engineering degradation tests are designed to measure these degradation processes. Measurements in the tests reflect the inherent randomness of degradation itself as well as measurement errors created by imperfect instruments, procedures and environments. This... Most materials and components degrade physically before they fail. Engineering degradation tests are designed to measure these degradation processes. Measurements in the tests reflect the inherent randomness of degradation itself as well as measurement errors created by imperfect instruments, procedures and environments. This paper describes a statistical model for measured degradation data that takes both sources of variation into account. The degradation process in the model is taken to be a Wiener diffusion process. The measurement errors are assumed to be independent normal random outcomes that are independent of the degradation process. The paper describes inference procedures for the model and discusses some practical issues that must be considered in dealing with the statistical problem. A case study is presented. read more read less

Topics:

Statistical model (53%)53% related to the paper
315 Citations
Author Pic

SciSpace is a very innovative solution to the formatting problem and existing providers, such as Mendeley or Word did not really evolve in recent years.

- Andreas Frutiger, Researcher, ETH Zurich, Institute for Biomedical Engineering

Get MS-Word and LaTeX output to any Journal within seconds
1
Choose a template
Select a template from a library of 40,000+ templates
2
Import a MS-Word file or start fresh
It takes only few seconds to import
3
View and edit your final output
SciSpace will automatically format your output to meet journal guidelines
4
Submit directly or Download
Submit to journal directly or Download in PDF, MS Word or LaTeX

(Before submission check for plagiarism via Turnitin)

clock Less than 3 minutes

What to expect from SciSpace?

Speed and accuracy over MS Word

''

With SciSpace, you do not need a word template for Lifetime Data Analysis.

It automatically formats your research paper to Springer formatting guidelines and citation style.

You can download a submission ready research paper in pdf, LaTeX and docx formats.

Time comparison

Time taken to format a paper and Compliance with guidelines

Plagiarism Reports via Turnitin

SciSpace has partnered with Turnitin, the leading provider of Plagiarism Check software.

Using this service, researchers can compare submissions against more than 170 million scholarly articles, a database of 70+ billion current and archived web pages. How Turnitin Integration works?

Turnitin Stats
Publisher Logos

Freedom from formatting guidelines

One editor, 100K journal formats – world's largest collection of journal templates

With such a huge verified library, what you need is already there.

publisher-logos

Easy support from all your favorite tools

Lifetime Data Analysis format uses SPBASIC citation style.

Automatically format and order your citations and bibliography in a click.

SciSpace allows imports from all reference managers like Mendeley, Zotero, Endnote, Google Scholar etc.

Frequently asked questions

1. Can I write Lifetime Data Analysis in LaTeX?

Absolutely not! Our tool has been designed to help you focus on writing. You can write your entire paper as per the Lifetime Data Analysis guidelines and auto format it.

2. Do you follow the Lifetime Data Analysis guidelines?

Yes, the template is compliant with the Lifetime Data Analysis guidelines. Our experts at SciSpace ensure that. If there are any changes to the journal's guidelines, we'll change our algorithm accordingly.

3. Can I cite my article in multiple styles in Lifetime Data Analysis?

Of course! We support all the top citation styles, such as APA style, MLA style, Vancouver style, Harvard style, and Chicago style. For example, when you write your paper and hit autoformat, our system will automatically update your article as per the Lifetime Data Analysis citation style.

4. Can I use the Lifetime Data Analysis templates for free?

Sign up for our free trial, and you'll be able to use all our features for seven days. You'll see how helpful they are and how inexpensive they are compared to other options, Especially for Lifetime Data Analysis.

5. Can I use a manuscript in Lifetime Data Analysis that I have written in MS Word?

Yes. You can choose the right template, copy-paste the contents from the word document, and click on auto-format. Once you're done, you'll have a publish-ready paper Lifetime Data Analysis that you can download at the end.

6. How long does it usually take you to format my papers in Lifetime Data Analysis?

It only takes a matter of seconds to edit your manuscript. Besides that, our intuitive editor saves you from writing and formatting it in Lifetime Data Analysis.

7. Where can I find the template for the Lifetime Data Analysis?

It is possible to find the Word template for any journal on Google. However, why use a template when you can write your entire manuscript on SciSpace , auto format it as per Lifetime Data Analysis's guidelines and download the same in Word, PDF and LaTeX formats? Give us a try!.

8. Can I reformat my paper to fit the Lifetime Data Analysis's guidelines?

Of course! You can do this using our intuitive editor. It's very easy. If you need help, our support team is always ready to assist you.

9. Lifetime Data Analysis an online tool or is there a desktop version?

SciSpace's Lifetime Data Analysis is currently available as an online tool. We're developing a desktop version, too. You can request (or upvote) any features that you think would be helpful for you and other researchers in the "feature request" section of your account once you've signed up with us.

10. I cannot find my template in your gallery. Can you create it for me like Lifetime Data Analysis?

Sure. You can request any template and we'll have it setup within a few days. You can find the request box in Journal Gallery on the right side bar under the heading, "Couldn't find the format you were looking for like Lifetime Data Analysis?”

11. What is the output that I would get after using Lifetime Data Analysis?

After writing your paper autoformatting in Lifetime Data Analysis, you can download it in multiple formats, viz., PDF, Docx, and LaTeX.

12. Is Lifetime Data Analysis's impact factor high enough that I should try publishing my article there?

To be honest, the answer is no. The impact factor is one of the many elements that determine the quality of a journal. Few of these factors include review board, rejection rates, frequency of inclusion in indexes, and Eigenfactor. You need to assess all these factors before you make your final call.

13. What is Sherpa RoMEO Archiving Policy for Lifetime Data Analysis?

SHERPA/RoMEO Database

We extracted this data from Sherpa Romeo to help researchers understand the access level of this journal in accordance with the Sherpa Romeo Archiving Policy for Lifetime Data Analysis. The table below indicates the level of access a journal has as per Sherpa Romeo's archiving policy.

RoMEO Colour Archiving policy
Green Can archive pre-print and post-print or publisher's version/PDF
Blue Can archive post-print (ie final draft post-refereeing) or publisher's version/PDF
Yellow Can archive pre-print (ie pre-refereeing)
White Archiving not formally supported
FYI:
  1. Pre-prints as being the version of the paper before peer review and
  2. Post-prints as being the version of the paper after peer-review, with revisions having been made.

14. What are the most common citation types In Lifetime Data Analysis?

The 5 most common citation types in order of usage for Lifetime Data Analysis are:.

S. No. Citation Style Type
1. Author Year
2. Numbered
3. Numbered (Superscripted)
4. Author Year (Cited Pages)
5. Footnote

15. How do I submit my article to the Lifetime Data Analysis?

It is possible to find the Word template for any journal on Google. However, why use a template when you can write your entire manuscript on SciSpace , auto format it as per Lifetime Data Analysis's guidelines and download the same in Word, PDF and LaTeX formats? Give us a try!.

16. Can I download Lifetime Data Analysis in Endnote format?

Yes, SciSpace provides this functionality. After signing up, you would need to import your existing references from Word or Bib file to SciSpace. Then SciSpace would allow you to download your references in Lifetime Data Analysis Endnote style according to Elsevier guidelines.

Fast and reliable,
built for complaince.

Instant formatting to 100% publisher guidelines on - SciSpace.
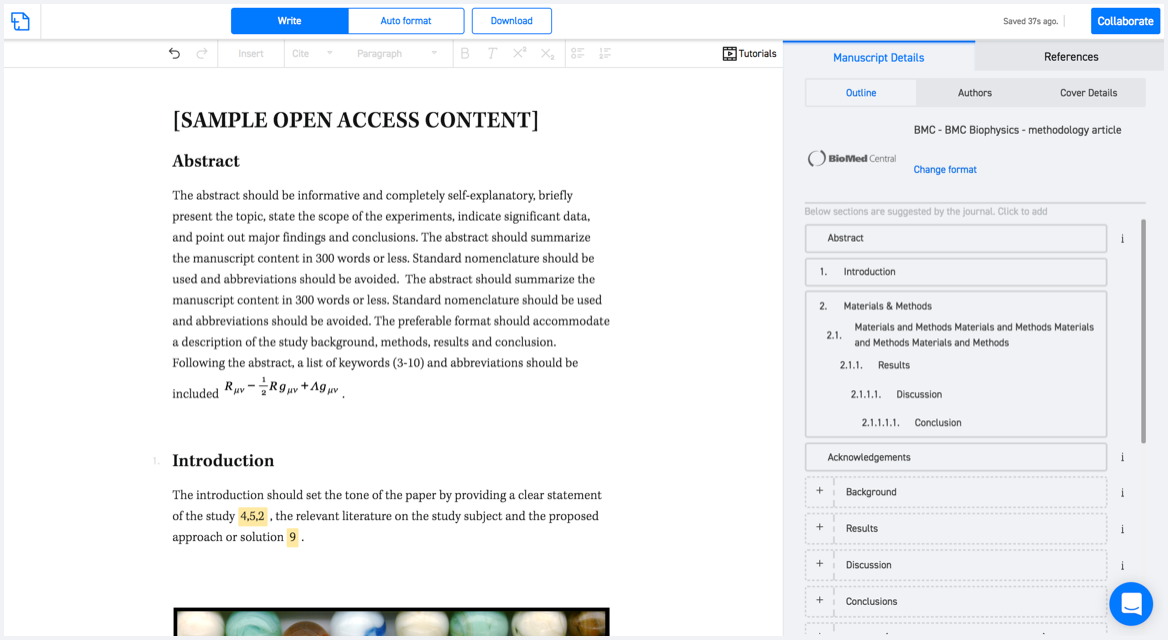
Available only on desktops 🖥

No word template required

Typset automatically formats your research paper to Lifetime Data Analysis formatting guidelines and citation style.
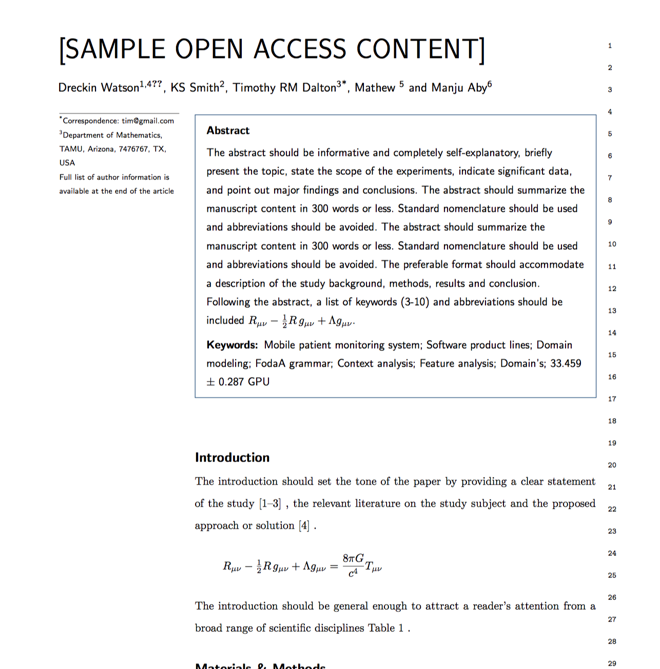
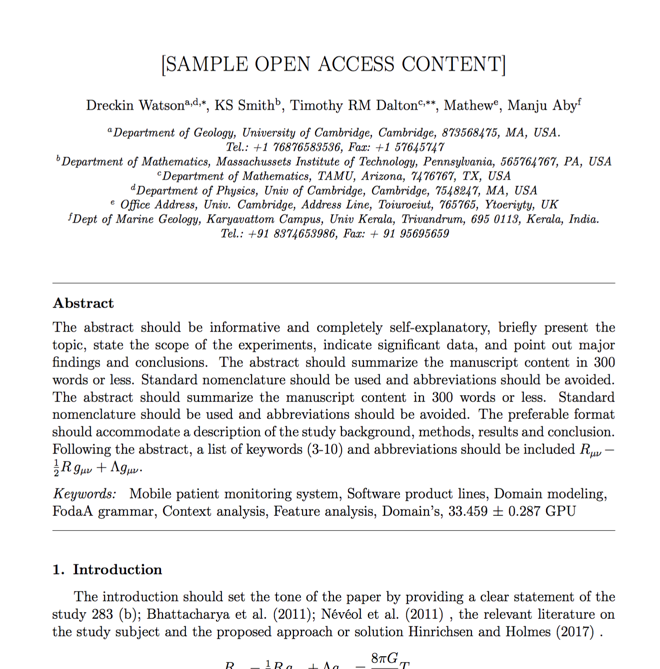
Verifed journal formats

One editor, 100K journal formats.
With the largest collection of verified journal formats, what you need is already there.

Trusted by academicians

I spent hours with MS word for reformatting. It was frustrating - plain and simple. With SciSpace, I can draft my manuscripts and once it is finished I can just submit. In case, I have to submit to another journal it is really just a button click instead of an afternoon of reformatting.

Andreas Frutiger
Researcher & Ex MS Word user
Use this template