Example of Diversity and Distributions format
Recent searches

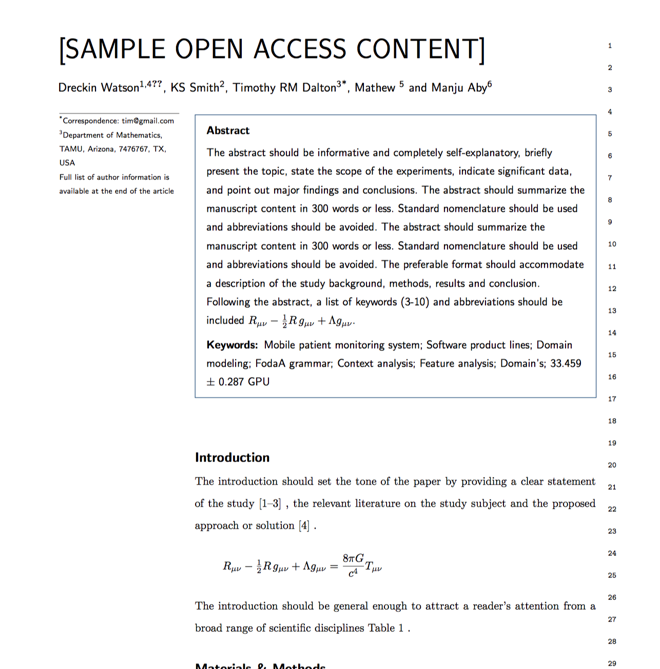
Example of Diversity and Distributions format Example of Diversity and Distributions format Example of Diversity and Distributions format Example of Diversity and Distributions format Example of Diversity and Distributions format Example of Diversity and Distributions format Example of Diversity and Distributions format Example of Diversity and Distributions format Example of Diversity and Distributions format Example of Diversity and Distributions format Example of Diversity and Distributions format Example of Diversity and Distributions format Example of Diversity and Distributions format Example of Diversity and Distributions format Example of Diversity and Distributions format Example of Diversity and Distributions format Example of Diversity and Distributions format Example of Diversity and Distributions format Example of Diversity and Distributions format
Sample paper formatted on SciSpace - SciSpace
This content is only for preview purposes. The original open access content can be found here.
Look Inside
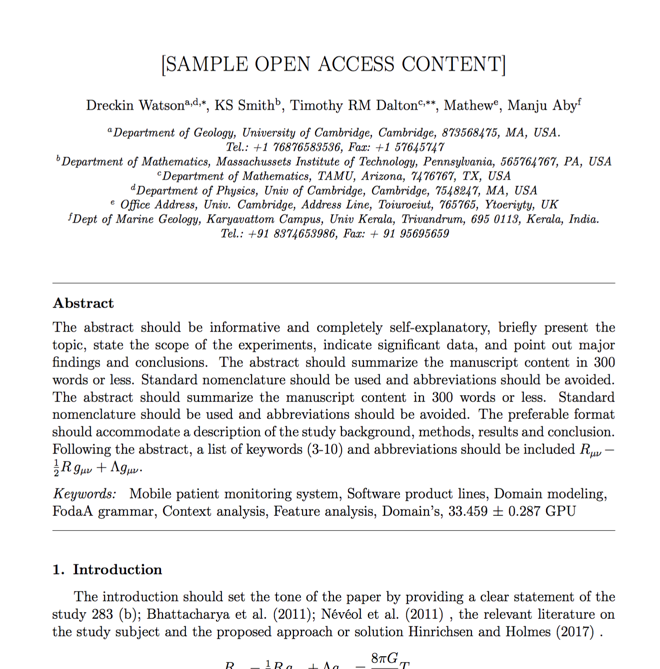
Example of Diversity and Distributions format Example of Diversity and Distributions format Example of Diversity and Distributions format Example of Diversity and Distributions format Example of Diversity and Distributions format Example of Diversity and Distributions format Example of Diversity and Distributions format Example of Diversity and Distributions format Example of Diversity and Distributions format Example of Diversity and Distributions format Example of Diversity and Distributions format Example of Diversity and Distributions format Example of Diversity and Distributions format Example of Diversity and Distributions format Example of Diversity and Distributions format Example of Diversity and Distributions format Example of Diversity and Distributions format Example of Diversity and Distributions format Example of Diversity and Distributions format
Sample paper formatted on SciSpace - SciSpace
This content is only for preview purposes. The original open access content can be found here.
open access Open Access
recommended Recommended

Diversity and Distributions — Template for authors

Publisher: Wiley
Categories Rank Trend in last 3 yrs
Ecology, Evolution, Behavior and Systematics #46 of 647 down down by 13 ranks
journal-quality-icon Journal quality:
High
calendar-icon Last 4 years overview: 534 Published Papers | 3782 Citations
indexed-in-icon Indexed in: Scopus
last-updated-icon Last updated: 20/06/2020
Related journals
Insights
General info
Top papers
Popular templates
Get started guide
Why choose from SciSpace
FAQ

Related Journals

open access Open Access

Hindawi

Quality:  
High
CiteRatio: 3.1
SJR: 0.429
SNIP: 1.331
open access Open Access
recommended Recommended

PLOS

Quality:  
High
CiteRatio: 7.3
SJR: 2.628
SNIP: 1.713
open access Open Access
recommended Recommended

PLOS

Quality:  
High
CiteRatio: 9.0
SJR: 3.587
SNIP: 1.457
open access Open Access

Cambridge University Press

Quality:  
High
CiteRatio: 4.2
SJR: 0.785
SNIP: 1.061

Journal Performance & Insights

Impact Factor

CiteRatio

Determines the importance of a journal by taking a measure of frequency with which the average article in a journal has been cited in a particular year.

A measure of average citations received per peer-reviewed paper published in the journal.

3.993

2% from 2018

Impact factor for Diversity and Distributions from 2016 - 2019
Year Value
2019 3.993
2018 4.092
2017 4.614
2016 4.391
graph view Graph view
table view Table view

7.1

6% from 2019

CiteRatio for Diversity and Distributions from 2016 - 2020
Year Value
2020 7.1
2019 6.7
2018 7.7
2017 8.0
2016 8.1
graph view Graph view
table view Table view

insights Insights

  • Impact factor of this journal has decreased by 2% in last year.
  • This journal’s impact factor is in the top 10 percentile category.

insights Insights

  • CiteRatio of this journal has increased by 6% in last years.
  • This journal’s CiteRatio is in the top 10 percentile category.

SCImago Journal Rank (SJR)

Source Normalized Impact per Paper (SNIP)

Measures weighted citations received by the journal. Citation weighting depends on the categories and prestige of the citing journal.

Measures actual citations received relative to citations expected for the journal's category.

1.918

7% from 2019

SJR for Diversity and Distributions from 2016 - 2020
Year Value
2020 1.918
2019 2.067
2018 2.278
2017 2.521
2016 2.749
graph view Graph view
table view Table view

1.497

3% from 2019

SNIP for Diversity and Distributions from 2016 - 2020
Year Value
2020 1.497
2019 1.542
2018 1.685
2017 1.616
2016 1.566
graph view Graph view
table view Table view

insights Insights

  • SJR of this journal has decreased by 7% in last years.
  • This journal’s SJR is in the top 10 percentile category.

insights Insights

  • SNIP of this journal has decreased by 3% in last years.
  • This journal’s SNIP is in the top 10 percentile category.
Diversity and Distributions

Guideline source: View

All company, product and service names used in this website are for identification purposes only. All product names, trademarks and registered trademarks are property of their respective owners.

Use of these names, trademarks and brands does not imply endorsement or affiliation. Disclaimer Notice

Wiley

Diversity and Distributions

Conservation Biology welcomes submissions that address the science and practice of conserving Earth's biological diversity. We encourage submissions that emphasize issues germane to any of Earth's ecosystems or geographic regions and that apply diverse approaches to analyses a...... Read More

Ecology, Evolution, Behavior and Systematics

Agricultural and Biological Sciences

i
Last updated on
19 Jun 2020
i
ISSN
1366-9516
i
Impact Factor
High - 1.928
i
Acceptance Rate
20%
i
Open Access
Yes
i
Sherpa RoMEO Archiving Policy
Yellow faq
i
Plagiarism Check
Available via Turnitin
i
Endnote Style
Download Available
i
Bibliography Name
apa
i
Citation Type
Numbered
[25]
i
Bibliography Example
Beenakker, C.W.J. (2006) Specular andreev reflection in graphene.Phys. Rev. Lett., 97 (6), 067 007. URL 10.1103/PhysRevLett.97.067007.

Top papers written in this journal

open accessOpen access Journal Article DOI: 10.1111/J.1472-4642.2010.00725.X
A statistical explanation of MaxEnt for ecologists
Jane Elith1, Steven J. Phillips2, Trevor Hastie3, Miroslav Dudík4, Yung En Chee1, Colin J. Yates5

Abstract:

MaxEnt is a program for modelling species distributions from presence-only species records. This paper is written for ecologists and describes the MaxEnt model from a statistical perspective, making explicit links between the structure of the model, decisions required in producing a modelled distribution, and knowledge about ... MaxEnt is a program for modelling species distributions from presence-only species records. This paper is written for ecologists and describes the MaxEnt model from a statistical perspective, making explicit links between the structure of the model, decisions required in producing a modelled distribution, and knowledge about the species and the data that might affect those decisions. To begin we discuss the characteristics of presence-only data, highlighting implications for modelling distributions. We particularly focus on the problems of sample bias and lack of information on species prevalence. The keystone of the paper is a new statistical explanation of MaxEnt which shows that the model minimizes the relative entropy between two probability densities (one estimated from the presence data and one, from the landscape) defined in covariate space. For many users, this viewpoint is likely to be a more accessible way to understand the model than previous ones that rely on machine learning concepts. We then step through a detailed explanation of MaxEnt describing key components (e.g. covariates and features, and definition of the landscape extent), the mechanics of model fitting (e.g. feature selection, constraints and regularization) and outputs. Using case studies for a Banksia species native to south-west Australia and a riverine fish, we fit models and interpret them, exploring why certain choices affect the result and what this means. The fish example illustrates use of the model with vector data for linear river segments rather than raster (gridded) data. Appropriate treatments for survey bias, unprojected data, locally restricted species, and predicting to environments outside the range of the training data are demonstrated, and new capabilities discussed. Online appendices include additional details of the model and the mathematical links between previous explanations and this one, example code and data, and further information on the case studies. read more read less

Topics:

Environmental niche modelling (51%)51% related to the paper
View PDF
4,621 Citations
open accessOpen access Journal Article DOI: 10.1046/J.1472-4642.2000.00083.X
Naturalization and invasion of alien plants: concepts and definitions

Abstract:

. Much confusion exists in the English-language literature on plant invasions concerning the terms ‘naturalized’ and ‘invasive’ and their associated concepts. Several authors have used these terms in proposing schemes for conceptualizing the sequence of events from introduction to invasion, but often imprecisely, erroneously ... . Much confusion exists in the English-language literature on plant invasions concerning the terms ‘naturalized’ and ‘invasive’ and their associated concepts. Several authors have used these terms in proposing schemes for conceptualizing the sequence of events from introduction to invasion, but often imprecisely, erroneously or in contradictory ways. This greatly complicates the formulation of robust generalizations in invasion ecology. Based on an extensive and critical survey of the literature we defined a minimum set of key terms related to a graphic scheme which conceptualizes the naturalization/invasion process. Introduction means that the plant (or its propagule) has been transported by humans across a major geographical barrier. Naturalization starts when abiotic and biotic barriers to survival are surmounted and when various barriers to regular reproduction are overcome. Invasion further requires that introduced plants produce reproductive offspring in areas distant from sites of introduction (approximate scales: > 100 m over  6 m/3 years for taxa spreading by roots, rhizomes, stolons or creeping stems). Taxa that can cope with the abiotic environment and biota in the general area may invade disturbed, seminatural communities. Invasion of successionally mature, undisturbed communities usually requires that the alien taxon overcomes a different category of barriers. We propose that the term ‘invasive’ should be used without any inference to environmental or economic impact. Terms like ‘pests’ and ‘weeds’ are suitable labels for the 50–80% of invaders that have harmful effects. About 10% of invasive plants that change the character, condition, form, or nature of ecosystems over substantial areas may be termed ‘transformers’. read more read less

Topics:

Propagule pressure (51%)51% related to the paper
View PDF
3,516 Citations
Journal Article DOI: 10.1111/J.1472-4642.2008.00482.X
Effects of sample size on the performance of species distribution models
Mary S. Wisz1, Robert J. Hijmans2, Jin Li, A. T. Peterson3, Catherine H. Graham4, Antoine Guisan5

Abstract:

A wide range of modelling algorithms is used by ecologists, conservation practitioners, and others to predict species ranges from point locality data. Unfortunately, the amount of data available is limited for many taxa and regions, making it essential to quantify the sensitivity of these algorithms to sample size. This is th... A wide range of modelling algorithms is used by ecologists, conservation practitioners, and others to predict species ranges from point locality data. Unfortunately, the amount of data available is limited for many taxa and regions, making it essential to quantify the sensitivity of these algorithms to sample size. This is the first study to address this need by rigorously evaluating a broad suite of algorithms with independent presence‐absence data from multiple species and regions. We evaluated predictions from 12 algorithms for 46 species (from six different regions of the world) at three sample sizes (100, 30, and 10 records). We used data from natural history collections to run the models, and evaluated the quality of model predictions with area under the receiver operating characteristic curve (AUC). With decreasing sample size, model accuracy decreased and variability increased across species and between models. Novel modelling methods that incorporate both interactions between predictor variables and complex response shapes (i.e. GBM, MARS-INT, BRUTO) performed better than most methods at large sample sizes but not at the smallest sample sizes. Other algorithms were much less sensitive to sample size, including an algorithm based on maximum entropy (MAXENT) that had among the best predictive power across all sample sizes. Relative to other algorithms, a distance metric algorithm (DOMAIN) and a genetic algorithm (OM-GARP) had intermediate performance at the largest sample size and among the best performance at the lowest sample size. No algorithm predicted consistently well with small sample size ( n < 30) and this should encourage highly conservative use of predictions based on small sample size and restrict their use to exploratory modelling. read more read less

Topics:

Sample size determination (66%)66% related to the paper, Range (statistics) (51%)51% related to the paper
View PDF
1,906 Citations
Journal Article DOI: 10.1111/J.1472-4642.2008.00491.X
Evaluation of consensus methods in predictive species distribution modelling
Mathieu Marmion1, Miia Parviainen1, Miska Luoto1, Risto K. Heikkinen2, Wilfried Thuiller3

Abstract:

Aim Spatial modelling techniques are increasingly used in species distribution modelling. However, the implemented techniques differ in their modelling performance, and some consensus methods are needed to reduce the uncertainty of predictions. In this study, we tested the predictive accuracies of five consensus methods, name... Aim Spatial modelling techniques are increasingly used in species distribution modelling. However, the implemented techniques differ in their modelling performance, and some consensus methods are needed to reduce the uncertainty of predictions. In this study, we tested the predictive accuracies of five consensus methods, namely Weighted Average (WA), Mean(All), Median(All), Median(PCA), and Best, for 28 threatened plant species. Location  North-eastern Finland, Europe. Methods  The spatial distributions of the plant species were forecasted using eight state-of-the-art single-modelling techniques providing an ensemble of predictions. The probability values of occurrence were then combined using five consensus algorithms. The predictive accuracies of the single-model and consensus methods were assessed by computing the area under the curve (AUC) of the receiver-operating characteristic plot. Results  The mean AUC values varied between 0.697 (classification tree analysis) and 0.813 (random forest) for the single-models, and from 0.757 to 0.850 for the consensus methods. WA and Mean(All) consensus methods provided significantly more robust predictions than all the single-models and the other consensus methods. Main conclusions  Consensus methods based on average function algorithms may increase significantly the accuracy of species distribution forecasts, and thus they show considerable promise for different conservation biological and biogeographical applications. read more read less
View PDF
1,097 Citations
open accessOpen access Journal Article DOI: 10.1111/J.1366-9516.2005.00143.X
Conservation biogeography: assessment and prospect

Abstract:

There is general agreement among scientists that biodiversity is under assault on a global basis and that species are being lost at a greatly enhanced rate. This article examines the role played by biogeographical science in the emergence of conservation guidance and makes the case for the recognition of Conservation Biogeogr... There is general agreement among scientists that biodiversity is under assault on a global basis and that species are being lost at a greatly enhanced rate. This article examines the role played by biogeographical science in the emergence of conservation guidance and makes the case for the recognition of Conservation Biogeography as a key subfield of conservation biology delimited as: the application of biogeographical principles, theories, and analyses, being those concerned with the distributional dynamics of taxa individually and collectively, to problems concerning the conservation of biodiversity. Conservation biogeography thus encompasses both a substantial body of theory and analysis, and some of the most prominent planning frameworks used in conservation. Considerable advances in conservation guidelines have been made over the last few decades by applying biogeographical methods and principles. Herein we provide a critical review focussed on the sensitivity to assumptions inherent in the applications we examine. In particular, we focus on four inter-related factors: (i) scale dependency (both spatial and temporal); (ii) inadequacies in taxonomic and distributional data (the so-called Linnean and Wallacean shortfalls); (iii) effects of model structure and parameterisation; and (iv) inadequacies of theory. These generic problems are illustrated by reference to studies ranging from the application of historical biogeography, through island biogeography, and complementarity analyses to bioclimatic envelope modelling. There is a great deal of uncertainty inherent in predictive analyses in conservation biogeography and this area in particular presents considerable challenges. Protected area planning frameworks and their resulting map outputs are amongst the most powerful and influential applications within conservation biogeography, and at the global scale are characterised by the production, by a small number of prominent NGOs, of bespoke schemes, which serve both to mobilise funds and channel efforts in a highly targeted fashion. We provide a simple typology of protected area planning frameworks, with particular reference to the global scale, and provide a brief critique of some of their strengths and weaknesses. Finally, we discuss the importance, especially at regional scales, of developing more responsive analyses and models that integrate pattern (the compositionalist approach) and processes (the functionalist approach) such as range collapse and climate change, again noting the sensitivity of outcomes to starting assumptions. We make the case for the greater engagement of the biogeographical community in a programme of evaluation and refinement of all such schemes to test their robustness and their sensitivity to alternative conservation priorities and goals. read more read less

Topics:

Insular biogeography (54%)54% related to the paper, Conservation biology (51%)51% related to the paper
View PDF
1,030 Citations
Author Pic

SciSpace is a very innovative solution to the formatting problem and existing providers, such as Mendeley or Word did not really evolve in recent years.

- Andreas Frutiger, Researcher, ETH Zurich, Institute for Biomedical Engineering

Get MS-Word and LaTeX output to any Journal within seconds
1
Choose a template
Select a template from a library of 40,000+ templates
2
Import a MS-Word file or start fresh
It takes only few seconds to import
3
View and edit your final output
SciSpace will automatically format your output to meet journal guidelines
4
Submit directly or Download
Submit to journal directly or Download in PDF, MS Word or LaTeX

(Before submission check for plagiarism via Turnitin)

clock Less than 3 minutes

What to expect from SciSpace?

Speed and accuracy over MS Word

''

With SciSpace, you do not need a word template for Diversity and Distributions.

It automatically formats your research paper to Wiley formatting guidelines and citation style.

You can download a submission ready research paper in pdf, LaTeX and docx formats.

Time comparison

Time taken to format a paper and Compliance with guidelines

Plagiarism Reports via Turnitin

SciSpace has partnered with Turnitin, the leading provider of Plagiarism Check software.

Using this service, researchers can compare submissions against more than 170 million scholarly articles, a database of 70+ billion current and archived web pages. How Turnitin Integration works?

Turnitin Stats
Publisher Logos

Freedom from formatting guidelines

One editor, 100K journal formats – world's largest collection of journal templates

With such a huge verified library, what you need is already there.

publisher-logos

Easy support from all your favorite tools

Diversity and Distributions format uses apa citation style.

Automatically format and order your citations and bibliography in a click.

SciSpace allows imports from all reference managers like Mendeley, Zotero, Endnote, Google Scholar etc.

Frequently asked questions

1. Can I write Diversity and Distributions in LaTeX?

Absolutely not! Our tool has been designed to help you focus on writing. You can write your entire paper as per the Diversity and Distributions guidelines and auto format it.

2. Do you follow the Diversity and Distributions guidelines?

Yes, the template is compliant with the Diversity and Distributions guidelines. Our experts at SciSpace ensure that. If there are any changes to the journal's guidelines, we'll change our algorithm accordingly.

3. Can I cite my article in multiple styles in Diversity and Distributions?

Of course! We support all the top citation styles, such as APA style, MLA style, Vancouver style, Harvard style, and Chicago style. For example, when you write your paper and hit autoformat, our system will automatically update your article as per the Diversity and Distributions citation style.

4. Can I use the Diversity and Distributions templates for free?

Sign up for our free trial, and you'll be able to use all our features for seven days. You'll see how helpful they are and how inexpensive they are compared to other options, Especially for Diversity and Distributions.

5. Can I use a manuscript in Diversity and Distributions that I have written in MS Word?

Yes. You can choose the right template, copy-paste the contents from the word document, and click on auto-format. Once you're done, you'll have a publish-ready paper Diversity and Distributions that you can download at the end.

6. How long does it usually take you to format my papers in Diversity and Distributions?

It only takes a matter of seconds to edit your manuscript. Besides that, our intuitive editor saves you from writing and formatting it in Diversity and Distributions.

7. Where can I find the template for the Diversity and Distributions?

It is possible to find the Word template for any journal on Google. However, why use a template when you can write your entire manuscript on SciSpace , auto format it as per Diversity and Distributions's guidelines and download the same in Word, PDF and LaTeX formats? Give us a try!.

8. Can I reformat my paper to fit the Diversity and Distributions's guidelines?

Of course! You can do this using our intuitive editor. It's very easy. If you need help, our support team is always ready to assist you.

9. Diversity and Distributions an online tool or is there a desktop version?

SciSpace's Diversity and Distributions is currently available as an online tool. We're developing a desktop version, too. You can request (or upvote) any features that you think would be helpful for you and other researchers in the "feature request" section of your account once you've signed up with us.

10. I cannot find my template in your gallery. Can you create it for me like Diversity and Distributions?

Sure. You can request any template and we'll have it setup within a few days. You can find the request box in Journal Gallery on the right side bar under the heading, "Couldn't find the format you were looking for like Diversity and Distributions?”

11. What is the output that I would get after using Diversity and Distributions?

After writing your paper autoformatting in Diversity and Distributions, you can download it in multiple formats, viz., PDF, Docx, and LaTeX.

12. Is Diversity and Distributions's impact factor high enough that I should try publishing my article there?

To be honest, the answer is no. The impact factor is one of the many elements that determine the quality of a journal. Few of these factors include review board, rejection rates, frequency of inclusion in indexes, and Eigenfactor. You need to assess all these factors before you make your final call.

13. What is Sherpa RoMEO Archiving Policy for Diversity and Distributions?

SHERPA/RoMEO Database

We extracted this data from Sherpa Romeo to help researchers understand the access level of this journal in accordance with the Sherpa Romeo Archiving Policy for Diversity and Distributions. The table below indicates the level of access a journal has as per Sherpa Romeo's archiving policy.

RoMEO Colour Archiving policy
Green Can archive pre-print and post-print or publisher's version/PDF
Blue Can archive post-print (ie final draft post-refereeing) or publisher's version/PDF
Yellow Can archive pre-print (ie pre-refereeing)
White Archiving not formally supported
FYI:
  1. Pre-prints as being the version of the paper before peer review and
  2. Post-prints as being the version of the paper after peer-review, with revisions having been made.

14. What are the most common citation types In Diversity and Distributions?

The 5 most common citation types in order of usage for Diversity and Distributions are:.

S. No. Citation Style Type
1. Author Year
2. Numbered
3. Numbered (Superscripted)
4. Author Year (Cited Pages)
5. Footnote

15. How do I submit my article to the Diversity and Distributions?

It is possible to find the Word template for any journal on Google. However, why use a template when you can write your entire manuscript on SciSpace , auto format it as per Diversity and Distributions's guidelines and download the same in Word, PDF and LaTeX formats? Give us a try!.

16. Can I download Diversity and Distributions in Endnote format?

Yes, SciSpace provides this functionality. After signing up, you would need to import your existing references from Word or Bib file to SciSpace. Then SciSpace would allow you to download your references in Diversity and Distributions Endnote style according to Elsevier guidelines.

Fast and reliable,
built for complaince.

Instant formatting to 100% publisher guidelines on - SciSpace.
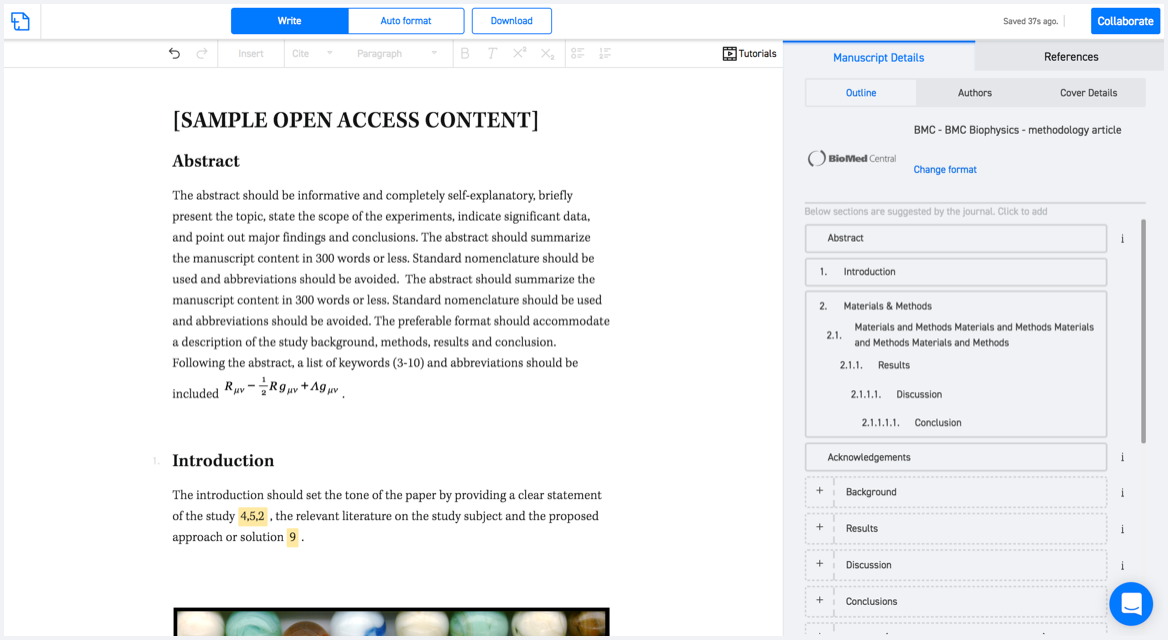
Available only on desktops 🖥

No word template required

Typset automatically formats your research paper to Diversity and Distributions formatting guidelines and citation style.
Verifed journal formats

One editor, 100K journal formats.
With the largest collection of verified journal formats, what you need is already there.

Trusted by academicians

I spent hours with MS word for reformatting. It was frustrating - plain and simple. With SciSpace, I can draft my manuscripts and once it is finished I can just submit. In case, I have to submit to another journal it is really just a button click instead of an afternoon of reformatting.

Andreas Frutiger
Researcher & Ex MS Word user
Use this template