Example of Journal of Applied Econometrics format
Recent searches

Example of Journal of Applied Econometrics format Example of Journal of Applied Econometrics format Example of Journal of Applied Econometrics format Example of Journal of Applied Econometrics format Example of Journal of Applied Econometrics format Example of Journal of Applied Econometrics format Example of Journal of Applied Econometrics format Example of Journal of Applied Econometrics format Example of Journal of Applied Econometrics format Example of Journal of Applied Econometrics format Example of Journal of Applied Econometrics format Example of Journal of Applied Econometrics format
Sample paper formatted on SciSpace - SciSpace
This content is only for preview purposes. The original open access content can be found here.
Look Inside
Example of Journal of Applied Econometrics format Example of Journal of Applied Econometrics format Example of Journal of Applied Econometrics format Example of Journal of Applied Econometrics format Example of Journal of Applied Econometrics format Example of Journal of Applied Econometrics format Example of Journal of Applied Econometrics format Example of Journal of Applied Econometrics format Example of Journal of Applied Econometrics format Example of Journal of Applied Econometrics format Example of Journal of Applied Econometrics format Example of Journal of Applied Econometrics format
Sample paper formatted on SciSpace - SciSpace
This content is only for preview purposes. The original open access content can be found here.
open access Open Access

Journal of Applied Econometrics — Template for authors

Publisher: Wiley
Categories Rank Trend in last 3 yrs
Social Sciences (miscellaneous) #35 of 334 down down by 19 ranks
Economics and Econometrics #119 of 661 down down by 53 ranks
journal-quality-icon Journal quality:
High
calendar-icon Last 4 years overview: 261 Published Papers | 1055 Citations
indexed-in-icon Indexed in: Scopus
last-updated-icon Last updated: 26/06/2020
Related journals
Insights
General info
Top papers
Popular templates
Get started guide
Why choose from SciSpace
FAQ

Related Journals

open access Open Access
recommended Recommended

Taylor and Francis

Quality:  
High
CiteRatio: 5.9
SJR: 5.062
SNIP: 4.015
open access Open Access

Cambridge University Press

Quality:  
High
CiteRatio: 2.5
SJR: 2.894
SNIP: 2.404
open access Open Access

Springer

Quality:  
High
CiteRatio: 2.7
SJR: 0.571
SNIP: 0.846
open access Open Access
recommended Recommended

Wiley

Quality:  
High
CiteRatio: 4.2
SJR: 1.98
SNIP: 2.249

Journal Performance & Insights

Impact Factor

CiteRatio

Determines the importance of a journal by taking a measure of frequency with which the average article in a journal has been cited in a particular year.

A measure of average citations received per peer-reviewed paper published in the journal.

1.901

7% from 2018

Impact factor for Journal of Applied Econometrics from 2016 - 2019
Year Value
2019 1.901
2018 2.053
2017 2.336
2016 2.117
graph view Graph view
table view Table view

4.0

3% from 2019

CiteRatio for Journal of Applied Econometrics from 2016 - 2020
Year Value
2020 4.0
2019 3.9
2018 4.2
2017 4.4
2016 4.5
graph view Graph view
table view Table view

insights Insights

  • Impact factor of this journal has decreased by 7% in last year.
  • This journal’s impact factor is in the top 10 percentile category.

insights Insights

  • CiteRatio of this journal has increased by 3% in last years.
  • This journal’s CiteRatio is in the top 10 percentile category.

SCImago Journal Rank (SJR)

Source Normalized Impact per Paper (SNIP)

Measures weighted citations received by the journal. Citation weighting depends on the categories and prestige of the citing journal.

Measures actual citations received relative to citations expected for the journal's category.

2.878

21% from 2019

SJR for Journal of Applied Econometrics from 2016 - 2020
Year Value
2020 2.878
2019 2.379
2018 2.817
2017 3.899
2016 2.654
graph view Graph view
table view Table view

2.295

2% from 2019

SNIP for Journal of Applied Econometrics from 2016 - 2020
Year Value
2020 2.295
2019 2.244
2018 2.105
2017 2.388
2016 2.402
graph view Graph view
table view Table view

insights Insights

  • SJR of this journal has increased by 21% in last years.
  • This journal’s SJR is in the top 10 percentile category.

insights Insights

  • SNIP of this journal has increased by 2% in last years.
  • This journal’s SNIP is in the top 10 percentile category.

Journal of Applied Econometrics

Guideline source: View

All company, product and service names used in this website are for identification purposes only. All product names, trademarks and registered trademarks are property of their respective owners.

Use of these names, trademarks and brands does not imply endorsement or affiliation. Disclaimer Notice

Wiley

Journal of Applied Econometrics

The Journal of Applied Econometrics is an international journal published bi-monthly, plus 1 additional issue (total 7 issues). It aims to publish articles of high quality dealing with the application of existing as well as new econometric techniques to a wide variety of probl...... Read More

Social Sciences

i
Last updated on
26 Jun 2020
i
ISSN
0883-7252
i
Impact Factor
High - 2.095
i
Open Access
Yes
i
Sherpa RoMEO Archiving Policy
Yellow faq
i
Plagiarism Check
Available via Turnitin
i
Endnote Style
Download Available
i
Bibliography Name
apa
i
Citation Type
Author Year
(Blonder et al., 1982)
i
Bibliography Example
Blonder, G. E., Tinkham, M., & Klapwijk, T. M. (1982). Transition from metallic to tunneling regimes in superconducting microconstrictions: Excess current, charge imbalance, and supercurrent conversion. Phys. Rev. B, 25(7), 4515–4532.

Top papers written in this journal

open accessOpen access Journal Article DOI: 10.1002/JAE.616
Bounds testing approaches to the analysis of level relationships
M. Hashem Pesaran1, Yongcheol Shin2, Richard Smith3

Abstract:

This paper develops a new approach to the problem of testing the existence of a level relationship between a dependent variable and a set of regressors, when it is not known with certainty whether the underlying regressors are trend- or first-difference stationary. The proposed tests are based on standard F- and t-statistics ... This paper develops a new approach to the problem of testing the existence of a level relationship between a dependent variable and a set of regressors, when it is not known with certainty whether the underlying regressors are trend- or first-difference stationary. The proposed tests are based on standard F- and t-statistics used to test the significance of the lagged levels of the variables in a univariate equilibrium correction mechanism. The asymptotic distributions of these statistics are non-standard under the null hypothesis that there exists no level relationship, irrespective of whether the regressors are I(0) or I(1). Two sets of asymptotic critical values are provided: one when all regressors are purely I(1) and the other if they are all purely I(0). These two sets of critical values provide a band covering all possible classifications of the regressors into purely I(0), purely I(1) or mutually cointegrated. Accordingly, various bounds testing procedures are proposed. It is shown that the proposed tests are consistent, and their asymptotic distribution under the null and suitably defined local alternatives are derived. The empirical relevance of the bounds procedures is demonstrated by a re-examination of the earnings equation included in the UK Treasury macroeconometric model. Copyright © 2001 John Wiley & Sons, Ltd. read more read less

Topics:

Asymptotic distribution (54%)54% related to the paper, Null hypothesis (51%)51% related to the paper, Variables (50%)50% related to the paper, Univariate (50%)50% related to the paper
View PDF
13,898 Citations
open accessOpen access Journal Article DOI: 10.1002/JAE.951
A simple panel unit root test in the presence of cross-section dependence
M. Hashem Pesaran1

Abstract:

A number of panel unit root tests that allow for cross section dependence have been proposed in the literature that use orthogonalization type procedures to asymptotically eliminate the cross dependence of the series before standard panel unit root tests are applied to the transformed series. In this paper we propose a simple... A number of panel unit root tests that allow for cross section dependence have been proposed in the literature that use orthogonalization type procedures to asymptotically eliminate the cross dependence of the series before standard panel unit root tests are applied to the transformed series. In this paper we propose a simple alternative where the standard ADF regressions are augmented with the cross section averages of lagged levels and first-differences of the individual series. New asymptotic results are obtained both for the individual CADF statistics, and their simple averages. It is shown that the individual CADF statistics are asymptotically similar and do not depend on the factor loadings. The limit distribution of the average CADF statistic is shown to exist and its critical values are tabulated. Small sample properties of the proposed test are investigated by Monte Carlo experiments. The proposed test is applied to a panel of 17 OECD real exchange rate series as well as to log real earnings of households in the PSID data. read more read less

Topics:

Unit root test (57%)57% related to the paper, Unit root (56%)56% related to the paper
View PDF
6,022 Citations
open accessOpen access Journal Article DOI: 10.1002/JAE.659
Computation and analysis of multiple structural change models
Jushan Bai1, Pierre Perron2

Abstract:

In a recent paper, Bai and Perron (1998) considered theoretical issues related to the limiting distribution of estimators and test statistics in the linear model with multiple structural changes. In this companion paper, we consider practical issues for the empirical applications of the procedures. We first address the proble... In a recent paper, Bai and Perron (1998) considered theoretical issues related to the limiting distribution of estimators and test statistics in the linear model with multiple structural changes. In this companion paper, we consider practical issues for the empirical applications of the procedures. We first address the problem of estimation of the break dates and present an efficient algorithm to obtain global minimizers of the sum of squared residuals. This algorithm is based on the principle of dynamic programming and requires at most least-squares operations of order O(T2) for any number of breaks. Our method can be applied to both pure and partial structural change models. Second, we consider the problem of forming confidence intervals for the break dates under various hypotheses about the structure of the data and the errors across segments. Third, we address the issue of testing for structural changes under very general conditions on the data and the errors. Fourth, we address the issue of estimating the number of breaks. Finally, a few empirical applications are presented to illustrate the usefulness of the procedures. All methods discussed are implemented in a GAUSS program. Copyright © 2002 John Wiley & Sons, Ltd. read more read less

Topics:

Structural break (54%)54% related to the paper, Residual sum of squares (53%)53% related to the paper, Model selection (52%)52% related to the paper, Linear model (51%)51% related to the paper, Asymptotic distribution (51%)51% related to the paper
View PDF
4,026 Citations
open accessOpen access Journal Article DOI: 10.1002/1099-1255(200009/10)15:5<447::AID-JAE570>3.0.CO;2-1
Mixed mnl models for discrete response
Daniel McFadden1, Kenneth Train1

Abstract:

SUMMARY Thispaperconsidersmixed,orrandomcoeAcients,multinomiallogit (MMNL)modelsfordiscreteresponse, andestablishesthefollowingresults.Undermildregularityconditions,anydiscretechoicemodelderivedfrom random utility maximization has choice probabilities that can be approximated as closely as one pleases by a MMNLmodel.Practical... SUMMARY Thispaperconsidersmixed,orrandomcoeAcients,multinomiallogit (MMNL)modelsfordiscreteresponse, andestablishesthefollowingresults.Undermildregularityconditions,anydiscretechoicemodelderivedfrom random utility maximization has choice probabilities that can be approximated as closely as one pleases by a MMNLmodel.PracticalestimationofaparametricmixingfamilycanbecarriedoutbyMaximumSimulated LikelihoodEstimationorMethodofSimulatedMoments,andeasilycomputedinstrumentsareprovidedthat make the latter procedure fairly eAcient. The adequacy of a mixing specification can be tested simply as an omittedvariabletestwithappropriatelydefinedartificialvariables.Anapplicationtoaproblemofdemandfor alternativevehiclesshowsthatMMNL provides aflexible and computationally practical approach todiscrete response analysis. Copyright # 2000 John Wiley & Sons, Ltd. read more read less

Topics:

Mixed logit (56%)56% related to the paper, Mixing (physics) (54%)54% related to the paper
View PDF
3,967 Citations
open accessOpen access Journal Article DOI: 10.1002/(SICI)1099-1255(199611)11:6<601::AID-JAE417>3.0.CO;2-T
Numerical distribution functions for unit root and cointegration tests
James G. MacKinnon1

Abstract:

SUMMARY This paper employs response surface regressions based on simulation experiments to calculate distribution functions for some well-known unit root and cointegration test statistics. The principal contributions of the paper are a set of data files that contain estimated response surface coefficients and a computer progr... SUMMARY This paper employs response surface regressions based on simulation experiments to calculate distribution functions for some well-known unit root and cointegration test statistics. The principal contributions of the paper are a set of data files that contain estimated response surface coefficients and a computer program for utilizing them. This program, which is freely available via the Internet, can easily be used to calculate both asymptotic and finite-sample critical values and P-values for any of the tests. Graphs of some of the tabulated distribution functions are provided. An empirical example deals with interest rates and inflation rates in Canada. Tests of the null hypothesis that a time-series process has a unit root have been widely used in recent years, as have tests of the null hypothesis that two or more integrated series are not cointegrated. The most commonly used unit root tests are based on the work of Dickey and Fuller (1979) and Said and Dickey (1984). These are known as Dickey-Fuller (DF) tests and Augmented Dickey-Fuller (ADF) tests, respectively. These tests have non-standard distributions, even asymptotically. The cointegration tests developed by Engle and Granger (1987) are closely related to DF and ADF tests, but they have different, non-standard distributions, which depend on the number of possibly cointegrated variables. Although the asymptotic theory of these unit root and cointegration tests is well developed, it is not at all easy for applied workers to calculate the marginal significance level, or P-value, associated with a given test statistic. Until a few years ago (MacKinnon, 1991), accurate critical values for cointegration tests were not available at all. In a recent paper (MacKinnon, 1994), I used simulation methods to estimate the asymptotic distributions of a large number of unit root and cointegration tests. I then obtained reasonably simple approximating equations that may be used to obtain approximate asymptotic P-values. In the present paper, I extend the results to allow for up to 12 variables, instead of six, and I correct two deficiencies of the earlier work. The first deficiency is that the approximating equations are considerably less accurate than the underlying estimated asymptotic distributions. The second deficiency is that, even though the simulation experiments provided information about the finite-sample distributions of the test statistics, the approximating equations were obtained only for the asymptotic case. The key to overcoming these two deficiencies is to use tables of response surface coefficients, from which estimated quantiles for any sample size may be calculated, instead of equations to read more read less

Topics:

Unit root (58%)58% related to the paper, Asymptotic theory (statistics) (58%)58% related to the paper, Test statistic (55%)55% related to the paper, Cointegration (55%)55% related to the paper, Statistical hypothesis testing (51%)51% related to the paper
View PDF
2,969 Citations
Author Pic

SciSpace is a very innovative solution to the formatting problem and existing providers, such as Mendeley or Word did not really evolve in recent years.

- Andreas Frutiger, Researcher, ETH Zurich, Institute for Biomedical Engineering

Get MS-Word and LaTeX output to any Journal within seconds
1
Choose a template
Select a template from a library of 40,000+ templates
2
Import a MS-Word file or start fresh
It takes only few seconds to import
3
View and edit your final output
SciSpace will automatically format your output to meet journal guidelines
4
Submit directly or Download
Submit to journal directly or Download in PDF, MS Word or LaTeX

(Before submission check for plagiarism via Turnitin)

clock Less than 3 minutes

What to expect from SciSpace?

Speed and accuracy over MS Word

''

With SciSpace, you do not need a word template for Journal of Applied Econometrics.

It automatically formats your research paper to Wiley formatting guidelines and citation style.

You can download a submission ready research paper in pdf, LaTeX and docx formats.

Time comparison

Time taken to format a paper and Compliance with guidelines

Plagiarism Reports via Turnitin

SciSpace has partnered with Turnitin, the leading provider of Plagiarism Check software.

Using this service, researchers can compare submissions against more than 170 million scholarly articles, a database of 70+ billion current and archived web pages. How Turnitin Integration works?

Turnitin Stats
Publisher Logos

Freedom from formatting guidelines

One editor, 100K journal formats – world's largest collection of journal templates

With such a huge verified library, what you need is already there.

publisher-logos

Easy support from all your favorite tools

Journal of Applied Econometrics format uses apa citation style.

Automatically format and order your citations and bibliography in a click.

SciSpace allows imports from all reference managers like Mendeley, Zotero, Endnote, Google Scholar etc.

Frequently asked questions

1. Can I write Journal of Applied Econometrics in LaTeX?

Absolutely not! Our tool has been designed to help you focus on writing. You can write your entire paper as per the Journal of Applied Econometrics guidelines and auto format it.

2. Do you follow the Journal of Applied Econometrics guidelines?

Yes, the template is compliant with the Journal of Applied Econometrics guidelines. Our experts at SciSpace ensure that. If there are any changes to the journal's guidelines, we'll change our algorithm accordingly.

3. Can I cite my article in multiple styles in Journal of Applied Econometrics?

Of course! We support all the top citation styles, such as APA style, MLA style, Vancouver style, Harvard style, and Chicago style. For example, when you write your paper and hit autoformat, our system will automatically update your article as per the Journal of Applied Econometrics citation style.

4. Can I use the Journal of Applied Econometrics templates for free?

Sign up for our free trial, and you'll be able to use all our features for seven days. You'll see how helpful they are and how inexpensive they are compared to other options, Especially for Journal of Applied Econometrics.

5. Can I use a manuscript in Journal of Applied Econometrics that I have written in MS Word?

Yes. You can choose the right template, copy-paste the contents from the word document, and click on auto-format. Once you're done, you'll have a publish-ready paper Journal of Applied Econometrics that you can download at the end.

6. How long does it usually take you to format my papers in Journal of Applied Econometrics?

It only takes a matter of seconds to edit your manuscript. Besides that, our intuitive editor saves you from writing and formatting it in Journal of Applied Econometrics.

7. Where can I find the template for the Journal of Applied Econometrics?

It is possible to find the Word template for any journal on Google. However, why use a template when you can write your entire manuscript on SciSpace , auto format it as per Journal of Applied Econometrics's guidelines and download the same in Word, PDF and LaTeX formats? Give us a try!.

8. Can I reformat my paper to fit the Journal of Applied Econometrics's guidelines?

Of course! You can do this using our intuitive editor. It's very easy. If you need help, our support team is always ready to assist you.

9. Journal of Applied Econometrics an online tool or is there a desktop version?

SciSpace's Journal of Applied Econometrics is currently available as an online tool. We're developing a desktop version, too. You can request (or upvote) any features that you think would be helpful for you and other researchers in the "feature request" section of your account once you've signed up with us.

10. I cannot find my template in your gallery. Can you create it for me like Journal of Applied Econometrics?

Sure. You can request any template and we'll have it setup within a few days. You can find the request box in Journal Gallery on the right side bar under the heading, "Couldn't find the format you were looking for like Journal of Applied Econometrics?”

11. What is the output that I would get after using Journal of Applied Econometrics?

After writing your paper autoformatting in Journal of Applied Econometrics, you can download it in multiple formats, viz., PDF, Docx, and LaTeX.

12. Is Journal of Applied Econometrics's impact factor high enough that I should try publishing my article there?

To be honest, the answer is no. The impact factor is one of the many elements that determine the quality of a journal. Few of these factors include review board, rejection rates, frequency of inclusion in indexes, and Eigenfactor. You need to assess all these factors before you make your final call.

13. What is Sherpa RoMEO Archiving Policy for Journal of Applied Econometrics?

SHERPA/RoMEO Database

We extracted this data from Sherpa Romeo to help researchers understand the access level of this journal in accordance with the Sherpa Romeo Archiving Policy for Journal of Applied Econometrics. The table below indicates the level of access a journal has as per Sherpa Romeo's archiving policy.

RoMEO Colour Archiving policy
Green Can archive pre-print and post-print or publisher's version/PDF
Blue Can archive post-print (ie final draft post-refereeing) or publisher's version/PDF
Yellow Can archive pre-print (ie pre-refereeing)
White Archiving not formally supported
FYI:
  1. Pre-prints as being the version of the paper before peer review and
  2. Post-prints as being the version of the paper after peer-review, with revisions having been made.

14. What are the most common citation types In Journal of Applied Econometrics?

The 5 most common citation types in order of usage for Journal of Applied Econometrics are:.

S. No. Citation Style Type
1. Author Year
2. Numbered
3. Numbered (Superscripted)
4. Author Year (Cited Pages)
5. Footnote

15. How do I submit my article to the Journal of Applied Econometrics?

It is possible to find the Word template for any journal on Google. However, why use a template when you can write your entire manuscript on SciSpace , auto format it as per Journal of Applied Econometrics's guidelines and download the same in Word, PDF and LaTeX formats? Give us a try!.

16. Can I download Journal of Applied Econometrics in Endnote format?

Yes, SciSpace provides this functionality. After signing up, you would need to import your existing references from Word or Bib file to SciSpace. Then SciSpace would allow you to download your references in Journal of Applied Econometrics Endnote style according to Elsevier guidelines.

Fast and reliable,
built for complaince.

Instant formatting to 100% publisher guidelines on - SciSpace.
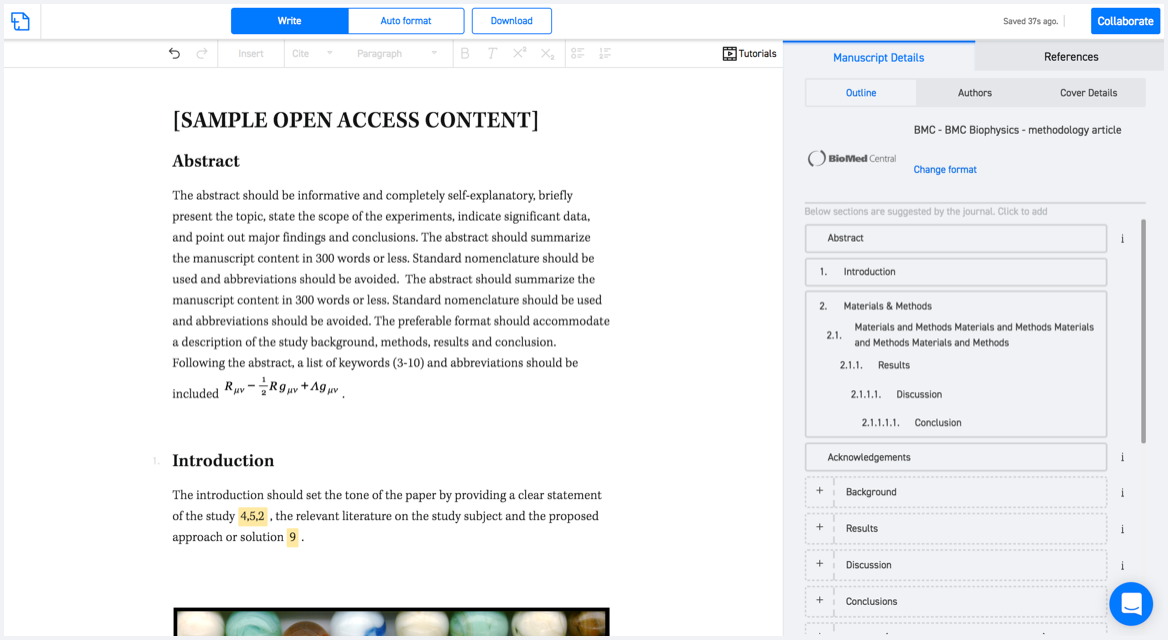
Available only on desktops 🖥

No word template required

Typset automatically formats your research paper to Journal of Applied Econometrics formatting guidelines and citation style.
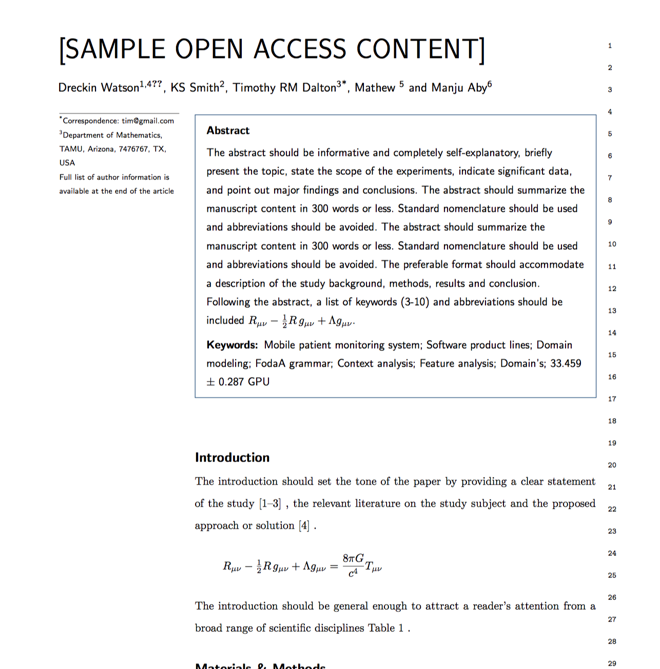
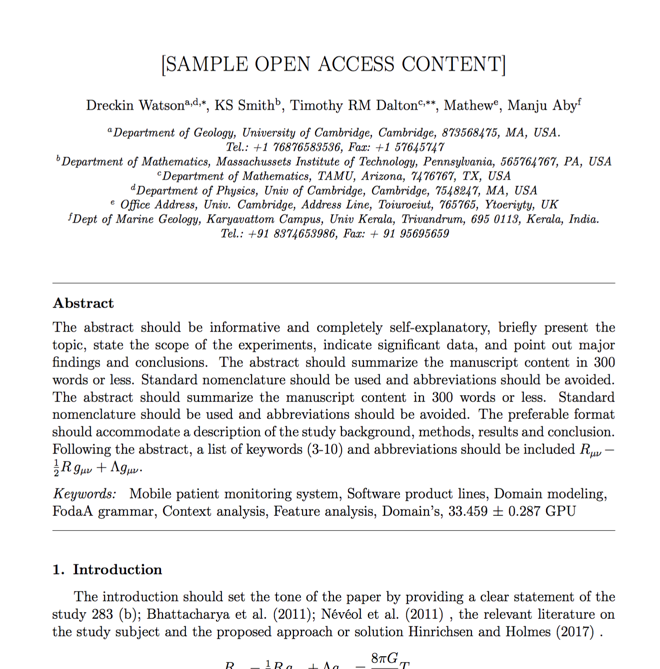
Verifed journal formats

One editor, 100K journal formats.
With the largest collection of verified journal formats, what you need is already there.

Trusted by academicians

I spent hours with MS word for reformatting. It was frustrating - plain and simple. With SciSpace, I can draft my manuscripts and once it is finished I can just submit. In case, I have to submit to another journal it is really just a button click instead of an afternoon of reformatting.

Andreas Frutiger
Researcher & Ex MS Word user
Use this template