
All figures (11)
 Figure 3. Scores plot of the first versus second component for partial least-squares discriminant analysis for (A) urine, (B) plasma-CPMG, and (C) 1-D-plasma for three different comparisons: (i) AP versus non-AP (diagnosis); (ii) etiology of AP patients, alcoholic versus cholelithiasis background; and (iii) severity of AP group based on Glasgow score, mild AP severity (Glasgow 1) versus moderate to severe AP (Glasgow 2−3). Key: *, value for the first component only, unit variance scaling; two principal components; R2 and Q2 values indicate variance explained and predictivity of the model respectively. (i) ●, AP samples (An = 13, B-Cn = 15); ■, non-AP samples (An = 18, B-Cn = 21). (ii) ●, Alcoholic AP samples (An = 8, B-Cn = 10); △, cholelithiasis AP samples (An = 5, B-Cn = 6). (iii) ●, Glasgow 1 group (An = 8, B-Cn = 9); △, Glasgow scores 2 and 3 group (An = 5, B-Cn = 7).
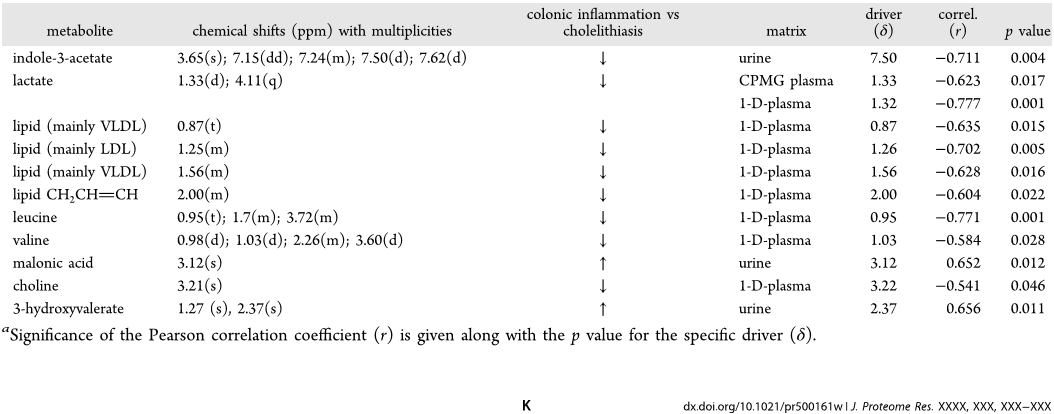 Table 5. Statistically Significant Metabolites and Their Corresponding Chemical Shifts in the Non-AP Patient Comparison: Cholelithiasis versus Colonic Inflammationa
 Figure 7. PLS-DA scores plot for (A) urine, (B) plasma-CPMG spin−echo, and (C) 1-D-plasma for patients comparing cholelithiasis versus colonic inflammation (including diverticulitis, appendicitis, Crohn’s disease, and ischemia) within the non-AP group (Table 1). (B) OPLS-DA loading plot for the discrimination between patients with cholelithiasis (upward facing signals) versus patients with colonic inflammation (downward). The model was built using unit variance scaling. R2 and Q2 values signify variance explained and predictivity of the model, respectively. △, cholelithiasis patients (A-B-Cn = 5); ●, patients with colonic inflammation (A-B-Cn = 9).
 Figure 4. OPLS-DA coefficient plots, peak signals related to the discrimination between (i) diagnostic classes: signals indicating higher concentration in AP group (upward) versus non-AP group (downward); (ii) comparison of the main causes of pancreatitis disease: cholelithiasis (signals oriented upward) versus alcohol consumption (downward); and (iii) severity of the disease based on Glasgow score: Glasgow score 1 (upward signals) versus Glasgow score 2 and 3 (downward). The color indicates the significance of the signal association with class: the hotter the color the higher the correlation with class. All comparisons for (A) urine, (B) plasma-CPMG, and (C) 1-D-plasma used one correlated component, 1 orthogonal component in matrix X, and 0 in class Y. Key: *, the value for the first component only, unit variance scaling; two principal components.
![Figure 6. ROC plot for (A) urinary data set (n = 31 [18non-AP/13AP]) and (B) plasma-CPMG spin−echo (n = 36 [21non-AP/15AP]). (C) Combination of 10 metabolites in total from urine (guanine at 7.67(s), hippurate at 7.54(t), 7.64(t), 7.84(d), creatine at 3.02(s) and unknown metabolites at 2.73(s), and 4.55(d), and CPMG plasma (valine at 1.04(d), alanine at 1.47 (d), and lipid compounds at 0.91(m), 1.25(m), and 1.97(m)); OPLS-DA was cross-validated from the previous ROC curve (R2 = 0.76, Q2 = 0.59, n = 29 [16non-AP/13AP]).](/figures/figure-6-roc-plot-for-a-urinary-data-set-n-31-18non-ap-13ap-2kmy07bm.png) Figure 6. ROC plot for (A) urinary data set (n = 31 [18non-AP/13AP]) and (B) plasma-CPMG spin−echo (n = 36 [21non-AP/15AP]). (C) Combination of 10 metabolites in total from urine (guanine at 7.67(s), hippurate at 7.54(t), 7.64(t), 7.84(d), creatine at 3.02(s) and unknown metabolites at 2.73(s), and 4.55(d), and CPMG plasma (valine at 1.04(d), alanine at 1.47 (d), and lipid compounds at 0.91(m), 1.25(m), and 1.97(m)); OPLS-DA was cross-validated from the previous ROC curve (R2 = 0.76, Q2 = 0.59, n = 29 [16non-AP/13AP]).
Figure 6. ROC plot for (A) urinary data set (n = 31 [18non-AP/13AP]) and (B) plasma-CPMG spin−echo (n = 36 [21non-AP/15AP]). (C) Combination of 10 metabolites in total from urine (guanine at 7.67(s), hippurate at 7.54(t), 7.64(t), 7.84(d), creatine at 3.02(s) and unknown metabolites at 2.73(s), and 4.55(d), and CPMG plasma (valine at 1.04(d), alanine at 1.47 (d), and lipid compounds at 0.91(m), 1.25(m), and 1.97(m)); OPLS-DA was cross-validated from the previous ROC curve (R2 = 0.76, Q2 = 0.59, n = 29 [16non-AP/13AP]). Table 2. Statistically Significant Metabolites and Their Corresponding Chemical Shifts for the Diagnosis of AP (AP group vs non-AP group)
 Table 3. Statistically Significant Metabolites and Their Corresponding Chemical Shifts for the Comparison of the AP Aetiology: Cholelithiasis vs Ethanola
 Figure 1. Typical 600 MHz 1H NMR spectra of urine obtained from a patient with acute pancreatitis and alcoholic background (A) and a non-AP patient with cholecystitis (B). Sections from the NMR spectra (raw data) show the metabolite differences describing the physical condition. Key: 1, hippurate; 2, acetaminophen sulfate (AS); 3, acetaminophen glucuronide (AG); 4, acetaminophen (A); 5, Nacetylcysteine conjugate of acetaminophen (NAC); 6, creatinine; 7, guanidinoacetate; 8, glycine; 9, trimethylamine-N-oxide (TMAO); 10, dimethylamine; 11, citrate; 12, D-3-hydroxybutyrate; 13, ethanol; 14, acetone; 15, alanine; 16, succinate; 17, 3-hydroxyisovalerate; 18, malonic acid; 19, creatine.
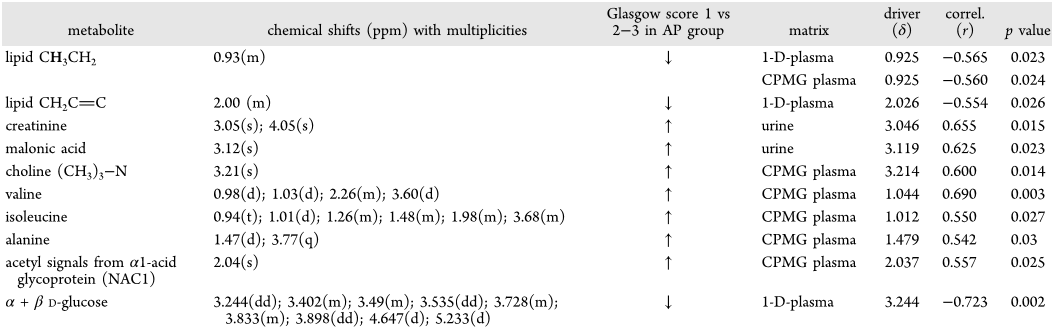 Table 4. Statistically Significant Metabolites and Their Corresponding Chemical Shifts for the Comparison of the Severity of the Pancreatitis between Mild AP (Glasgow 1) vs Moderate to Severe AP (Glasgow 2−3)
![Figure 5. OPLS-DA coefficients plot. Peak signals related to the discrimination between antibiotic consumers (top) group vs nonantibiotic takers (bottom). Models were created using unit variance scaling, R2 = 0.85 and Q2 = 0.47. ●, Antibiotic takers (n = 10 [5non-AP/5AP]); ■, nonantibiotic samples (n = 21 [12non-AP/9AP]).](/figures/figure-5-opls-da-coefficients-plot-peak-signals-related-to-2jqowngq.png) Figure 5. OPLS-DA coefficients plot. Peak signals related to the discrimination between antibiotic consumers (top) group vs nonantibiotic takers (bottom). Models were created using unit variance scaling, R2 = 0.85 and Q2 = 0.47. ●, Antibiotic takers (n = 10 [5non-AP/5AP]); ■, nonantibiotic samples (n = 21 [12non-AP/9AP]).
Figure 5. OPLS-DA coefficients plot. Peak signals related to the discrimination between antibiotic consumers (top) group vs nonantibiotic takers (bottom). Models were created using unit variance scaling, R2 = 0.85 and Q2 = 0.47. ●, Antibiotic takers (n = 10 [5non-AP/5AP]); ■, nonantibiotic samples (n = 21 [12non-AP/9AP]). Figure 2. 600 MHz 1H NMR spectra (δ −0.0 to 4.7) of plasma from (A) pancreatitis patient and (B) non-AP patient diagnosed with appendicitis. Abbreviations: LDL1 and VLDL1 refer to the terminal CH3 groups of fatty acids in low-density and very-low-density lipoproteins, respectively. HDL refers to the C18 signal from cholesterol in high-density lipoprotein. NAC1 and NAC2 refer to composite acetyl signals from α1-acid glycoprotein.


![Figure 6. ROC plot for (A) urinary data set (n = 31 [18non-AP/13AP]) and (B) plasma-CPMG spin−echo (n = 36 [21non-AP/15AP]). (C) Combination of 10 metabolites in total from urine (guanine at 7.67(s), hippurate at 7.54(t), 7.64(t), 7.84(d), creatine at 3.02(s) and unknown metabolites at 2.73(s), and 4.55(d), and CPMG plasma (valine at 1.04(d), alanine at 1.47 (d), and lipid compounds at 0.91(m), 1.25(m), and 1.97(m)); OPLS-DA was cross-validated from the previous ROC curve (R2 = 0.76, Q2 = 0.59, n = 29 [16non-AP/13AP]).](/figures/figure-6-roc-plot-for-a-urinary-data-set-n-31-18non-ap-13ap-2kmy07bm.webp)


![Figure 5. OPLS-DA coefficients plot. Peak signals related to the discrimination between antibiotic consumers (top) group vs nonantibiotic takers (bottom). Models were created using unit variance scaling, R2 = 0.85 and Q2 = 0.47. ●, Antibiotic takers (n = 10 [5non-AP/5AP]); ■, nonantibiotic samples (n = 21 [12non-AP/9AP]).](/figures/figure-5-opls-da-coefficients-plot-peak-signals-related-to-2jqowngq.webp)
