scispace - formally typeset
Search or ask a question
ReportDOI

2019 Cost of Wind Energy Review

About: The article was published on 2020-12-30 and is currently open access. It has received 70 citations till now. The article focuses on the topics: Wind power.

Summary (5 min read)

Introduction

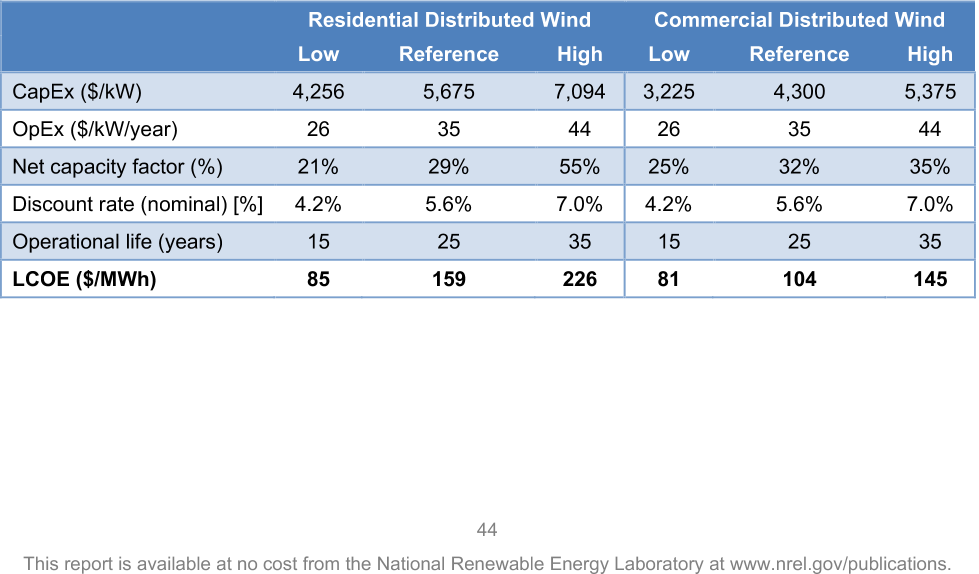
  • Table ES1, Table ES2, Table ES3, Table ES4, and Table ES5 summarize the basic LCOE inputs and outputs for the reference land-based, fixedbottom, and floating offshore wind and residential and commercial distributed wind projects.
  • 7 NREL’s 2015 Cost and Scaling Model is used as an internal reference and is not publicly available.

4.3.1 Turbine Parameters

  • For the purpose of this report, the turbine parameters are specific to the turbine and independent of the wind resource characteristics.
  • These parameters include not only turbine size (such as rated power, rotor diameter, and hub height), but also turbine operating characteristics (such as coefficient of power, maximum tip speed, maximum tip-speed ratio, and drivetrain design).
  • Because the three-stage planetary/helical gearbox with a high-speed asynchronous generatorstyle drivetrain topology dominates the U.S. market, the authors selected this type of drivetrain for the baseline wind turbines used in this analysis.
  • The power curve for the 2.6-MW land-based wind turbine is derived from NREL’s System Advisor Model.
  • For specific approaches regarding additional turbine parameters (e.g., power curves), see the “2010 Cost of Wind Energy Review” (Tegen et al. 2012).

4.3.2 Wind Resource

  • The average wind speed varies from project to project across the United States.
  • The annual average wind speed chosen for the reference project analysis, which is consistent with prior reports, is 7.25 meters per second (m/s) at 50 meters (m) above ground level (7.89 m/s at a hub height of 90.1 m).
  • The representative elevation defines the air density used for calculating the project AEP.
  • A summary of the wind resource assumptions for the 2019 representative site is included in Table 6.
  • 10 For comparison purposes, last year’s CapEx was inflated from 2018 USD to 2019 USD assuming a 1.8% cumulative rate of inflation from the Bureau of Labor and Statistics .

4.3.3 Losses and Availability

  • They are treated as independent of any other input in this simplified analysis.
  • Types of losses accounted for here include array wake losses, electric collection and transmission losses (from the substation to the point of interconnection), and blade soiling losses, totaling 15%.
  • A wind power plant availability of 98% is assumed, indicating the plant is ready to produce power 98% of the time that the wind speed falls within the operational range (i.e., between the wind turbine’s cut-in and cut-out wind speeds).
  • The net average AEP is then calculated by applying all losses and availability to the gross AEP.
  • Table 7 shows the estimated losses and availability for the land-based reference wind power plant.

4.3.4 Annual Energy Production

  • The AEP for this analysis was computed using the System Advisor Model.
  • The result of these calculations yields a net energy capture of 3,734 MWh/MW/year, which corresponds to a 42.6% net capacity factor assuming 8,760 hours in a year.
  • O&M market data are not widely available; therefore, the recent U.S. wind industry survey, “Assessing wind power operating costs in the United States: Results from a survey of wind industry experts” (Wiser et al. 2019) is used to inform the O&M cost estimates for the representative wind plant.
  • The average across respondents was ~$43/kW/yr and is assumed to be the all-in levelized OpEx for the representative project.
  • Financing assumptions, on the other hand, refer to the cost of interest and other carrying charges, corporate taxes, and depreciation (represented by the FCR in this report), applied to the total CapEx.

4.5.1 Discount Rate

  • Typically, various financial terms, such as the cost of debt or equity, are captured in the discount rate, which is in turn used to estimate the cost of energy.
  • For this analysis, the authors calculate the discount rate as the after-tax weighted-average cost of capital (WACC), and they presume that the reported yields for equity are after-tax yields and can be used directly in the WACC calculation.
  • The cost of capital data collected by Lawrence Berkeley National Laboratory (Wiser and Bolinger 2020) gives a basis for WACC assumptions for the representative wind project in 2019 and results in a nominal WACC of 6.32%.
  • Because state taxes are normally deductible expenses on federal tax returns, the blended rate is represented as 25.7%, as reported in NREL’s ATB.
  • 14 Research has shown that one likely outcome of the termination of the PTC is increased project leverage, which will reduce the higher-cost tax-equity portion of project finance.

4.5.2 Economic Evaluation Metrics

  • In the economic evaluation of wind energy investments there are two important metrics: the capital recovery factor (CRF) and FCR.
  • Table 10 presents the estimated WACC, CRF, and FCR in nominal and real terms using the after-tax WACC discount rate of 6.32% and 3.72%, respectively, a project design lifetime of 25 years, and a net present value depreciation factor of 84.6% (assuming a 5-year MACRS depreciation schedule).
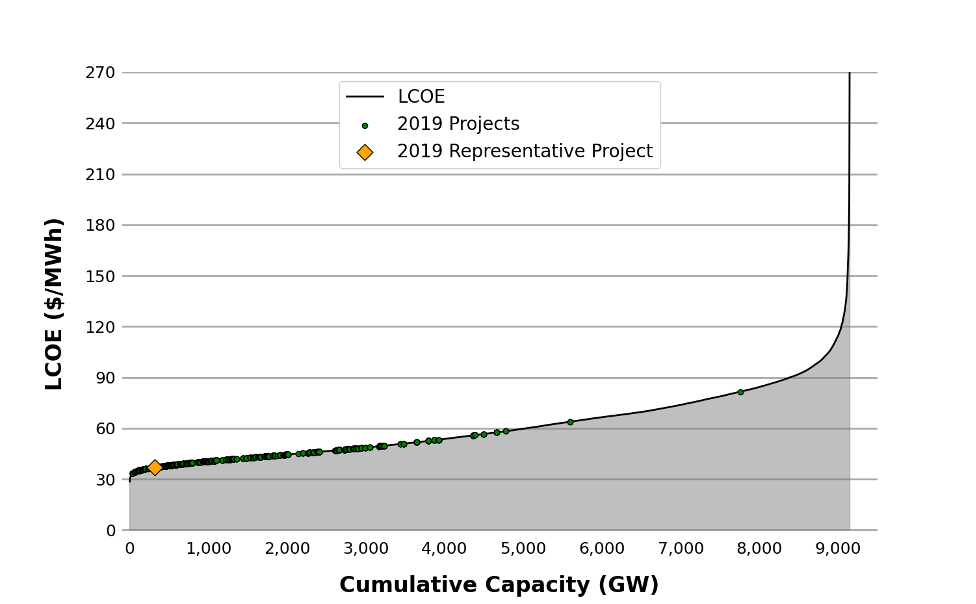
  • For illustrative purposes, the LCOE is calculated for the land-based wind projects installed in 2019 using the same site-specific methodology for 80 project locations, which are shown on the supply curve (marked by green circles).
  • The authors assessed a reference project at the fixed-bottom and floating sites, which each comprise 100 wind turbines rated at 6.1 MWsthe turbine capacity estimated from NREL’s global offshore wind project database for calendar year 2019.
  • 21 This report is available at no cost from the National Renewable Energy Laboratory at www.nrel.gov/publications.

5.3.1 Turbine Parameters

  • The offshore wind turbine technology characteristics for this analysis are calculated using a capacity-weighted average of the global offshore wind projects installed in 2018.
  • These values and additional assumptions for the offshore turbine characteristics are summarized in Table 15.

5.3.2 Wind Resource

  • The authors assessed the wind resource for the fixed-bottom and floating reference sites in the North Atlantic and Pacific Coast, respectively.
  • The wind resource parameters are summarized in Table 16.
  • 26 This report is available at no cost from the National Renewable Energy Laboratory at www.nrel.gov/publications.

5.3.3 Losses and Availability

  • The U.S. offshore reference project considers losses from wind power plant array wake impacts, inefficiencies in power collection and transmission, and losses from wind power plant availability.
  • These losses and availability estimates are determined using ORCA (Beiter et al. 2016), which performs calculations based on a specific wind power plant layout and site-specific meteorological ocean conditions.
  • The total system losses for the fixed-bottom technology in the North Atlantic are 16.0%, whereas the system losses for the floating offshore technology in the Pacific Coast region are 20.9%.
  • The primary differences in loss between these offshore technologies are the additional electrical cable losses for floating wind in deeper waters (i.e., 34 m versus 739 m), and wake losses from the different reference sites.
  • Table 17 summarizes the losses and availability estimates for the fixed-bottom and floating offshore wind technologies.

5.3.4 Annual Energy Production

  • The net AEP is calculated using the wind turbine technology parameters and wind resource inputs, and by applying the appropriate losses and availability estimates.
  • The net AEP is calculated for the offshore reference project for both fixed-bottom and floating offshore applications using ORCA.
  • 27 This report is available at no cost from the National Renewable Energy Laboratory at www.nrel.gov/publications.
  • More information on the global trends for offshore wind power plant performance can be found in Musial et al. (2017).
  • Vessels, equipment, scheduled maintenance, unscheduled maintenance, land-based support, and administration.

5.5.1 Discount Rate

  • An individual project’s financing terms reflect its specific risk profile, assumptions, and ranges of nominal discount rates for offshore wind.
  • The generic assumptions used for this report are consistent with NREL’s 2019 ATB (Feldman et al. 2020), which were derived from industry interviews and a literature review.
  • For this analysis, the authors assumed the discount rate and other economic evaluation metrics to be similar for the North Atlantic and Pacific Coast representative projects.
  • 20 Underlying assumptions for marginal tax rate and inflation are consistent with those presented in Section 4.5.1.

5.5.2 Economic Evaluation Metrics

  • To determine the LCOE for the 2019 representative offshore wind projects, a similar FCR methodology that was used for the land-based representative wind project is applied (see Section 4.5) and informed by the 2020 ATB.
  • For the offshore wind supply curve, the LCOE for each of the potential wind power plant locations is computed using a site-specific CapEx, OpEx, and net AEP.
  • 37 This report is available at no cost from the National Renewable Energy Laboratory at www.nrel.gov/publications.
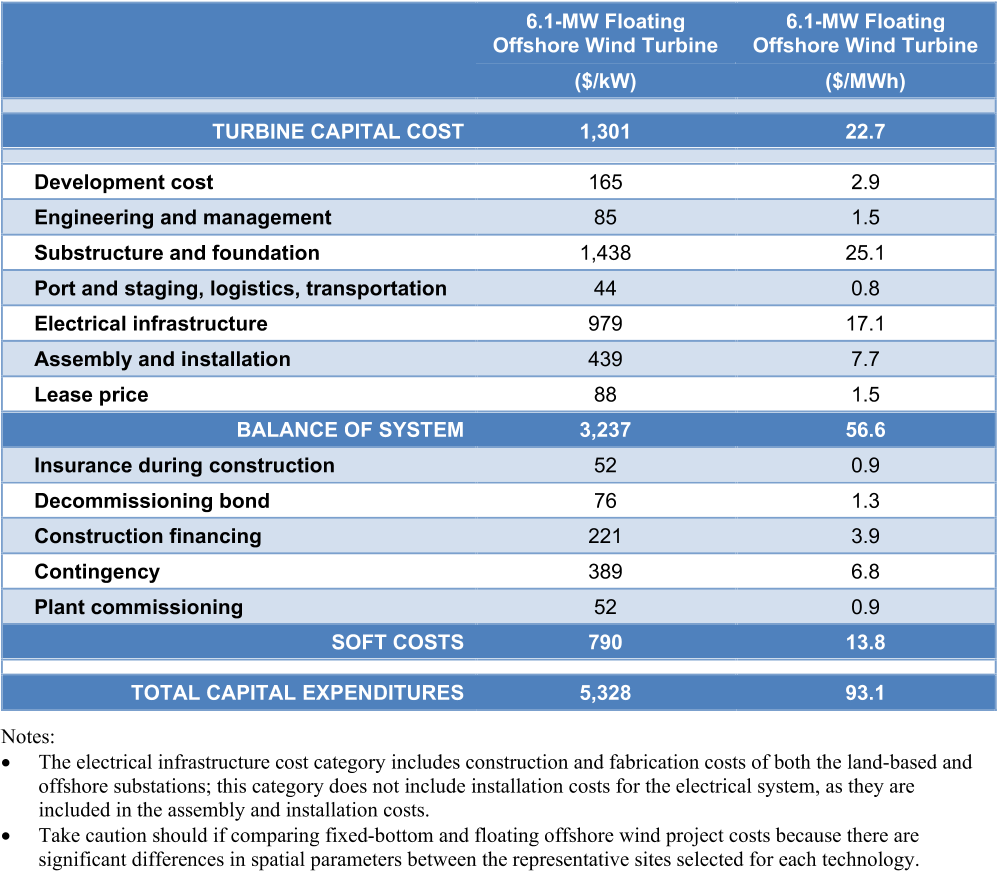
  • Table 24 summarizes the costs for the reference projects wind turbine and BOS CapEx components (including their contribution to LCOE).

6.3.1 Turbine Parameters

  • For the purpose of this report, the turbine parameters are specific to the turbine and independent of the wind resource characteristics.
  • The authors developed the power curve for the 20-kW residential system and the 100-kW commercial system assuming stall-regulated turbines with standard air density.
  • The authors used a standard air density of 1.225 kg/m3 for power curve development.
  • 38 This report is available at no cost from the National Renewable Energy Laboratory at www.nrel.gov/publications.

6.3.2 Wind Resource

  • The average wind speed can vary from project to project across the United States.
  • This wind speed is intended to be generally indicative of the wind regime for distributed wind projects installed in moderate-quality sites.
  • A summary of the wind resource assumptions for the 2019 representative site is included in Table 26.

6.3.3 Losses and Availability

  • They are treated as independent of any other input in this simplified analysis.
  • Types of losses accounted for here include blade soiling, turbine controls, and grid availability, totaling 11.5%.
  • The wind turbine availability is assumed to be 95%, indicating that the wind project is ready to produce power between wind turbine cut-in and cut-out wind speeds 95% of the time.
  • Net average AEP is calculated by applying all losses and availability to the gross AEP.
  • This report is available at no cost from the National Renewable Energy Laboratory at www.nrel.gov/publications.

6.3.4 Annual Energy Production

  • The authors estimated the gross AEP for this analysis using generic power curves for the 20- and 100-kW turbines developed by NREL and computed in Openwind (UL undated).
  • The losses and availability are then applied to calculate the net AEP.
  • Reference Residential and Commercial Distributed Wind Projects AEP and Capacity Factor Summary AEP and Capacity Factors (6-m/s wind speed at 50 m) Residential (20 kW) Commercial (100 kW) Net energy capture (kWh/kW/yr) 2,580 2,846 Net capacity factor (%) 29.5% 32.5% 6.4 Distributed Wind Operation and Maintenance Expenditures Additional details describing FCR are presented in Section 4.5.
  • Financing assumes debt for approximately 60% of the 23 Given the scarcity and varying quality of the data, OpEx may vary substantially among projects, and the data included here may not fully represent the challenges that OpEx present to the distributed wind industry.

6.5.1 Discount Rate

  • Typically, various financial terms, such as the cost of debt or equity, are captured in the discount rate, which is in turn used to estimate the cost of energy.
  • For this analysis, the discount rate is calculated as the after-tax WACC and it is presumed that the reported yields for equity are aftertax yields and can be used directly in the WACC calculation.
  • Each actual project, however, has a unique risk profile, financing terms, and ownership structure.
  • For this reason, a single WACC representing the distributed wind installations should be viewed cautiously and used to illustrate general market trends and conditions only.
  • This rate aligns with the inflation rate provided in NREL’s ATB.

6.5.2 Economic Evaluation Metrics

  • In the economic evaluation of wind energy investments there are two important metrics: the CRF and FCR, with details provided in Section 4.5.2.
  • National Renewable Energy Laboratory (NREL), Golden, CO (US).
  • A summary of the sensitivity parameters (i.e., capital recovery factor, fixed charge rate, and levelized cost of energy [LCOE]) are shown in Table B2.
  • The National Renewable Energy Laboratory’s Offshore Wind Cost Model, also referred to as the Offshore Regional Cost Analyzer, is subject to continuous data updates and validation, which help ensure that the model reflects the latest industry and market developments.

Did you find this useful? Give us your feedback

Figures (47)

Content maybe subject to copyright    Report

NREL is a national laboratory of the U.S. Department of Energy
Office of Energy Efficiency & Renewable Energy
Operated by the Alliance for Sustainable Energy, LLC
This report is available at no cost from the National Renewable Energy
Laboratory (NREL) at www.nrel.gov/publications.
Contract No. DE-AC36-08GO28308
Technical Report
NREL/TP-5000-78471
December 2020
2019 Cost of Wind Energy Review
Tyler Stehly,
Philipp Beiter, and Patrick Duffy
National Renewable Energy Laboratory

NREL is a national laboratory of the U.S. Department of Energy
Office of Energy Efficiency & Renewable Energy
Operated by the Alliance for Sustainable Energy, LLC
This report is available at no cost from the National Renewable Energy
Laboratory (NREL) at www.nrel.gov/publications.
Contract No. DE-AC36-08GO28308
National Renewable Energy Laboratory
15013 Denver West Parkway
Golden, CO 80401
303-275-3000 • www.nrel.gov
Technical Report
NREL/TP-5000-78471
December 2020
Philipp Beiter, and Patrick Duffy
2019 Cost of Wind Energy Review.
Renewable Energy Laboratory. NREL/TP-5000-78471.
.

NOTICE
This work was authored by the National Renewable Energy Laboratory, operated by Alliance for Sustainable
Energy, LLC, for the U.S. Department of Energy (DOE) under Contract No. DE-AC36-08GO28308. Funding
provided by the U.S. Department of Energy Office of Energy Efficiency and Renewable Energy Wind Energy
Technologies Office. The views expressed herein do not necessarily represent the views of the DOE or the U.S.
Government.
This report is available at no cost from the National Renewable
Energy Laboratory (NREL) at www.nrel.gov/publications
.
U.S. Department of Energy (DOE) reports produced after 1991
and a growing number of pre-1991 documents are available
free via www.OSTI.gov
.
Cover Photos by Dennis Schroeder: (clockwise, left to right) NREL 51934, NREL 45897, NREL 42160, NREL 45891, NREL 48097,
NREL 46526.
NREL prints on paper that contains recycled content.

iii
This report is available at no cost from the National Renewable Energy Laboratory at www.nrel.gov/publications.
Acknowledgments
The authors would like to thank Patrick Gilman (U.S. Department of Energy Office of Energy
Efficiency and Renewable Energy Wind Energy Technologies Office [WETO]) for supporting
this research. Thanks also to Daniel Beals of Allegheny Science and Technology (contractor to
WETO), Gage Reber (WETO fellow), Alice Orrell (Pacific Northwest National Laboratory), and
Bret Barker (contractor to WETO) for reviewing prior versions of this manuscript. Thank you to
Ryan Wiser and Mark Bolinger (Lawrence Berkeley National Laboratory) and Alice Orrell
(Pacific Northwest National Laboratory) for their analysis of wind project market data that
informed this analysis and also to Travis Williams, Nick Grue, and Anthony Lopez (National
Renewable Energy Laboratory) for their work in developing the national wind supply curves.
Thanks also to Eric Lantz (National Renewable Energy Laboratory) for his technical guidance,
contributions, and review of prior versions of this manuscript. Any remaining errors or omissions
are the sole responsibility of the authors.

iv
This report is available at no cost from the National Renewable Energy Laboratory at www.nrel.gov/publications.
List of Acronyms
AEP annual energy production
ATB Annual Technology Baseline
BOS balance of system
CapEx capital expenditures
CRF capital recovery factor
CSM Cost and Scaling Model
DOE U.S. Department of Energy
FCR fixed charge rate
GPRA Government Performance and Results Act
GW gigawatt
kW kilowatt
LandBOSSE Land-based Balance of System Systems
Engineering
LCOE levelized cost of energy
m meter
m/s meters per second
MACRS Modified Accelerated Cost Recovery System
MW megawatt
MWh megawatt-hour
NREL National Renewable Energy Laboratory
O&M operation and maintenance
OpEx operational expenditures
ORCA Offshore Wind Regional Cost Analyzer
PTC production tax credit
USD U.S. dollars
WACC weighted-average cost of capital
WETO Wind Energy Technologies Office
yr year

Citations
More filters
Journal ArticleDOI
TL;DR: In this paper , a grid-connected power-to-methanol system is introduced, modeled, simulated and optimized for its daily operation by considering its participation in day-ahead electricity markets.

10 citations

Journal ArticleDOI
TL;DR: In this article , the benefits and limitations of integrating offshore renewable energy systems with aquaculture, shipping and port, and oil and gas industries are analyzed, and the authors suggest that green hydrogen synergy can facilitate the offshore and coastal industries clean and sustainable growth by furnishing proliferation opportunities for clean energy.

9 citations

Journal ArticleDOI
TL;DR: In this article , a review of the whole life cycle composition, economic analysis method and cost modelling process of wind power from a macro perspective, and summarizes the differences in cost composition and modelling among different types of wind farms and the applicability of different economic analysis methods and evaluation indicators.

9 citations

References
More filters
ReportDOI
01 Mar 1995
TL;DR: In this article, the authors present a guide for analyzing the economics of energy efficiency and renewable energy (EE) technologies and projects, which is intended to help analysts determine the appropriate approach or type of analysis and the appropriate level of detail.
Abstract: This manual is a guide for analyzing the economics of energy efficiency and renewable energy (EE) technologies and projects. It is intended (1) to help analysts determine the appropriate approach or type of analysis and the appropriate level of detail and (2) to assist EE analysts in completing consistent analyses using standard assumptions and bases, when appropriate. Included are analytical techniques that are commonly required for the economic analysis of EE technologies and projects. The manual consists of six sections: Introduction, Fundamentals, Selection Criteria Guide, Economic Measures, Special Considerations for Conservation and Renewable Energy Systems, and References. A glossary and eight appendices are also included. Each section has a brief introductory statement, a presentation of necessary formulae, a discussion, and when appropriate, examples and descriptions of data and data availability. The objective of an economic analysis is to provide the information needed to make a judgment or a decision. The most complete analysis of an investment in a technology or a project requires the analysis of each year of the life of the investment, taking into account relevant direct costs, indirect and overhead costs, taxes, and returns on investment, plus any externalities, such as environmental impacts, that are relevant to the decision to be made. However, it is important to consider the purpose and scope of a particular analysis at the outset because this will prescribe the course to follow. The perspective of the analysis is important, often dictating the approach to be used. Also, the ultimate use of the results of an analysis will influence the level of detail undertaken. The decision-making criteria of the potential investor must also be considered.

835 citations

Journal ArticleDOI
TL;DR: Despite near-to medium-term cost barriers, a future U.S. electricity system in which wind plays a major role is technically feasible and could result in enduring benefits globally, nationally, and locally as discussed by the authors.

250 citations

Journal ArticleDOI
TL;DR: The meeting of the Advisory Technical Committees of the International Electrotechnical Commission (ITC) was held in Brussels from March 27th to April 1st, 1989 as mentioned in this paper.
Abstract: Meetings of the Advisory Technical Committees of the International Electrotechnical Commission were held in Brussels March 27th to April 1st. The meetings were attended by delegates from eight national committees — Belgium, France, Great Britain, Holland, Italy, Spain, Switzerland, and the United States. There were about 40 delegates in all.

177 citations

ReportDOI
01 Sep 2016

115 citations


"2019 Cost of Wind Energy Review" refers background in this paper

  • ...…closest to shore (measured by direct distance) was identified, while: o Only considering lease area(s) if at least one is available within an offshore wind region o Consider Call Area(s) if there is no designated lease area o Assuming a turbine spacing of 3 MW/square kilometer (Musial et al. 2016)....

    [...]

  • ...21 This gross resource potential compares to nearly 2,060 GW of “technical resource capacity” when considering various competing use and exclusion areas (Musial et al. 2016)....

    [...]

ReportDOI
01 Mar 2013
TL;DR: In this article, the levelized cost of energy (LCOE) for a typical land-based wind turbine installed in the United States in 2011, as well as the modeled LCOE for a fixed-bottom offshore wind turbine, were presented.
Abstract: This report describes the levelized cost of energy (LCOE) for a typical land-based wind turbine installed in the United States in 2011, as well as the modeled LCOE for a fixed-bottom offshore wind turbine installed in the United States in 2011. Each of the four major components of the LCOE equation are explained in detail, such as installed capital cost, annual energy production, annual operating expenses, and financing, and including sensitivity ranges that show how each component can affect LCOE. These LCOE calculations are used for planning and other purposes by the U.S. Department of Energy's Wind Program.

110 citations


"2019 Cost of Wind Energy Review" refers methods in this paper

  • ...3 Approach This “2019 Cost of Wind Energy Review” applies a similar approach as the past cost of wind energy review reports (Tegen et al. 2012, 2013; Moné et al. 2015a, 2015b, 2017; Stehly et al. 2017, 2018, 2019)....

    [...]