scispace - formally typeset
Search or ask a question
ReportDOI

2019 Cost of Wind Energy Review

About: The article was published on 2020-12-30 and is currently open access. It has received 70 citations till now. The article focuses on the topics: Wind power.

Summary (5 min read)

Introduction

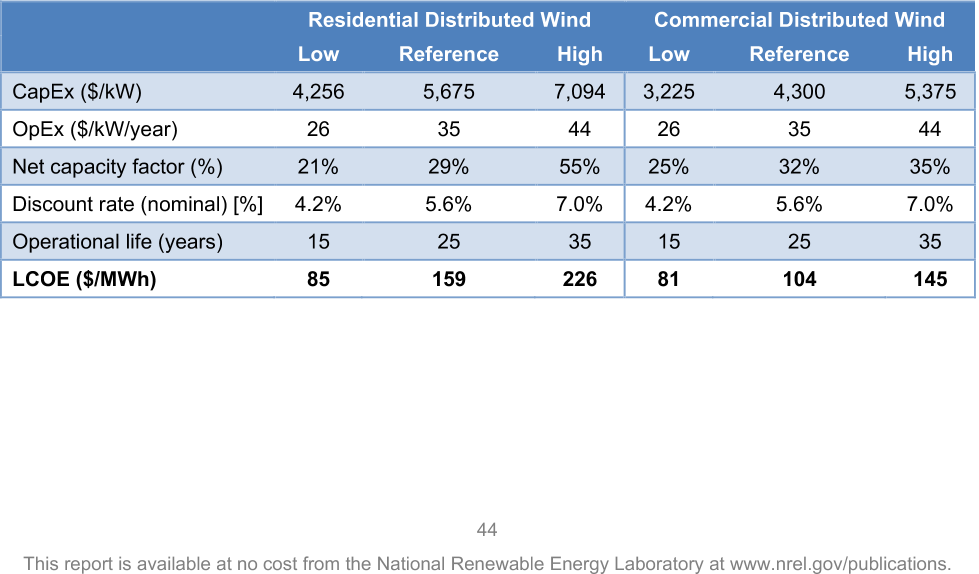
  • Table ES1, Table ES2, Table ES3, Table ES4, and Table ES5 summarize the basic LCOE inputs and outputs for the reference land-based, fixedbottom, and floating offshore wind and residential and commercial distributed wind projects.
  • 7 NREL’s 2015 Cost and Scaling Model is used as an internal reference and is not publicly available.

4.3.1 Turbine Parameters

  • For the purpose of this report, the turbine parameters are specific to the turbine and independent of the wind resource characteristics.
  • These parameters include not only turbine size (such as rated power, rotor diameter, and hub height), but also turbine operating characteristics (such as coefficient of power, maximum tip speed, maximum tip-speed ratio, and drivetrain design).
  • Because the three-stage planetary/helical gearbox with a high-speed asynchronous generatorstyle drivetrain topology dominates the U.S. market, the authors selected this type of drivetrain for the baseline wind turbines used in this analysis.
  • The power curve for the 2.6-MW land-based wind turbine is derived from NREL’s System Advisor Model.
  • For specific approaches regarding additional turbine parameters (e.g., power curves), see the “2010 Cost of Wind Energy Review” (Tegen et al. 2012).

4.3.2 Wind Resource

  • The average wind speed varies from project to project across the United States.
  • The annual average wind speed chosen for the reference project analysis, which is consistent with prior reports, is 7.25 meters per second (m/s) at 50 meters (m) above ground level (7.89 m/s at a hub height of 90.1 m).
  • The representative elevation defines the air density used for calculating the project AEP.
  • A summary of the wind resource assumptions for the 2019 representative site is included in Table 6.
  • 10 For comparison purposes, last year’s CapEx was inflated from 2018 USD to 2019 USD assuming a 1.8% cumulative rate of inflation from the Bureau of Labor and Statistics .

4.3.3 Losses and Availability

  • They are treated as independent of any other input in this simplified analysis.
  • Types of losses accounted for here include array wake losses, electric collection and transmission losses (from the substation to the point of interconnection), and blade soiling losses, totaling 15%.
  • A wind power plant availability of 98% is assumed, indicating the plant is ready to produce power 98% of the time that the wind speed falls within the operational range (i.e., between the wind turbine’s cut-in and cut-out wind speeds).
  • The net average AEP is then calculated by applying all losses and availability to the gross AEP.
  • Table 7 shows the estimated losses and availability for the land-based reference wind power plant.

4.3.4 Annual Energy Production

  • The AEP for this analysis was computed using the System Advisor Model.
  • The result of these calculations yields a net energy capture of 3,734 MWh/MW/year, which corresponds to a 42.6% net capacity factor assuming 8,760 hours in a year.
  • O&M market data are not widely available; therefore, the recent U.S. wind industry survey, “Assessing wind power operating costs in the United States: Results from a survey of wind industry experts” (Wiser et al. 2019) is used to inform the O&M cost estimates for the representative wind plant.
  • The average across respondents was ~$43/kW/yr and is assumed to be the all-in levelized OpEx for the representative project.
  • Financing assumptions, on the other hand, refer to the cost of interest and other carrying charges, corporate taxes, and depreciation (represented by the FCR in this report), applied to the total CapEx.

4.5.1 Discount Rate

  • Typically, various financial terms, such as the cost of debt or equity, are captured in the discount rate, which is in turn used to estimate the cost of energy.
  • For this analysis, the authors calculate the discount rate as the after-tax weighted-average cost of capital (WACC), and they presume that the reported yields for equity are after-tax yields and can be used directly in the WACC calculation.
  • The cost of capital data collected by Lawrence Berkeley National Laboratory (Wiser and Bolinger 2020) gives a basis for WACC assumptions for the representative wind project in 2019 and results in a nominal WACC of 6.32%.
  • Because state taxes are normally deductible expenses on federal tax returns, the blended rate is represented as 25.7%, as reported in NREL’s ATB.
  • 14 Research has shown that one likely outcome of the termination of the PTC is increased project leverage, which will reduce the higher-cost tax-equity portion of project finance.

4.5.2 Economic Evaluation Metrics

  • In the economic evaluation of wind energy investments there are two important metrics: the capital recovery factor (CRF) and FCR.
  • Table 10 presents the estimated WACC, CRF, and FCR in nominal and real terms using the after-tax WACC discount rate of 6.32% and 3.72%, respectively, a project design lifetime of 25 years, and a net present value depreciation factor of 84.6% (assuming a 5-year MACRS depreciation schedule).
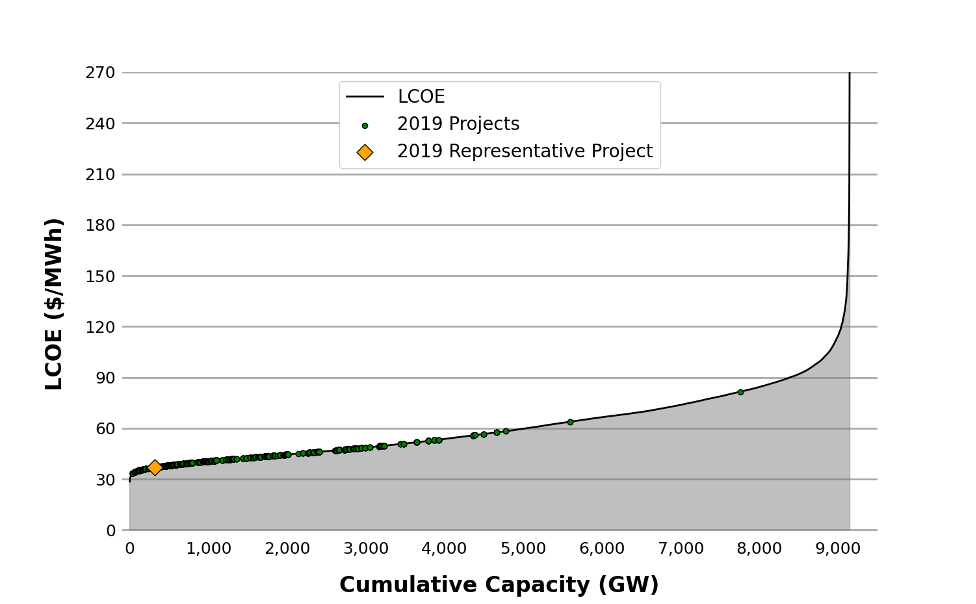
  • For illustrative purposes, the LCOE is calculated for the land-based wind projects installed in 2019 using the same site-specific methodology for 80 project locations, which are shown on the supply curve (marked by green circles).
  • The authors assessed a reference project at the fixed-bottom and floating sites, which each comprise 100 wind turbines rated at 6.1 MWsthe turbine capacity estimated from NREL’s global offshore wind project database for calendar year 2019.
  • 21 This report is available at no cost from the National Renewable Energy Laboratory at www.nrel.gov/publications.

5.3.1 Turbine Parameters

  • The offshore wind turbine technology characteristics for this analysis are calculated using a capacity-weighted average of the global offshore wind projects installed in 2018.
  • These values and additional assumptions for the offshore turbine characteristics are summarized in Table 15.

5.3.2 Wind Resource

  • The authors assessed the wind resource for the fixed-bottom and floating reference sites in the North Atlantic and Pacific Coast, respectively.
  • The wind resource parameters are summarized in Table 16.
  • 26 This report is available at no cost from the National Renewable Energy Laboratory at www.nrel.gov/publications.

5.3.3 Losses and Availability

  • The U.S. offshore reference project considers losses from wind power plant array wake impacts, inefficiencies in power collection and transmission, and losses from wind power plant availability.
  • These losses and availability estimates are determined using ORCA (Beiter et al. 2016), which performs calculations based on a specific wind power plant layout and site-specific meteorological ocean conditions.
  • The total system losses for the fixed-bottom technology in the North Atlantic are 16.0%, whereas the system losses for the floating offshore technology in the Pacific Coast region are 20.9%.
  • The primary differences in loss between these offshore technologies are the additional electrical cable losses for floating wind in deeper waters (i.e., 34 m versus 739 m), and wake losses from the different reference sites.
  • Table 17 summarizes the losses and availability estimates for the fixed-bottom and floating offshore wind technologies.

5.3.4 Annual Energy Production

  • The net AEP is calculated using the wind turbine technology parameters and wind resource inputs, and by applying the appropriate losses and availability estimates.
  • The net AEP is calculated for the offshore reference project for both fixed-bottom and floating offshore applications using ORCA.
  • 27 This report is available at no cost from the National Renewable Energy Laboratory at www.nrel.gov/publications.
  • More information on the global trends for offshore wind power plant performance can be found in Musial et al. (2017).
  • Vessels, equipment, scheduled maintenance, unscheduled maintenance, land-based support, and administration.

5.5.1 Discount Rate

  • An individual project’s financing terms reflect its specific risk profile, assumptions, and ranges of nominal discount rates for offshore wind.
  • The generic assumptions used for this report are consistent with NREL’s 2019 ATB (Feldman et al. 2020), which were derived from industry interviews and a literature review.
  • For this analysis, the authors assumed the discount rate and other economic evaluation metrics to be similar for the North Atlantic and Pacific Coast representative projects.
  • 20 Underlying assumptions for marginal tax rate and inflation are consistent with those presented in Section 4.5.1.

5.5.2 Economic Evaluation Metrics

  • To determine the LCOE for the 2019 representative offshore wind projects, a similar FCR methodology that was used for the land-based representative wind project is applied (see Section 4.5) and informed by the 2020 ATB.
  • For the offshore wind supply curve, the LCOE for each of the potential wind power plant locations is computed using a site-specific CapEx, OpEx, and net AEP.
  • 37 This report is available at no cost from the National Renewable Energy Laboratory at www.nrel.gov/publications.
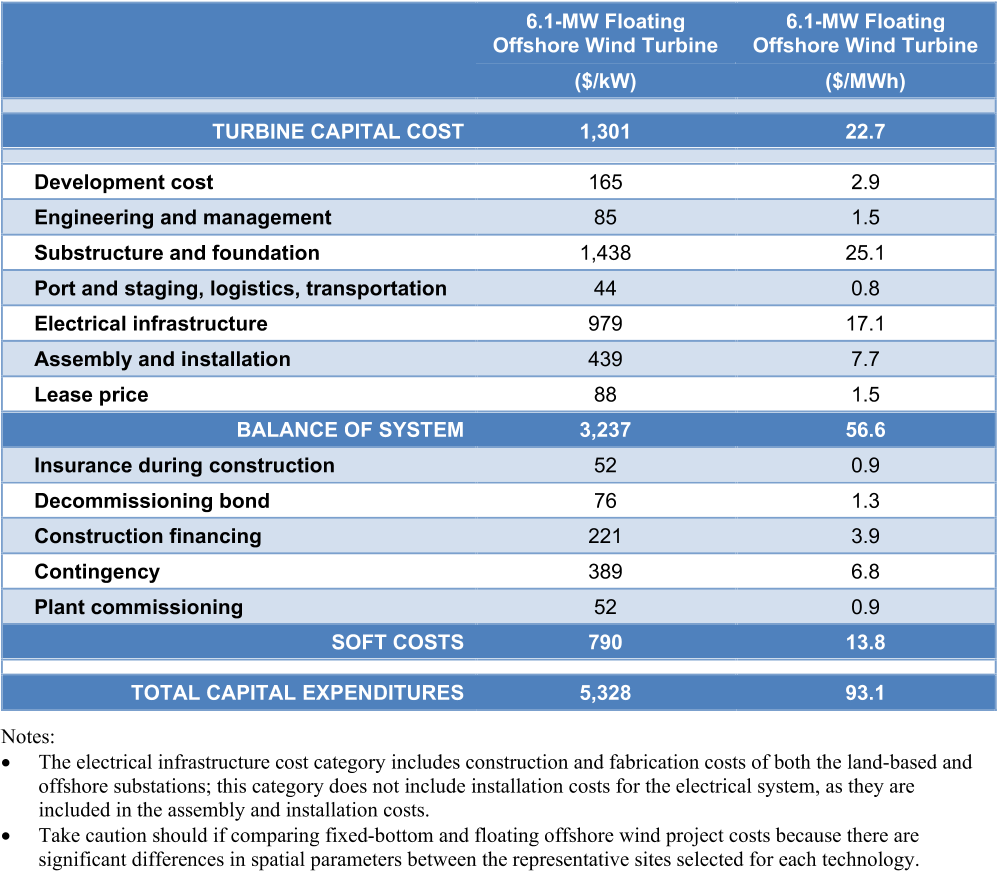
  • Table 24 summarizes the costs for the reference projects wind turbine and BOS CapEx components (including their contribution to LCOE).

6.3.1 Turbine Parameters

  • For the purpose of this report, the turbine parameters are specific to the turbine and independent of the wind resource characteristics.
  • The authors developed the power curve for the 20-kW residential system and the 100-kW commercial system assuming stall-regulated turbines with standard air density.
  • The authors used a standard air density of 1.225 kg/m3 for power curve development.
  • 38 This report is available at no cost from the National Renewable Energy Laboratory at www.nrel.gov/publications.

6.3.2 Wind Resource

  • The average wind speed can vary from project to project across the United States.
  • This wind speed is intended to be generally indicative of the wind regime for distributed wind projects installed in moderate-quality sites.
  • A summary of the wind resource assumptions for the 2019 representative site is included in Table 26.

6.3.3 Losses and Availability

  • They are treated as independent of any other input in this simplified analysis.
  • Types of losses accounted for here include blade soiling, turbine controls, and grid availability, totaling 11.5%.
  • The wind turbine availability is assumed to be 95%, indicating that the wind project is ready to produce power between wind turbine cut-in and cut-out wind speeds 95% of the time.
  • Net average AEP is calculated by applying all losses and availability to the gross AEP.
  • This report is available at no cost from the National Renewable Energy Laboratory at www.nrel.gov/publications.

6.3.4 Annual Energy Production

  • The authors estimated the gross AEP for this analysis using generic power curves for the 20- and 100-kW turbines developed by NREL and computed in Openwind (UL undated).
  • The losses and availability are then applied to calculate the net AEP.
  • Reference Residential and Commercial Distributed Wind Projects AEP and Capacity Factor Summary AEP and Capacity Factors (6-m/s wind speed at 50 m) Residential (20 kW) Commercial (100 kW) Net energy capture (kWh/kW/yr) 2,580 2,846 Net capacity factor (%) 29.5% 32.5% 6.4 Distributed Wind Operation and Maintenance Expenditures Additional details describing FCR are presented in Section 4.5.
  • Financing assumes debt for approximately 60% of the 23 Given the scarcity and varying quality of the data, OpEx may vary substantially among projects, and the data included here may not fully represent the challenges that OpEx present to the distributed wind industry.

6.5.1 Discount Rate

  • Typically, various financial terms, such as the cost of debt or equity, are captured in the discount rate, which is in turn used to estimate the cost of energy.
  • For this analysis, the discount rate is calculated as the after-tax WACC and it is presumed that the reported yields for equity are aftertax yields and can be used directly in the WACC calculation.
  • Each actual project, however, has a unique risk profile, financing terms, and ownership structure.
  • For this reason, a single WACC representing the distributed wind installations should be viewed cautiously and used to illustrate general market trends and conditions only.
  • This rate aligns with the inflation rate provided in NREL’s ATB.

6.5.2 Economic Evaluation Metrics

  • In the economic evaluation of wind energy investments there are two important metrics: the CRF and FCR, with details provided in Section 4.5.2.
  • National Renewable Energy Laboratory (NREL), Golden, CO (US).
  • A summary of the sensitivity parameters (i.e., capital recovery factor, fixed charge rate, and levelized cost of energy [LCOE]) are shown in Table B2.
  • The National Renewable Energy Laboratory’s Offshore Wind Cost Model, also referred to as the Offshore Regional Cost Analyzer, is subject to continuous data updates and validation, which help ensure that the model reflects the latest industry and market developments.

Did you find this useful? Give us your feedback

Figures (47)

Content maybe subject to copyright    Report

NREL is a national laboratory of the U.S. Department of Energy
Office of Energy Efficiency & Renewable Energy
Operated by the Alliance for Sustainable Energy, LLC
This report is available at no cost from the National Renewable Energy
Laboratory (NREL) at www.nrel.gov/publications.
Contract No. DE-AC36-08GO28308
Technical Report
NREL/TP-5000-78471
December 2020
2019 Cost of Wind Energy Review
Tyler Stehly,
Philipp Beiter, and Patrick Duffy
National Renewable Energy Laboratory

NREL is a national laboratory of the U.S. Department of Energy
Office of Energy Efficiency & Renewable Energy
Operated by the Alliance for Sustainable Energy, LLC
This report is available at no cost from the National Renewable Energy
Laboratory (NREL) at www.nrel.gov/publications.
Contract No. DE-AC36-08GO28308
National Renewable Energy Laboratory
15013 Denver West Parkway
Golden, CO 80401
303-275-3000 • www.nrel.gov
Technical Report
NREL/TP-5000-78471
December 2020
Philipp Beiter, and Patrick Duffy
2019 Cost of Wind Energy Review.
Renewable Energy Laboratory. NREL/TP-5000-78471.
.

NOTICE
This work was authored by the National Renewable Energy Laboratory, operated by Alliance for Sustainable
Energy, LLC, for the U.S. Department of Energy (DOE) under Contract No. DE-AC36-08GO28308. Funding
provided by the U.S. Department of Energy Office of Energy Efficiency and Renewable Energy Wind Energy
Technologies Office. The views expressed herein do not necessarily represent the views of the DOE or the U.S.
Government.
This report is available at no cost from the National Renewable
Energy Laboratory (NREL) at www.nrel.gov/publications
.
U.S. Department of Energy (DOE) reports produced after 1991
and a growing number of pre-1991 documents are available
free via www.OSTI.gov
.
Cover Photos by Dennis Schroeder: (clockwise, left to right) NREL 51934, NREL 45897, NREL 42160, NREL 45891, NREL 48097,
NREL 46526.
NREL prints on paper that contains recycled content.

iii
This report is available at no cost from the National Renewable Energy Laboratory at www.nrel.gov/publications.
Acknowledgments
The authors would like to thank Patrick Gilman (U.S. Department of Energy Office of Energy
Efficiency and Renewable Energy Wind Energy Technologies Office [WETO]) for supporting
this research. Thanks also to Daniel Beals of Allegheny Science and Technology (contractor to
WETO), Gage Reber (WETO fellow), Alice Orrell (Pacific Northwest National Laboratory), and
Bret Barker (contractor to WETO) for reviewing prior versions of this manuscript. Thank you to
Ryan Wiser and Mark Bolinger (Lawrence Berkeley National Laboratory) and Alice Orrell
(Pacific Northwest National Laboratory) for their analysis of wind project market data that
informed this analysis and also to Travis Williams, Nick Grue, and Anthony Lopez (National
Renewable Energy Laboratory) for their work in developing the national wind supply curves.
Thanks also to Eric Lantz (National Renewable Energy Laboratory) for his technical guidance,
contributions, and review of prior versions of this manuscript. Any remaining errors or omissions
are the sole responsibility of the authors.

iv
This report is available at no cost from the National Renewable Energy Laboratory at www.nrel.gov/publications.
List of Acronyms
AEP annual energy production
ATB Annual Technology Baseline
BOS balance of system
CapEx capital expenditures
CRF capital recovery factor
CSM Cost and Scaling Model
DOE U.S. Department of Energy
FCR fixed charge rate
GPRA Government Performance and Results Act
GW gigawatt
kW kilowatt
LandBOSSE Land-based Balance of System Systems
Engineering
LCOE levelized cost of energy
m meter
m/s meters per second
MACRS Modified Accelerated Cost Recovery System
MW megawatt
MWh megawatt-hour
NREL National Renewable Energy Laboratory
O&M operation and maintenance
OpEx operational expenditures
ORCA Offshore Wind Regional Cost Analyzer
PTC production tax credit
USD U.S. dollars
WACC weighted-average cost of capital
WETO Wind Energy Technologies Office
yr year

Citations
More filters
Journal ArticleDOI
TL;DR: The meeting of the Advisory Technical Committees of the International Electrotechnical Commission (ITC) was held in Brussels from March 27th to April 1st, 1989 as mentioned in this paper.
Abstract: Meetings of the Advisory Technical Committees of the International Electrotechnical Commission were held in Brussels March 27th to April 1st. The meetings were attended by delegates from eight national committees — Belgium, France, Great Britain, Holland, Italy, Spain, Switzerland, and the United States. There were about 40 delegates in all.

177 citations

ReportDOI
23 Aug 2018
TL;DR: Wiser et al. as mentioned in this paper provided an annual overview of trends in the U.S. wind power market and showed that wind power capacity additions continued at a rapid pace in 2017, and $11 billion was invested in new wind power plants in 2017.
Abstract: Author(s): Wiser, Ryan H; Bolinger, Mark | Abstract: The U.S. Department of Energy (DOE)’s Wind Technologies Market Report provides an annual overview of trends in the U.S. wind power market. Highlights of this year’s report include: -Wind power capacity additions continued at a rapid pace in 2017: $11 billion was invested in new wind power plants in 2017. In 2017, wind energy contributed 6.3% of the nation’s electricity supply, more than 10% of total electricity generation in fourteen states, and more than 30% in four of those states—Iowa, Kansas, Oklahoma, and South Dakota. -Bigger turbines are enhancing wind project performance: Increased blade lengths have dramatically increased wind project capacity factors, one measure of project performance, and taller towers appear to be on the horizon. The average 2017 capacity factor among projects built from 2014 through 2016 was 42%, compared to an average of 31.5% among projects built from 2004 to 2011 and 23.5% among projects built from 1998 to 2001. -Low wind turbine pricing continues to push down installed project costs: Wind turbine prices have fallen from their highs in 2008 to $750–$950/kW. Overall, the average installed cost of wind projects in 2017 was $1,610/kW, down $795/kW from the peak in 2009 and 2010. -Wind energy prices remain low: After topping out at 7¢/kWh for power purchase agreements (PPAs) executed in 2009, the national average price of wind PPAs has dropped to around 2¢/kWh—though this nationwide average is dominated by projects that hail from the lowest-priced Interior region of the country (such as Oklahoma, Nebraska, Kansas). These prices, which are possible in part due to federal tax support, compare favorably to the projected future fuel costs of gas-fired generation. -The domestic supply chain for wind equipment is diverse: Wind sector employment reached a new high of more than 105,000 full-time workers at the end of 2017. For wind projects recently installed in the U.S., domestically manufactured content is highest for nacelle assembly (g90%), towers (70-90%), and blades and hubs (50-70%), but is much lower (l20%) for most components internal to the turbine. -Continued strong growth in wind capacity is anticipated in the near term: With federal tax incentives still available, various forecasts for the domestic market show expected wind power capacity additions of 8,000 to 11,000 MW/year from 2018 to 2020, with market contraction anticipated beginning in 2021 as those tax incentives are phased out.

42 citations


Cites background or methods or result from "2019 Cost of Wind Energy Review"

  • ...…including a decline in the value of the U.S. dollar relative to the Euro; increased materials, energy, and labor input prices; a general increase in turbine manufacturer profitability due in part to strong demand growth; and increased costs for turbine warranty provisions (Moné et al. 2017)....

    [...]

  • ...dollar relative to the Euro; increased materials, energy, and labor input prices; a general increase in turbine manufacturer profitability due in part to strong demand growth; and increased costs for turbine warranty provisions (Moné et al. 2017)....

    [...]

  • ...Absent better data, and consistent with NREL assumptions, we assume that all plants have common total operating costs, at $51/kW-yr (Moné et al. 2017)....

    [...]

  • ...Since 2008, wind turbine prices have declined substantially, reflecting a reversal of some of the previously mentioned underlying trends that had earlier pushed prices higher (Moné et al. 2017) as well as increased competition among manufacturers and significant cost-cutting measures on the part of turbine and component suppliers....

    [...]

  • ...…have declined substantially, reflecting a reversal of some of the previously mentioned underlying trends that had earlier pushed prices higher (Moné et al. 2017) as well as increased competition among manufacturers and significant cost-cutting measures on the part of turbine and component…...

    [...]

Journal ArticleDOI
TL;DR: In this paper, the levelized cost of energy impacts of turbine ratings between 6 and 20 MW and plant capacities between 250 and 2,500 MW for fixed-bottom offshore wind using techno-economic cost models for foundation, electrical, installation, and operation and maintenance costs, along with annual energy production.

38 citations


Cites background or methods from "2019 Cost of Wind Energy Review"

  • ...The wind turbine represents around 30% of the overall CapEx costs for a typical fixed-bottom offshore wind project [36]; however, these costs are negotiated on an individual project basis and are typically kept confidential by the supplier and developer [10]....

    [...]

  • ...Values for the capacity-weighted global average project installed in 2019 are also reported [36]....

    [...]

  • ...The cost reductions are defined relative to a baseline project repesentative of the capacity-weighted average project installed in 2019, he most recent year for which data are available [36]....

    [...]

  • ...The modeling tools required for this analysis also require several additional parameters to be defined that are not specified in [36], including a 34-year wind and wave time series with hourly resolution taken at a representative point in the North Atlantic (41◦N, 71◦W) pulled from the ERA5 reanalysis data set at a 100-m measurement height [38]....

    [...]

  • ...7 ercentage of the BOS costs [36], the reduction contributes significantly to the overall cost decrease....

    [...]

Journal ArticleDOI
24 Jul 2019

30 citations

References
More filters
ReportDOI
15 May 2014
TL;DR: The work described in this report was co-funded by the U.S. Department of Energy's Wind and Water Power Technologies Office and Solar Energy Technologies Office, both within the Office of Energy Efficiency and Renewable Energy under Contract No. DE-AC02-05CH11231 as discussed by the authors.
Abstract: LBNL-XXXXX E RNEST O RLANDO L AWRENCE B ERKELEY N ATIONAL L ABORATORY An Analysis of the Costs, Benefits, and Implications of Different Approaches to Capturing the Value of Renewable Energy Tax Incentives Mark Bolinger Lawrence Berkeley National Laboratory Environmental Energy Technologies Division April 2014 Download from emp.lbl.gov/reports/re The work described in this report was co-funded by the U.S. Department of Energy’s Wind and Water Power Technologies Office and Solar Energy Technologies Office, both within the Office of Energy Efficiency and Renewable Energy, under Contract No. DE-AC02-05CH11231.

44 citations


"2019 Cost of Wind Energy Review" refers background in this paper

  • ...Although the PTC was scheduled to phase out completely by the end of 2019, a change to the year-end tax package in 2019 has extended the PTC through the end of 2020 (40...

    [...]

  • ...The ATB methodology is used to calculate the FCR. 12 Because these data are derived from installed projects in 2019, they include the impact of the PTC on the debt ratio even though the LCOE estimates do not include the PTC. 13 The U.S. tax reform bill passed and signed into law in December 2017 (Tax Cuts and Jobs Act, H.R. 1) lowers the corporate tax rate from 35% to 21%; hence, the 21% corporate tax rate is used in this year’s report assuming the final investment decisions for projects commissioned in 2019 would have been made under the reformed corporate tax rate....

    [...]

  • ...Although the PTC is a critical component for wind projects installed in 2019, it is expected to phase out in future years.14 Research has shown that one likely outcome of the termination of the PTC is increased project leverage, which will reduce the higher-cost tax-equity portion of project finance....

    [...]

  • ...List of Acronyms AEP annual energy production ATB Annual Technology Baseline BOS balance of system CapEx capital expenditures CRF capital recovery factor CSM Cost and Scaling Model DOE U.S. Department of Energy FCR fixed charge rate GPRA Government Performance and Results Act GW gigawatt kW kilowatt LandBOSSE Land-based Balance of System Systems Engineering LCOE levelized cost of energy m meter m/s meters per second MACRS Modified Accelerated Cost Recovery System MW megawatt MWh megawatt-hour NREL National Renewable Energy Laboratory O&M operation and maintenance OpEx operational expenditures ORCA Offshore Wind Regional Cost Analyzer PTC production tax credit USD U.S. dollars WACC weighted-average cost of capital WETO Wind Energy Technologies Office yr year v This report is available at no cost from the National Renewable Energy Laboratory at www.nrel.gov/publications....

    [...]

  • ...14 “In December 2015, Congress passed a 5-year phased-down extension of the PTC....

    [...]

Journal ArticleDOI
TL;DR: In this paper, the authors draw on a survey of wind industry professionals to clarify trends in the operational expenditures (OpEx) of U.S. land-based wind power plants.

44 citations


"2019 Cost of Wind Energy Review" refers background in this paper

  • ...wind industry survey, “Assessing wind power operating costs in the United States: Results from a survey of wind industry experts” (Wiser et al. 2019) is used to inform the O&M cost estimates for the representative wind plant....

    [...]

  • ...O&M market data are not widely available; therefore, the recent U.S. wind industry survey, “Assessing wind power operating costs in the United States: Results from a survey of wind industry experts” (Wiser et al. 2019) is used to inform the O&M cost estimates for the representative wind plant....

    [...]

  • ...…finance $/kW 34 Project construction over 3 years Contingency $/kW 86 6% of total CapEx Operational Expenditures (OpEx) Total OpEx $/kW/year 43 (Wiser et al. 2019) Financials Project design life Years 25 Project life for Government Performance and Reporting Act (GPRA) reporting Tax rate…...

    [...]

ReportDOI
01 Sep 2016

42 citations


"2019 Cost of Wind Energy Review" refers background in this paper

  • ...For each offshore wind region (as specified in Gilman et al. 2016), a 600-megawatt (MW) cohesive area within each Bureau of Ocean Energy Management lease and Call Area delineation (Bureau of Ocean Energy Management 2019) that is closest to shore (measured by direct distance) was identified,…...

    [...]

ReportDOI
01 Nov 2016

30 citations


"2019 Cost of Wind Energy Review" refers background in this paper

  • ...…LandBased Wind” (Eberle et al. 2019) OpEx Total OpEx $/kW/year 35 “Assessing the Future of Distributed Wind: Opportunities for Behind-the Meter Projects" (Lantz et al. 2016) Financials Project design life Years 25 Project life for Government Performance and Reporting Act (GPRA) reporting Tax rate…...

    [...]

  • ...…data are not widely available for distributed wind projects; therefore, $35/kW/yr are assumed—reported in “Assessing the Future of Distributed Wind” (Lantz et al. 2016)—for both residential and commercial distributed wind projects.23 The annual O&M cost from the 2016 report and the LCOE…...

    [...]

  • ...O&M market data are not widely available for distributed wind projects; therefore, $35/kW/yr are assumed—reported in “Assessing the Future of Distributed Wind” (Lantz et al. 2016)—for both residential and commercial distributed wind projects....

    [...]

  • ...(Lantz et al. 2016) Rotor diameter m 12.4 Hub height m 30 Specific power W/m2 166 Calculation Cut-in wind speed m/s 3 Typical turbine characteristics Cut-out wind speed m/s 20 66 This report is available at no cost from the National Renewable Energy Laboratory at www.nrel.gov/publications....

    [...]

  • ...project costs, consistent with typical debt levels for renewable power as well as conservative lending practices and typical long-term utility-sector debt and equity costs (Lantz et al. 2016)....

    [...]