
All figures (17)
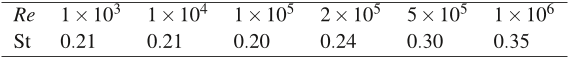
Table 1. The Strouhal number ( f ·DU ) number as function of Reynolds number. 
Figure 7. Variation of Strouhal number with with Reynolds number. 
Figure 12. Comparison between computed lift at various turbulence intensities and measured values from the LM tunnel. 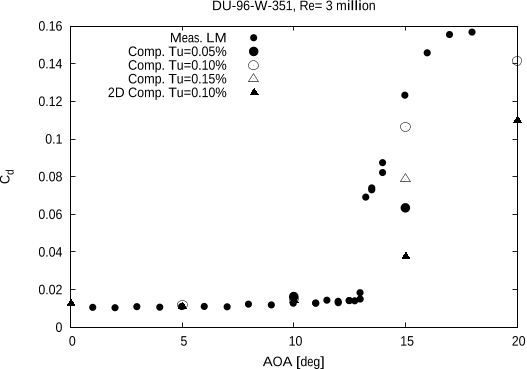
Figure 13. Comparison between computed drag at various turbulence intensities and measured values from the LM tunnel. 
Figure 1. Comparison between the four target points from the optimization and different correlation functions. 
Figure 5. Comparison of computed drag force for the fully turbulent and the transitional computations with the measurements. 
Figure 6. Identification of the Strouhal number for the Re=10000 case, using the power spectrum. 
Figure 11. Time trace of computed normal force from a simulation at 15 degrees angle of attack for three different inflow turbulence intensities. 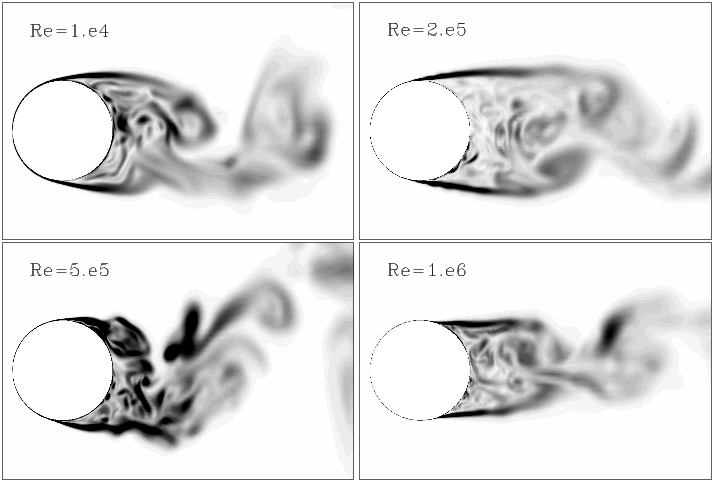
Figure 10. Representative snapshots of the absolute value of the vorticity behind the cylinder at four different Reynolds numbers, showing the narrowing of the wake with increasing Reynolds number. 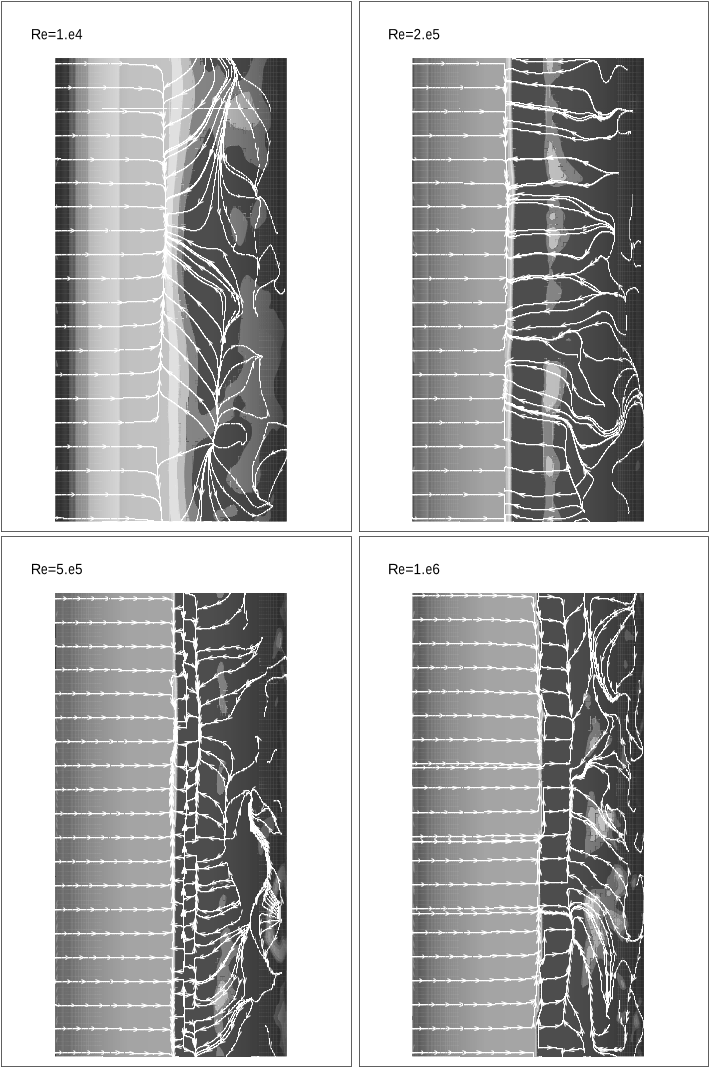
Figure 9. Instantaneous limiting streamlines on the surface of the cylinder for four cases of the simulations for transitional flow. 
Figure 3. Mesh around the DU profile. 
Figure 2. Mesh around the circular cylinder. ![Figure 8. Computed averaged azimuth position of the wake separation point measured from the stagnation point, compare with data from [24]](/figures/figure-8-computed-averaged-azimuth-position-of-the-wake-2rxyebnz.png)
Figure 8. Computed averaged azimuth position of the wake separation point measured from the stagnation point, compare with data from [24] 
Figure 4. The time history of the drag force for the case of a Reynolds number of 5×10⁵, showing the strong transient at the impulsive startup and the stochastic behavior in the ’periodic’ state. 
Figure 16. Power spectrum of the tangential force for the DU-96-W-351 airfoil at 45 degrees angle of attack, a clear Strouhal frequncy of 0.26 Hz is visible. 
Figure 14. Pressure distribution around the DU-96-W-351 airfoil, comparison between computed values and measured distribution at 10 degrees. 
Figure 15. Comparison of pressure distributions around the DU-96-W-351 airfoil at 15 degrees for three different turbulence intensities. Averages at six spanwise positions are shown for each computation.


![Figure 8. Computed averaged azimuth position of the wake separation point measured from the stagnation point, compare with data from [24]](/figures/figure-8-computed-averaged-azimuth-position-of-the-wake-2rxyebnz.webp)


