3D change detection – Approaches and applications
Summary (8 min read)
Notations of spatial resolution defined in this article:
- Low-to-medium Resolution; refers to remote sensing data with a spatial resolution lower than 4 meters, also known as LTMR.
- Refers to remote sensing data with a spatial resolution of 1-4 meters VHR: Very high resolution; Refers to remote sensing data with a spatial resolution of 0.3-1 meters.
- The data can be 3D models, point clouds or digital elevation models (DEM) that provide explicit 3D positions/shapes of the ground objects, or stereo-view/multi-view images that have potentials to generate such explicit 3D information.
- The scope of CD applications can be greatly expanded to a full 3D space, with flexibilities of detecting change in any viewing perspective and level of detail, including but not limited to 3D deformation analysis in landslides, fault rupture detection, 3D city model updating, 3D structure and construction monitoring, 3D object tracking, tree growth monitoring and biomass estimation etc.
1.1. Existing challenges and limits in traditional 2D image-based change detection
- For a long time, many CD studies have been conducted using 2D remote sensing images on large-scale problems such as forest monitoring, urban sprawl, earthquake assessment, etc.
- To a technically more extreme yet common example, i.e. close-range images in a complex street environment (Qin and Gruen, 2014; Xiao et al., 2015) , purely 2D image-based CD is less likely to be considered due to the large differences of viewing angle and perspective effects.
- Additionally, improved optical satellite sensors enable acquiring large scale (even multi-view) stereo images with sub-meter spatial resolution (such as Worldview, GeoEye images), with short revisit cycles.
1.2.3. About this review
- 3D data generated from images, Light Detection and Ranging , and readily available 3D geospatial products, such as 3D models, digital elevation models (DEM), etc., are the major sources of concern.
- In addition, this paper also summarizes some of the ongoing efforts and relevant practices that require 3D CD techniques in various fields.
- According to the objects of interest and viewing-scenario, 3D CD can be applied to both remote sensing data (captured from a top-view) and close-range/oblique data.
- Two fundamental utilizations of the 3D data can largely encapsulate the current 3D CD techniques: 1) Geometric comparison and 2) geometric-spectral analysis.
- In section 5, the authors discuss the potential problems and remaining challenges by summarizing the presented methods.
2. General considerations
- 3D change detection techniques are highly disparate for many applications.
- Different applications vary in the object of interest, resolution, quality of available 3D information, etc. Similar to traditional 2D image-based CD, 3D CD tasks typically have three processing steps: (a) Data acquisition/selection; (b) Data co-registration; (c) Change analysis.
- The first two steps are regarded as the preprocessing steps that generate and align multi-temporal 3D data for change detection and analysis.
- This section outlines the important aspects of 3D data acquisition/generation, co-registration and the change representation in 3D.
2.1 Data acquisition and generation
- Different applications consider objects with different ranges (from millimeter to kilometers); data with a matching resolution and accuracy to the object of interest is always desirable for computation and storage considerations (Tewkesbury et al., 2015) .
- Here in this subsection, the authors consider that in most cases they have certain flexibilities for 3D data acquisition and generation with common approaches.
- Input 3D data can be in various forms such as stereo images, DEM, point clouds and 3D models (vector data) that spatially represent the ground geometry.
2.1.1. Seasonal effects
- Seasonal variation is an undesired factor for traditional 2D CD, of which the humidity, snows and color change of tree/flowers etc. are all disturbances for detecting actual changes.
- 3D data are more robust towards this issue.
- In the case that the ground geometry also changes, such as leaves on/off, dryness of the river and high-level of snow coverage (Qin et al., 2015b) , seasonal effects may still create disturbances for 3D CD.
- It is still important to avoid such extreme seasonal discrepancies when selecting data for 3D CD, but this is generally less restrictive than for 2D cases (Hussain et al., 2013) , which stated that images should be acquired at nearly the same time of a year.
2.1.2. 3D data acquisition
- The quality of the 3D data usually refers to the accuracy in geometry, completeness, and resolution.
- Slightly higher resolution and accuracy are often desired, such that the object of interest can be recorded by tens of points or hundreds of pixels, as it will provide detailed information for object-based analysis (Blaschke, 2010) .
- (a) LiDAR data 3D data from LiDAR have consistent ranging accuracies.
- Every single measurement is highly accurate and in a top-view set up for data capture, and there is not much occlusion.
- When close-range data is considered, such as terrestrial or mobile LiDAR, data completeness becomes a critical issue for change detection, as very likely the occluded area will be identified as changes.
(b) Image-derived 3D data
- For 3D data derived from images, the achievable geo-referencing accuracy is largely correlated to the resolution.
- Though theoretically other factors, such as sensor distortion, image noise may affect the accuracy as well, these may not be critical issues nowadays for professional or even consumer grade cameras.
- For aerial and UAV photogrammetry, image blocks with at least 60-80% overlap in both forward and side direction usually renders good ray-intersection, thus giving good accuracy in spatial resection.
- Such requirements are fairly easy to achieve with automated piloting and shuttering system (Chao et al., 2010) : camera shutters are triggered when onboard location reading from the GPS (global positioning system) aligns with the pre-defined waypoints.
- Such pairs are selected from single images taken at different dates, of which the capture dates, radiometric properties, and intersection angle needs to be carefully evaluated: capturing date should be within a few months to avoid significant changes between two images of the stereo pair.
2.1.3. Image matching algorithm
- Image derived 3D point clouds are generated from geo-referenced images by dense image matching (DIM) techniques, the performance of which is decisive on the quality of the resulting point clouds.
- MSM is a direct extension of two-view stereo matching, in which images are paired and point clouds of each pair are fused/filtered to form a final point cloud (Haala and Rothermel, 2012; Hirschmüller, 2005) .
- MVM is a more rigorous way to incorporate redundant information, but often more complicated to implement.
- No specific conclusions were given on the performance of all test methods, due to the complex test cases and flexibility of tunable parameters.
- Both types of methods have advantages and disadvantages, and their performances vary with the camera network, scene content, and complexity, strategies for point matching (global or local) etc.
2.2. Data co-registration
- Depending on the input multitemporal data pairs (3D-EXP, 3D-IMP or mixture), the co-registration can be applied either under the constraint of the imaging sensor geometry (Fischler and Bolles, 1981) or by direct 3D transformations.
- A common approach to co-register two sets of 3DIMP data or mixture (one with 3D-EXP, and the other with 3D-IMP) is to use a set of GCPs (ground control points) and corresponding points, through the process of bundle adjustment (Fraser and Hanley, 2003; Triggs et al., 2000) .
- The co-registration between two 3D-IMP data can be performed with free-network bundle adjustment without control points.
- Local methods directly compute 3D transformations using a selected set of point correspondences (Theiler et al., 2014) , while the global methods minimizes the summed squared error of point-to-point or point-tosurface distances, such as least squares 3D matching (Gruen and Akca, 2005) and Iterative closest point (ICP) algorithm (Besl and Mckay, 1992; Chen and Medioni, 1992; Zhang, 1994) .
- These global methods have outlier removal procedures that are robust to data with a certain level of noise (Pilgrim, 1996) .
2.3. Change representation
- The second type is a triple indicator that labels the status of the change in geometry: "positive" refers to increased height/reduced depth and negative refers to the opposite.
- Type change is the most general and complete representation for CD tasks (Lu et al., 2004) .
- For category 2), the height/depth information plays a major role in change representation, and the spectral information may be used to assist the change analysis (Tian et al., 2010) .
- Post-classification is usually needed for calculating the type changes for category 3), and the use of height/depth information may be effective to improve the classification accuracy of the urban area (Huang et al., 2011 ) (Qin et al., 2015a ) (Zhang et al., 2015) .
3. Change detection techniques with 3D information
- The process of change detection and analysis is to find out the differences of the registered 3D data, optionally with associated spectral information.
- Oblique-view or close-range data are more complex due to the complicated multi-layer 3D structures and occlusions.
- Essentially, the 3D geometric information reveals two properties: 1) Geometric property -it provides physical measurements of the ground scene in the object space.
- The basic concepts behind the methods can be simply differentiated according to these two properties.
- Sensitive to misregistration and image matching errors; may produce many false positives for matched DSMs; only applied to 2.5 D scenarios.
3.1. Geometric comparison
- Depending on the viewing scenario (oblique-view, top-view) and data format (DSM, point clouds, stereo images, etc.), the geometric comparison can be quite different.
- Moreover, image sets taken from different perspectives implicitly contain 3D geometric information (refer to 3D-IMP data in section 2.2), and the geometric difference of such data requires image comparison through projection (projection-based method) , or multi-ray consistency evaluation.
- Different methods have their advantages for different types of 3D data, and it is important to select an appropriate approach according to the application and data.
- Projection-based inter-correlation method, the geometric difference is computed by projecting image on to the object, and then back project to image as ; the differences are given by measuring the differences between and .
3.1.1. Height differencing
- Some algorithms tend to find the minimal planes (Schenk et al., 2000) , and often this is determined by the application context.
- Sasagawa et al. (2013) applied the height differencing in the urban area using DSMs generated from ALOS (Advanced Land Observation Satellite) triplets to indicate changes on individual buildings.
- Such strategy is effective to reduce noise for large urban objects; however there remain potential risks of discarding actual changes on small objects.
- The height threshold, as one of the most important parameters to obtain the final change mask, is influenced by the accuracy of the data, as well as the co-registration result.
- One way for threshold determination is to use a priori information such as the pre-assessment of the DSM quality and empirical choices, or trial-and-error tests (Lu et al., 2004; Murakami et al., 1999) .
3.1.2. 3D Euclidean distances
- A major problem of height differencing is its high sensitivity to misregistration and artifacts, which may lead to significant errors around object boundaries (e.g. building edges).
- The difference between the Euclidean and height distance can be easily understood in Figure 1(a-b ).
- Similarly, Kang and Lu (2011) adopted the Hausdorff distance (Huttenlocher et al., 1993) to detect the difference between LiDAR scanning data and a reference 3D model.
- Nevertheless, failing to detect such features may omit some important changes.
3.1.3. Projection-based geometric differences
- Poorly captured stereo images, such as those with large intersection angles, leading to large parallaxes, may not be able to produce usable DSMs/point clouds for CD using even the most advanced DIM algorithms.
- It correlates, one image of the stereo pair, using the DSM or point cloud, with the other image, and compares their radiometric/spectral differences . Qin and Gruen (2014) extended inter-correlation to a multistereo case to determine view-based change evidence by comparing a strip of images with mobile LiDAR point clouds.
- In each voxel, consistencies of the projected color from multi-view images are evaluated statistically.
- Very often after the probability assignment, Markov interfering processes (Blake et al., 2011) were applied to reduce noise effects.
3.2. Combined geometric and spectral analysis
- 3D geometric information (DSMs, point clouds and 3D models, etc.), as an information source, can be applied for various analysis, such as object extraction/recognition, shape analysis.
- Very often the geometric information comes with spectral information, such as multispectral/hyperspectral orthophoto and image texture.
- While on the other hand, it faces the risk of propagating both of their deficiencies to the CD results.
- Post-refinement refers to the process of using geometric and/or spectral information to refine the initial change evidence resulting from the geometric comparison.
- The third approach is very popular in 2D change detection, which first classifies both datasets or detects the objects of interest, and then compares the resulting labels of the two datasets.
3.2.1. Post-refinement
- The results of geometric comparison vary with the quality and accuracy of the 3D data.
- Attempt for such consideration was given for manual interpretations (Sasagawa et al., 2008) , where the radiometric difference of the images was used as a double-check for DSM subtraction results.
- When only a certain type of object is of interest, shape features from the DSM can be used to refine the change mask using either supervised (Chaabouni-Chouayakh and Reinartz, 2011) or unsupervised methods.
- Tian et al. (2010) applied a box-fitting method to regularize extracted building boundaries.
- The "post-refinement" approaches employ a hierarchical structure, where initial change evidence are given by geometric comparison, followed by geometric and spectral analysis for result refinements.
3.2.2. Direct feature fusion
- Contrary to the hierarchical "post-refinement" approaches, direct feature fusion simultaneously considers all channels of information.
- Such feature fusion can be performed in either the feature level or decision level, meaning either the geometric/spectral features (e.g. height differences, shape indexes, spectral differences, NDVI. etc) are fused to generate change evidence, or change evidence resulting from all the sources are fused as the final change cues.
- The experiments were conducted on forest areas using Cartosat-1 images, in which they reported a notable improvement compared to simple DSM/radiometric subtraction and CVA fusion, and to other traditional classification methods like SVM (Vapnik, 1963; Vapnik and Kotz, 1982; Wang, 2005) , and random forest (Breiman, 2001) .
- Then the height change information was fused with the building object map to deliver a detailed change detection results.
- Such methods can be easily incorporated into other kinds of information without additional re-design of the algorithm.
3.2.3. Post-classification comparison
- The temporally varying conditions may greatly disturb the geometric and spectral comparison of two datasets.
- Post-classification methods propose to detect objects of interest or perform land-cover classification first, and then compare the resulting labels , which avoid direct comparison of the spectral and height information.
4. 3D change detection applications
- The development of 3D CD can greatly facilitate many new and existing applications.
- Due to space restrictions, not all potential applications and references are included in this survey; the authors show several examples of research works in this context to demonstrate the growing demands and possibilities for 3D CD in various fields.
- A summary of 3D CD applications is included under Urban, Environment & Ecology, and Civil contexts: -Urban -building/infrastructure/urban canopy change detection, 3D city model update, disaster assessment.
- -Civil -monitoring of structure, construction/mining progress, traffic and pedestrian tracking.
5. Discussions
- Both issues are indispensable to form successful solutions for 3D CD.
- The "data differentiation" and "identification of meaningful objects" are in line with two properties of the 3D data introduced in section 3, being geometric and information properties: geometries are compared to obtain the geometric differences, and objects of interest are identified through cues and features extracted from 3D information.
- Here in this subsection the authors extensively discuss these techniques, and other specific issues related to 3D CD techniques and applications.
5.1. Geometric comparison
- Height differencing remains to be the most convenient method for an initial check on the data quality, although it leads to potential errors due to misregistration and data quality issues.
- The Euclidean distance measure is often coupled with a coregistration, for which finding the normal direction and corresponding points are computationally heavy.
- In 3D CD using DSM (2.5D) and images, the Euclidean distance does not really offer many advantages in terms of geometric measurement in practical applications, as the relative rotation between DSMs is not significant (Waser et al., 2008) , and errors in the object boundaries can be eliminated by post-filtering techniques.
- Height differences can describe the geometric discrepancies well for registered DSMs (Qin, 2014a) .
- Its major problem is that it may omit areas with insignificant textures.
5.2. Geometric -spectral analysis
- Three categories of methods using geometric and/or spectral information have been described in section 3.2.
- Among all the investigated methods, "post-refinement" appears to be the top choice when using high accuracy DSMs.
- The advantage of this method is that it is effective to lower resolution data and there are many readily available fusion algorithm such as CVA and kernel CD (Johnson and Kasischke, 1998; Tian et al., 2014b) .
- It should be noted, that "post-classification" methods are in some cases able to produce accurate results.
- When available, existing GIS data can be very helpful in both change refinement (for regularization) (Dini et al., 2012) and classification (for sample collection) (Maas et al., 2016) .
5.3. Pixels, Objects, Voxels
- The pros and cons about object/pixel-based techniques in remote sensing image processing have been frequently discussed.
- The underlying algorithmic concepts are very similar in many cases as indicated by Tewkesbury et al. (2015) .
- For analyzing individual objects, the object-based concept is necessary as the shape features are very important to differentiate one type of object from another (Benediktsson et al., 2003) .
- Nevertheless, dividing the 3D space into regular cubes may dramatically increase the memory consumption with possible overflow, leading to high computation burden.
- Recent attempts tried to use coarse-to-fine strategies to form adaptive voxels to reduce the memory and computation time (Bláha et al., 2016) .
5.4. LiDAR and images
- In section 2.1, the authors have suggested acquiring data with a resolution to reduce the cost depending on the problem to solve, the amount of data and computation.
- Both sensors are available in major platforms such airborne, UAV, ground vehicles, terrestrial stations, except for spaceborne platforms, where only images are available.
- Nowadays low-cost and lightweight LiDAR (Lin et al., 2011; Wallace et al., 2012) is available to be mounted on smaller platforms such as UAV.
- Nowadays even non-photogrammetry experts can operate their UAVs and generate 3D data with these tools (Colomina and Molina, 2014) .
- The disadvantage of satellite image may be that they are less flexible in image configuration, and more importantly, the aerial platform is still the major carrier of multi-camera systems that capture large-scale oblique images.
6. Summary and Recommendations
- This paper provides a critical review of the current 3D change detection techniques.
- Euclidean distance measure is slightly complicated but particularly useful for co-registration of 3D oblique data/close-range data.
- 1) Resolution and object of interest: Generally higher resolution data deliver better results on a fixed object-scale, while this also brings increasing processing regarding time and cost.
- 3DEXP: 3D explicit data: point clouds, 3D models, DSMs etc. 3) For images with good photogrammetric camera network, the authors recommend multi-stereo matching methods, one of the best practices leverage speed and performance is semi-global matching and its sibling algorithms (such as SGM with hierarchical strategies (Rothermel et al., 2012) ).
- 6) "Direct feature fusion" method is recommended when DSMs have potential errors or drawbacks and pre-and post-event spectral images from the same dates are also available.
Did you find this useful? Give us your feedback
Figures (6)

Table 4. Examples of 3D CD applications 
Figure 1. Different geometric comparison methods. (a) Height difference, distances are computed vertically. (b) Euclidean distances, distances are computed in the surface normal direction. (c) projection-based inter-correlation method, the geometric difference is computed by projecting image on to the object, and then back project to image as ; the differences are given by measuring the differences between and . 
Table 3. An overview of the current 3D change detection methods 
Table 5. Recommendations on data co-registration (ordered by priority) 
Table 1. Overview of the differences between 3D and 2D CD problems 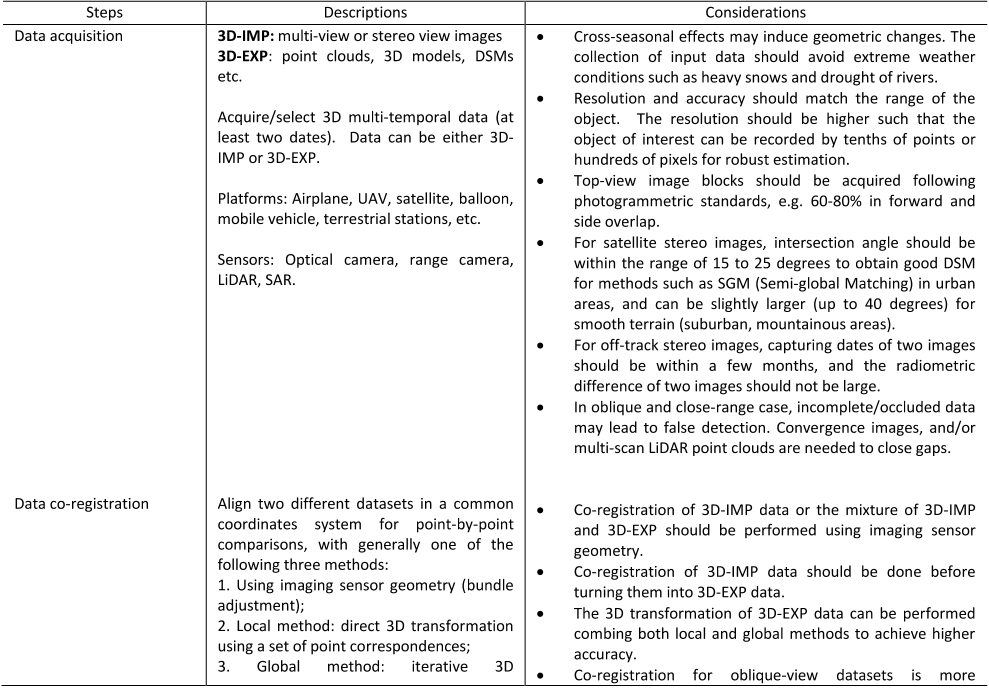
Table 2. Key considerations in a 3D CD task


Citations
552 citations
Cites background from "3D change detection – Approaches an..."
...3D information can also help to determine changes in height and volume, and has a wide range of applications, such as 3D deformation analysis in landslides, 3D structure and construction monitoring [22]....
[...]
338 citations
301 citations
264 citations
Cites background from "3D change detection – Approaches an..."
..., is also a direction of future development [6]....
[...]
205 citations
References
[...]
79,257 citations
"3D change detection – Approaches an..." refers background or methods in this paper
...…on forest areas using Cartosat-1 images, in which they reported a notable improvement compared to simple DSM/radiometric subtraction and CVA fusion, and to other traditional classification methods like SVM (Vapnik, 1963; Vapnik and Kotz, 1982; Wang, 2005), and random forest (Breiman, 2001)....
[...]
...Classifier-based models may be able to learn the weights of information sources, such as Random Forests (Breiman, 2001) and Neural Network (Foody, 1996), while this requires accurate training samples....
[...]
23,396 citations
Additional excerpts
...Depending on the input multitemporal data pairs (3D-EXP, 3D-IMP or mixture), the co-registration can be applied either under the constraint of the imaging sensor geometry (Fischler and Bolles, 1981) or by direct 3D transformations....
[...]
17,598 citations
8,247 citations
4,194 citations
"3D change detection – Approaches an..." refers methods in this paper
...Similarly, Kang and Lu (2011) adopted the Hausdorff distance (Huttenlocher et al., 1993) to detect the difference between LiDAR scanning data and a reference 3D model....
[...]