
All figures (10)

Figure 5: BA plots showing the difference in values between the CHALICE density method and Outlets per 1000 population, Outlets per KM2 and KDE. Stratified by Rural (n=321) Urban (n=1238) classification 
Figure 6: BA plots showing the difference in values between the CHALICE density method and: Outlets per 1000 population, Outlets per KM2 and KDE. Stratified by Least Deprived (n=758) and Most Deprived (n=759) using the WIMD. 
Table 1: Framework scores for five AOD methods. The CHALICE ethod CHALICE Density ; the CHALICE methodology using a populatio weighted e troid as the a ess easure poi t CHALICE (PWC) , Kernel density estimates ( KDE ); Outlet counts per 1000 LSOA populatio Outlets per 1000 ); Outlet counts per geographi al area Outlets per km2 ). 
Figure 3: Density scores stratified by deprivation. 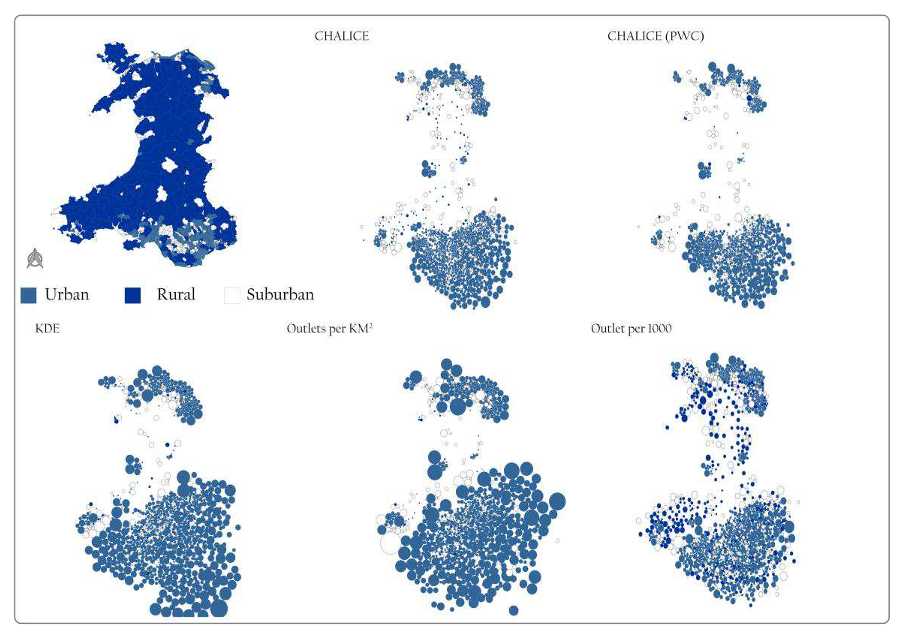
Figure 2: Density scores stratified by rural urban classification. 
Table 2: Descriptive statistics for five measures of AOD at LSOA-level (n=1896). 
Table 3: Descriptive statistics for five measures of AOD at LSOA-level. Urban-Rural Split LSOA s Ur a U = 8, ‘ural ‘ = 
Figure 1: CHALICE method conceptual framework 
Figure 7: Population location estimates using PWC resulting in null values for density calculations 
Figure 4: BA plots showing the difference in values between the CHALICE density method and Outlets per 1000 population, Outlets per km2 and KDE.


01 Mar 2020-