scispace - formally typeset
Search or ask a question
Posted ContentDOI

A better way to define and describe Morlet wavelets for time-frequency analysis

21 Aug 2018-bioRxiv (Cold Spring Harbor Laboratory)-pp 397182
TL;DR: This paper is to present alternative formulations of Morlet wavelets in time and in frequency that allow parameterizing the wavelets directly in terms of the desired temporal and spectral smoothing (as full-width at half-maximum).
Abstract: Morlet wavelets are frequently used for time-frequency analysis of non-stationary time series data, such as neuroelectrical signals recorded from the brain. The crucial parameter of Morlet wavelets is the width of the Gaussian that tapers the sine wave. This width parameter controls the trade-off between temporal precision and frequency precision. It is typically defined as the "number of cycles," but this parameter is opaque, and often leads to uncertainty and suboptimal analysis choices, as well as being difficult to interpret and evaluate. The purpose of this paper is to present alternative formulations of Morlet wavelets in time and in frequency that allow parameterizing the wavelets directly in terms of the desired temporal and spectral smoothing (as full-width at half-maximum). This formulation provides clarity on an important data analysis parameter, and should facilitate proper analyses, reporting, and interpretation of results. MATLAB code is provided.

Summary (3 min read)

MX Cohen Morlet wavelet definition 2 of 14

  • Motivation for time-frequency analysis Many biological and physical systems exhibit rhythmic processes.
  • Rhythmic temporal structure embedded in time series data can be extracted and quantified using the Fourier transform or other spectral analysis methods.
  • The Fourier transform has a “soft assumption” of signal stationarity, which means that the spectral and other features of the signal remain constant over time.
  • The primary assumption here is that the signal is roughly stationary over some shorter time window.

MX Cohen Morlet wavelet definition 3 of 14

  • Overview of methods for time-frequency analysis A key parameter in time-frequency analysis is the one that governs the trade-off between temporal precision and spectral precision; it is not possible to have simultaneously arbitrarily good precision in both time and in frequency.
  • This parameter is typically defined as the “number of cycles,” but the purpose of this paper is to argue that it would be better to define the Gaussian width as the full-width at half-maximum (FWHM), which is the distance in time between 50% gain before the peak to 50% gain after the peak.
  • There are several advantages of Morlet wavelets for time-frequency analysis.
  • CC-BY-NC-ND 4.0 International licenseavailable under a not certified by peer review) is the author/funder, who has granted bioRxiv a license to display the preprint in perpetuity.

MX Cohen Morlet wavelet definition 4 of 14

  • There are two key assumptions of Morlet wavelet-based time-frequency analysis.
  • The first is that the signal is roughly sinusoidal.
  • On the other hand, the overwhelming success and ubiquity of time-frequency analysis methods indicates that minor violations of this assumption are not deleterious for practical data analysis, hypothesis-testing, data mining, and feature discovery.
  • Interpreting the results of Morlet wavelet convolution relies on the assumption that the signal is stationary within the time window that the wavelet has non-zero energy.
  • The copyright holder for this preprint (which wasthis version posted August 21, 2018.

MX Cohen Morlet wavelet definition 5 of 14

  • Selected and reported in a way that obscures the assumption underlying the data analysis.
  • The key goal of this paper is to present two different methods of formulating and describing Morlet wavelets in a way that makes this assumption transparent and easily interpretable.
  • Other applications may require a different number of cycles.
  • The relationship between the number of cycles and the temporal-spectral smoothing is unclear, partly because most people do not think about time in terms of “number of cycles,” and partly because the effect of n on the temporal smoothing depends on the frequency of the wavelet .
  • Many researchers and students struggle with how to specify and interpret this parameter, which leads to confusion and possibly suboptimal data analyses.

MX Cohen Morlet wavelet definition 6 of 14

  • The empirical FWHM can be obtained by subtracting the time point where the post-peak Gaussian is closest to 50% gain (if the Gaussian is normalized to a peak amplitude of 1, then this is the value closest to .5) from the time point where the pre-peak Gaussian is closest to 50% gain.
  • (This algorithm is presented in the MATLAB code at the end of this document.).
  • Figure 3 shows the relationship between the empirical FWHM derived from equations 1-2 vs. equation 3.
  • It is recommended to set the FWHM no lower than one cycle at the frequency of the sine wave used to create the wavelet.
  • This corresponds to ~2⅔ cycles (the n parameter in equation 2).

MX Cohen Morlet wavelet definition 7 of 14

  • Have wider spectral energy windows (Cohen 2014) , so creating wavelets using the minimum bound is not necessarily optimal.
  • The discussion above concerns defining the wavelet in the time domain.
  • The empirical FWHM in the time domain Morlet wavelet can be obtained by applying the FWHM estimation procedure to the magnitude of the complex time series.
  • CC-BY-NC-ND 4.0 International licenseavailable under a not certified by peer review) is the author/funder, who has granted bioRxiv a license to display the preprint in perpetuity.
  • The copyright holder for this preprint (which wasthis version posted August 21, 2018.

MX Cohen Morlet wavelet definition 8 of 14

  • It is sensible and useful to report the FWHM in both the time and the frequency domains.
  • This will facilitate interpretation of the results and replication of analysis methods.
  • Here is a suggestion for describing the wavelets:.
  • The authors implemented time-frequency analysis by convolving the signal with a set of complex Morlet wavelets, defined as complex sine waves tapered by a Gaussian.
  • The full-width at half-maximum (FWHM) ranged from XXX to XXX ms with increasing wavelet peak frequency.

MX Cohen Morlet wavelet definition 9 of 14

  • CC-BY-NC-ND 4.0 International licenseavailable under a not certified by peer review) is the author/funder, who has granted bioRxiv a license to display the preprint in perpetuity.
  • The copyright holder for this preprint (which wasthis version posted August 21, 2018.

MX Cohen Morlet wavelet definition 11 of 14

  • CC-BY-NC-ND 4.0 International licenseavailable under a not certified by peer review) is the author/funder, who has granted bioRxiv a license to display the preprint in perpetuity.
  • The copyright holder for this preprint (which wasthis version posted August 21, 2018.

MX Cohen Morlet wavelet definition 13 of 14

  • CC-BY-NC-ND 4.0 International licenseavailable under a not certified by peer review) is the author/funder, who has granted bioRxiv a license to display the preprint in perpetuity.
  • The copyright holder for this preprint (which wasthis version posted August 21, 2018.

Did you find this useful? Give us your feedback

Content maybe subject to copyright    Report

MX Cohen Morlet wavelet definition 1 of 14
A better way to define and describe Morlet wavelets
for time-frequency analysis
Michael X Cohen
Radboud University and Radboud University Medical Center; Donders Institute for Neuroscience
Correspondence: mikexcohen@gmail.com
Funding: MXC is funded by an ERC-StG 638589
Abstract
Morlet wavelets are frequently used for time-frequency analysis of non-stationary time series data,
such as neuroelectrical signals recorded from the brain. The crucial parameter of Morlet wavelets is
the width of the Gaussian that tapers the sine wave. This width parameter controls the trade-off
between temporal precision and frequency precision. It is typically defined as the “number of cycles,
but this parameter is opaque, and often leads to uncertainty and suboptimal analysis choices, as well
as being difficult to interpret and evaluate. The purpose of this paper is to present alternative
formulations of Morlet wavelets in time and in frequency that allow parameterizing the wavelets
directly in terms of the desired temporal and spectral smoothing (as full-width at half-maximum).
This formulation provides clarity on an important data analysis parameter, and should facilitate
proper analyses, reporting, and interpretation of results. MATLAB code is provided.
.CC-BY-NC-ND 4.0 International licenseavailable under a
not certified by peer review) is the author/funder, who has granted bioRxiv a license to display the preprint in perpetuity. It is made
The copyright holder for this preprint (which wasthis version posted August 21, 2018. ; https://doi.org/10.1101/397182doi: bioRxiv preprint

MX Cohen Morlet wavelet definition 2 of 14
Motivation for time-frequency analysis
Many biological and physical systems exhibit rhythmic processes. Rhythmic temporal structure
embedded in time series data can be extracted and quantified using the Fourier transform or other
spectral analysis methods.
However, the Fourier transform has a soft assumption” of signal stationarity, which means that the
spectral and other features of the signal remain constant over time. To be sure, the Fourier transform
is a perfect representation of the time series, regardless of its temporal dynamics. However, the
power spectrum resulting from the Fourier transform is easily visually interpretable only for
stationary signals; non-stationarities are encoded in the phase spectrum, which is typically
impossible to interpret visually.
Signal non-stationarities are the primary motivation for time-frequency analyses, in which the power
spectrum is computed over short windows of time. The primary assumption here is that the signal is
roughly stationary over some shorter (sliding) time window. For neural time series data, this
assumption is typically a few hundreds of milliseconds. An example of a “static” and dynamic”
spectral representation of a non-stationary signal is presented in Figure 1.
Figure 1 . In the presence of signal non-stationarities (panel A), the “static” power spectrum from the
Fourier transform can be difficult to interpret (panel B). In these cases, a time-frequency analysis
(panel C) is often insightful.
.CC-BY-NC-ND 4.0 International licenseavailable under a
not certified by peer review) is the author/funder, who has granted bioRxiv a license to display the preprint in perpetuity. It is made
The copyright holder for this preprint (which wasthis version posted August 21, 2018. ; https://doi.org/10.1101/397182doi: bioRxiv preprint

MX Cohen Morlet wavelet definition 3 of 14
Overview of methods for time-frequency analysis
There are several time-frequency analysis methods, most of which produce qualitatively or
quantitatively similar results (Bruns 2004; Cohen 2014) . The three most commonly used are the
short-time fast Fourier transform, complex wavelet convolution, and filter-Hilbert. These three
methods have in common that they involve isolating a narrow temporal window of data and then
extracting its frequency spectrum.
A key parameter in time-frequency analysis is the one that governs the trade-off between temporal
precision and spectral precision; it is not possible to have simultaneously arbitrarily good precision in
both time and in frequency. Furthermore, the resulting smoothness is often advantageous for
averaging data across stimulus repetitions and individuals; thus, arbitrarily good precision can be
detrimental in applied data analysis of biological systems.
The key argument of this paper is that this crucial parameter is created and reported in a way that
obscures both the signal-processing and the theoretical assumptions that are imposed on the data,
and that shape the results. The key upshot of this paper is two alternative methods for creating and
reporting Morlet wavelets in a way that makes this key parameter transparent and easily
interpretable.
Advantages and assumptions of Morlet wavelets for time-frequency analysis
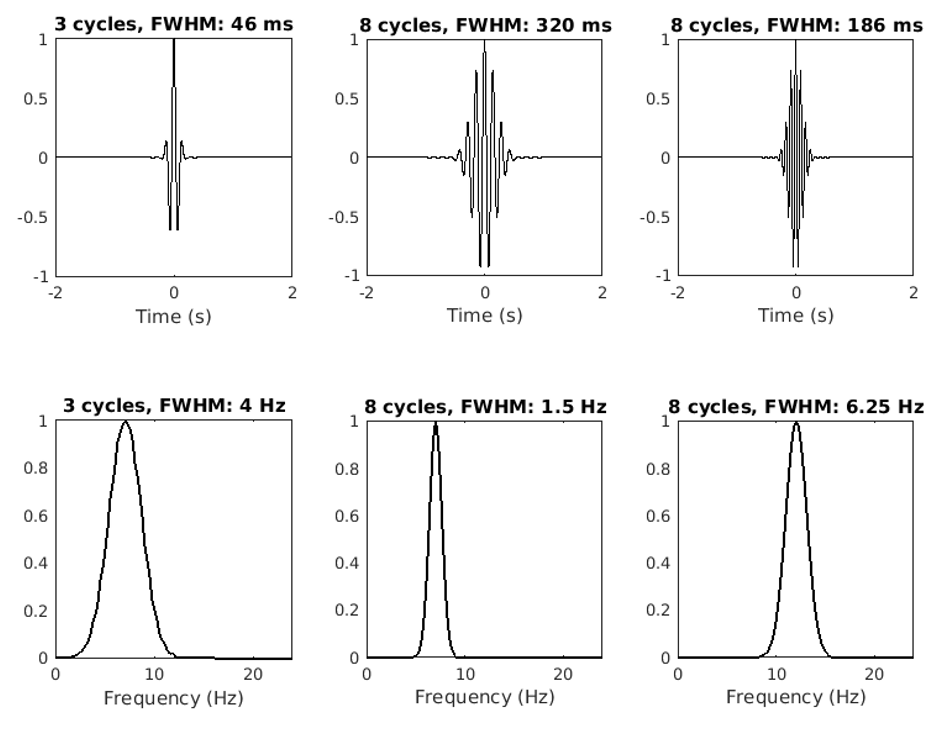
A Morlet wavelet is defined as a sine wave tapered by a Gaussian (Figure 2, top row). For
time-frequency analysis, a complex Morlet wavelet is used, in which the Gaussian tapers a complex
sine wave. The complex Morlet wavelet is then convolved with the time series signal, and the result
of convolution is a complex-valued signal from which instantaneous power and phase can be
extracted at each time point. Wavelet convolution can be conceptualized as a “template-matching
procedure, in which each time point in the signal is compared against a template (the
Gaussian-windowed sine wave), and the result of the convolution is a time series of similarities”
between the signal and the wavelet.
The tapering Gaussian has one parameter that defines its width (also called its shape or deviation). A
wider Gaussian leads to decreased temporal precision but increased spectral precision, and
vice-versa for a narrower Gaussian. This parameter is typically defined as the “number of cycles, but
the purpose of this paper is to argue that it would be better to define the Gaussian width as the
full-width at half-maximum (FWHM), which is the distance in time between 50% gain before the peak
to 50% gain after the peak.
There are several advantages of Morlet wavelets for time-frequency analysis. One is that the Morlet
wavelet is Gaussian-shaped in the frequency domain (Figure 2, bottom row). The absence of sharp
edges minimizes ripple effects that can be misinterpreted as oscillations (this is a potential danger
associated with plateau-shaped filters). Second, the results of Morlet wavelet convolution retain the
temporal resolution of the original signal. Third, wavelet convolution is more computationally
efficient and requires less code compared to other methods, because it involves the smallest number
of computations, most of which are implemented using the fast Fourier transform.
.CC-BY-NC-ND 4.0 International licenseavailable under a
not certified by peer review) is the author/funder, who has granted bioRxiv a license to display the preprint in perpetuity. It is made
The copyright holder for this preprint (which wasthis version posted August 21, 2018. ; https://doi.org/10.1101/397182doi: bioRxiv preprint

MX Cohen Morlet wavelet definition 4 of 14
Figure 2 . Three Morlet wavelets in the time domain (upper row) and in the frequency domain (lower
row) with two frequencies and different time-frequency trade-off parameters. The argument of this
paper is that reporting this parameter in terms of full-width at half-maximum (FWHM) in the time
and/or frequency domains is more informative than number of cycles.
There are two key assumptions of Morlet wavelet-based time-frequency analysis. The first is that the
signal is roughly sinusoidal. Some researchers have noted that brain oscillations are probably not
shaped like pure sine waves (Cole and Voytek 2017; Jones 2016) . On the other hand, the
overwhelming success and ubiquity of time-frequency analysis methods indicates that minor
violations of this assumption are not deleterious for practical data analysis, hypothesis-testing, data
mining, and feature discovery. The sinusoidal assumption is therefore considered valid, and
additional detailed waveform analyses can be insightful in specific instances.
The second assumption of Morlet wavelet analysis concerns stationarity of the signal. Interpreting
the results of Morlet wavelet convolution relies on the assumption that the signal is stationary within
the time window that the wavelet has non-zero energy. Generally, this can be taken as the FWHM of
the Gaussian that is used to create the Morlet wavelet. Any signal non-stationarities that are smaller
than this FWHM will produce results that are difficult to interpret (similar to the “static” power
spectrum in Figure 1).
Appropriate selection of the width of the wavelet is a combination of signal processing
considerations, and theoretical/speculative considerations of the system from which the signal was
measured. This parameter is therefore important for time frequency data analysis, and yet is often
.CC-BY-NC-ND 4.0 International licenseavailable under a
not certified by peer review) is the author/funder, who has granted bioRxiv a license to display the preprint in perpetuity. It is made
The copyright holder for this preprint (which wasthis version posted August 21, 2018. ; https://doi.org/10.1101/397182doi: bioRxiv preprint

MX Cohen Morlet wavelet definition 5 of 14
selected and reported in a way that obscures the assumption underlying the data analysis. The key
goal of this paper is to present two different methods of formulating and describing Morlet wavelets
in a way that makes this assumption transparent and easily interpretable.
Typical definition of Morlet wavelets
A complex Morlet wavelet w can be defined as the product of a complex sine wave and a Gaussian
window:
(1)
where i is the imaginary operator ( ), f is frequency in Hz, and t is time in seconds. To avoid
introducing a phase shift, t should be centered at t=0 , for example, by defining t from -2 to +2
seconds. is the width of the Gaussian, which is defined as
(2)
The parameter that defines the time-frequency precision trade-off is n , which is often referred to as
the “number of cycles. For neurophysiology data such as EEG, MEG, and LFP, typical values of n
range from 2 to 15 over frequencies between 2 Hz and 80 Hz. Other applications may require a
different number of cycles.
There is nothing “wrong with equations 1 and 2. However, the relationship between the number of
cycles and the temporal-spectral smoothing is unclear, partly because most people do not think
about time in terms of “number of cycles, and partly because the effect of n on the temporal
smoothing depends on the frequency of the wavelet (see Figure 2). Many researchers and students
struggle with how to specify and interpret this parameter, which leads to confusion and possibly
suboptimal data analyses.
A better definition of the Morlet wavelet
A definition of the complex Morlet wavelet that provides more clarity is
(3)
The new parameter here is h , which is the FWHM in seconds.
Equation 3 is not fundamentally different from equations 1-2. It is simply a way of rewriting the
formula to make the temporal smoothing parameter easier to define, understand, and report. Rather
than specifying a number of cycles (which might feel arbitrary and mysterious), one can specify a
FWHM in seconds (assuming that t is defined in seconds), which is a more natural unit to think about
in terms of desired temporal smoothing, and in terms of the assumption of the duration of
stationarity in the system under investigation.
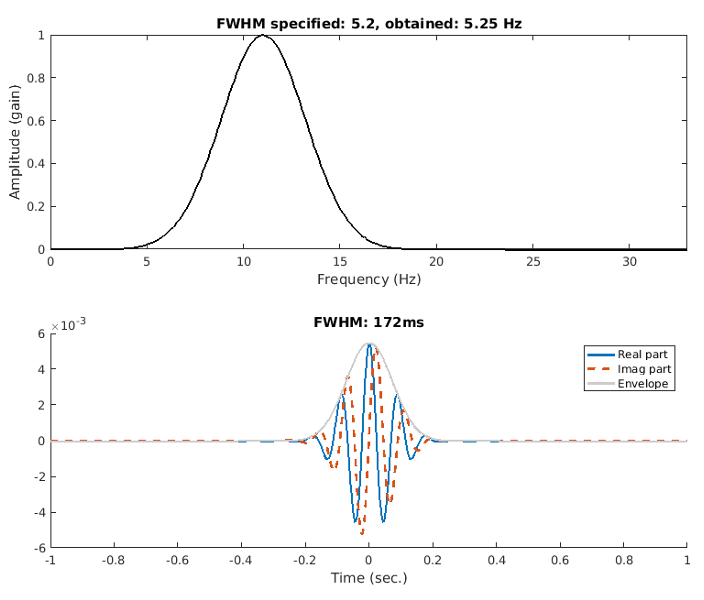
The h parameter in equation 3 is analytical; its actual implemented value depends on the data
sampling rate. For this reason, it is recommended to compute and examine the empirical FWHM that
is implemented in software. When the sampling rate is considerably higher than the frequency of
interest, the specified and empirical widths should match closely.
.CC-BY-NC-ND 4.0 International licenseavailable under a
not certified by peer review) is the author/funder, who has granted bioRxiv a license to display the preprint in perpetuity. It is made
The copyright holder for this preprint (which wasthis version posted August 21, 2018. ; https://doi.org/10.1101/397182doi: bioRxiv preprint

Citations
More filters
DissertationDOI
01 Jan 2019
TL;DR: Brain information could be helpful for e.g. stratifying patients into different intensity programs based on their predicted potential to recover and applied to apply closed-loop systems modulating the intensity of tasks to reach the optimal brain state that facilitates learning.
Abstract: This thesis aimed at looking for neural correlates of motor adaptation as a model of rehabilitation after brain injury. Healthy adults across the lifespan and stroke patients were tested in a force-field learning paradigm. This thesis focuses on EEG analysis and the complex relationship of brain-derived measures with observed behaviour. To describe each domain in detail, the focus was first on finding group differences between older and younger healthy adults in a similar manner as it was later between stroke patients versus healthy controls. The analyses were finalised by looking for relationships between the EEG and motor performance data in a multiple linear regression approach. As candidate EEG biomarkers of motor adaptation, error related event related potential around movement onset in the frontocentral electrodes was chosen in time domain. In the time-frequency domain, the focus was on movement related beta band spectral perturbation, looking at the electrodes over the primary motor cortex and the frontocentral ROI found significant in the time domain. Finally, functional connectivity was analysed focusing first on electrode over the primary motor cortex contralateral to the movement as a seed region, to narrow down the analysis to bilateral motor cortex connectivity and connectivity between primary motor cortex contralateral to the movement and the frontocentral region identified as important in the time domain analysis. The crucial part of the project was analysing the relationship between the neural and kinematic measures. The most important predictor of summed error in motor adaptation was the connectivity between C3 and C4 electrode at the baseline prestimulus period in motor adaptation condition and pinch asymmetry. Higher prestimulus interhemispheric connectivity was associated with bigger deviation from the optimal trajectory. When looking at summed error dynamic derivative as a dependent variable - performance index - it was the ERP at the central error-related ROI that explained the most variance. It can be concluded that higher baseline interhemispheric connectivity can be a reflection of a maladaptive process, perhaps related to increased interhemispheric inhibition. It is important to also note that the same connectivity at different timepoints in the movement can be of different significance - differences between stroke patients and controls were present in the postmovement period. In conclusion, brain information could be helpful for e.g. stratifying patients into different intensity programs based on their predicted potential to recover. Moreover, brain information could be utilised to apply closed-loop systems modulating the intensity of tasks to reach the optimal brain state that facilitates learning. I believe this work will help incorporating brain-derived measures in informing neurorehabilitation programmes in the future.

5 citations


Cites background from "A better way to define and describe..."

  • ...The choice of Morlet wavelets and parameters was standard, confer e.g. Cohen (2019)....

    [...]

Journal ArticleDOI
15 Sep 2021
TL;DR: In this paper, the Saharan heat low (SHL) is a key component of the West African monsoon system at synoptic scale and a driver of summertime precipitation over the Sahel region, therefore, accurate seasonal precipitation forecasts rely in part on a proper representation of the SHL characteristics in seasonal forecasts models.
Abstract: The Saharan Heat Low (SHL) is a key component of the West African monsoon system at synoptic scale and a driver of summertime precipitation over the Sahel region. Therefore, accurate seasonal precipitation forecasts rely in part on a proper representation of the SHL characteristics in seasonal forecasts models. This is investigated using the last versions of two seasonal forecast systems namely the SEAS5 and MF7 systems respectively from the European Center of Medium range Weather Forecasts (ECMWF) and Meteo-France. The SHL characteristics in the seasonal forecast models is assessed based on a comparison with the fifth ECMWF ReAnalysis (ERA5) for the period 1993-2016. The analysis of the modes of variability shows that the seasonal forecast models have issues with the timing of the SHL pulsations and the intensities when compared to ERA5. SEAS5 and MF7 show a cooling trend centered on the Sahara and a warming trend located in the eastern part of the Sahara, respectively. Both models tend to underestimate the inter-annual variability of the SHL. We also show that the seasonal forecast models detect the eastward and westward shift of the SHL during the monsoon season. The use of statistical bias correction methods significantly reduces the bias in the seasonal forecast models and improves the forecast score. Despite an improvement of prediction score, the SHL-related forecast skills of SEAS5 and MF7 remain weak for a lead time beyond 1 month.

5 citations

Posted Content
TL;DR: The proposed genetic algorithm (GA) for feature selection, based on a novel fitness function here presented, outperforms the benchmark when the two different datasets considered are merged together, showing the effectiveness of the proposal on heterogeneous data.
Abstract: The electroencephalographic (EEG) signals provide highly informative data on brain activities and functions. However, their heterogeneity and high dimensionality may represent an obstacle for their interpretation. The introduction of a priori knowledge seems the best option to mitigate high dimensionality problems, but could lose some information and patterns present in the data, while data heterogeneity remains an open issue that often makes generalization difficult. In this study, we propose a genetic algorithm (GA) for feature selection that can be used with a supervised or unsupervised approach. Our proposal considers three different fitness functions without relying on expert knowledge. Starting from two publicly available datasets on cognitive workload and motor movement/imagery, the EEG signals are processed, normalized and their features computed in the time, frequency and time-frequency domains. The feature vector selection is performed by applying our GA proposal and compared with two benchmarking techniques. The results show that different combinations of our proposal achieve better results in respect to the benchmark in terms of overall performance and feature reduction. Moreover, the proposed GA, based on a novel fitness function here presented, outperforms the benchmark when the two different datasets considered are merged together, showing the effectiveness of our proposal on heterogeneous data.

4 citations


Cites methods from "A better way to define and describe..."

  • ...…consider the following features: the Hjorth parameters (Hjorth, 1970; RodriguezBermudez et al., 2013), the power spectral density (PSD) estimated through Welch’s method (Welch, 1967) and the PSD extracted through Morlet wavelet (Cohen, 2014, 2019), detailed in the following and developed in MATLAB....

    [...]

  • ...Moreover, we are interested in the localization of the frequency information in time, thus we use the Morlet wavelet, following the definition given by Cohen (2014, 2019)....

    [...]

Journal ArticleDOI
TL;DR: In this article , the authors analyzed the relationship between government expenditures and revenues for Italy over the period 1862-2013 and showed the relevance of the frequency domain in analyzing the relationship of government expenditure and revenues.
Abstract: In this paper, we analyze the relationship between government expenditures and revenues for Italy over the period 1862–2013. The analysis of the expenditures-revenues nexus is also relevant from the point of view of fiscal sustainability. Our empirical strategy adopts the wavelet analysis approach. The empirical evidence demonstrates the relevance of the frequency domain in analyzing the relationship between government expenditures and revenues, which may lead to alternative policy implications. Indeed, after the recent economic crises, guaranteeing its own financial stability is an increasingly difficult task for a highly indebted government like the Italian one.

4 citations

Journal ArticleDOI
TL;DR: In this article , the authors investigated the ability of tACS to modulate cortical somatosensory information processing as assessed by SEPs and found that TACS applied at individual mu and beta frequencies and at the theta frequency over the primary S1 cortex (S1) was able to increase the amplitude of SEPs.

4 citations

References
More filters
Book
17 Jan 2014
TL;DR: This book offers a comprehensive guide to the theory and practice of analyzing electrical brain signals and is the only book on the topic that covers both the theoretical background and the implementation in language that can be understood by readers without extensive formal training in mathematics.
Abstract: A comprehensive guide to the conceptual, mathematical, and implementational aspects of analyzing electrical brain signals, including data from MEG, EEG, and LFP recordings. This book offers a comprehensive guide to the theory and practice of analyzing electrical brain signals. It explains the conceptual, mathematical, and implementational (via Matlab programming) aspects of time-, time-frequency- and synchronization-based analyses of magnetoencephalography (MEG), electroencephalography (EEG), and local field potential (LFP) recordings from humans and nonhuman animals. It is the only book on the topic that covers both the theoretical background and the implementation in language that can be understood by readers without extensive formal training in mathematics, including cognitive scientists, neuroscientists, and psychologists. Readers who go through the book chapter by chapter and implement the examples in Matlab will develop an understanding of why and how analyses are performed, how to interpret results, what the methodological issues are, and how to perform single-subject-level and group-level analyses. Researchers who are familiar with using automated programs to perform advanced analyses will learn what happens when they click the "analyze now" button. The book provides sample data and downloadable Matlab code. Each of the 38 chapters covers one analysis topic, and these topics progress from simple to advanced. Most chapters conclude with exercises that further develop the material covered in the chapter. Many of the methods presented (including convolution, the Fourier transform, and Euler's formula) are fundamental and form the groundwork for other advanced data analysis methods. Readers who master the methods in the book will be well prepared to learn other approaches.

1,339 citations


"A better way to define and describe..." refers background or result in this paper

  • ...There are several time-frequency analysis methods, most of which produce qualitatively or quantitatively similar results (Bruns 2004; Cohen 2014)....

    [...]

  • ...One should also keep in mind that wavelets with narrower Gaussians (smaller FWHM) have wider spectral energy windows (Cohen 2014), so creating wavelets using the minimum bound is not necessarily optimal....

    [...]

Journal ArticleDOI
TL;DR: This report compares the three classical spectral analysis approaches: Fourier, Hilbert and wavelet transform and demonstrates that the three techniques are in fact formally (i.e. mathematically) equivalent when using the class of wavelets that is typically applied in spectral analyses.

430 citations


"A better way to define and describe..." refers result in this paper

  • ...There are several time-frequency analysis methods, most of which produce qualitatively or quantitatively similar results (Bruns 2004; Cohen 2014)....

    [...]

Journal ArticleDOI
TL;DR: It is shown here that there are numerous instances in which neural oscillations are nonsinusoidal, and approaches to characterize nonsinusoid features and account for them in traditional spectral analysis are highlighted.

380 citations


"A better way to define and describe..." refers background in this paper

  • ...Some researchers have noted that brain oscillations are probably not shaped like pure sine waves (Cole and Voytek 2017; Jones 2016)....

    [...]

Journal ArticleDOI
TL;DR: Evidence showing time-domain signals with vastly different waveforms can exhibit identical spectral-domain frequency and power and non-oscillatory waveform feature can create spurious high spectral power is reviewed.

220 citations


"A better way to define and describe..." refers background in this paper

  • ...Some researchers have noted that brain oscillations are probably not shaped like pure sine waves (Cole and Voytek 2017; Jones 2016)....

    [...]