
All figures (12)

Table 5: Overall condition of river quality 
Table 1: WFD timetable 
Table 7: Environmental Cost per RBD 
Table 2: Total cost of water 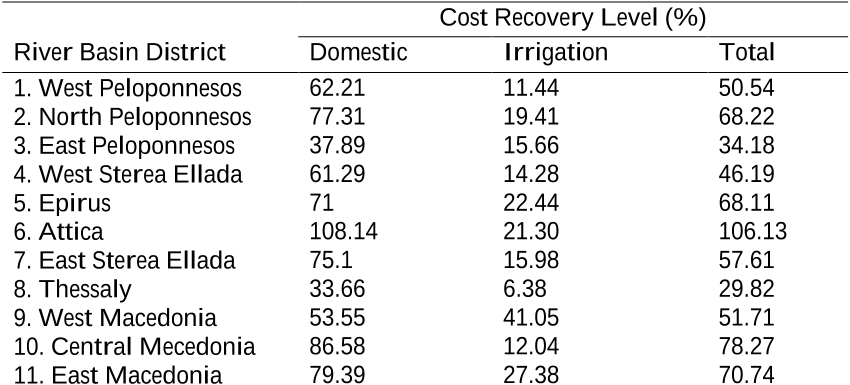
Table 9: Cost Recovery Level in each RBD 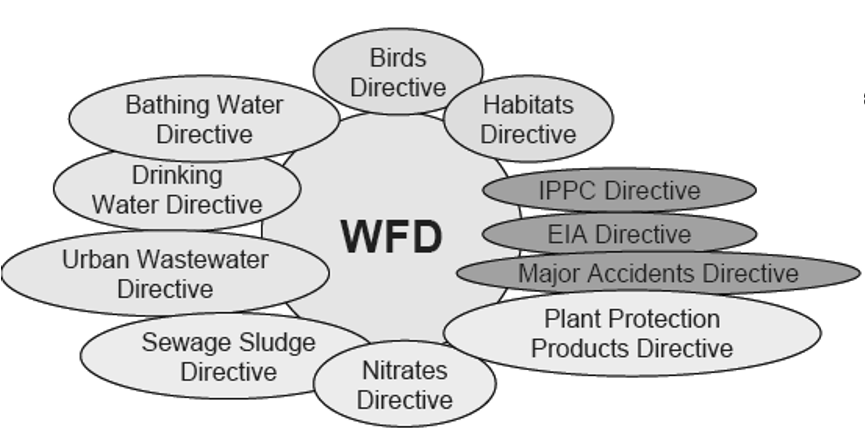
Figure 1: WFD, a truly integrated Directive 
Table 6: Financial cost per RBD 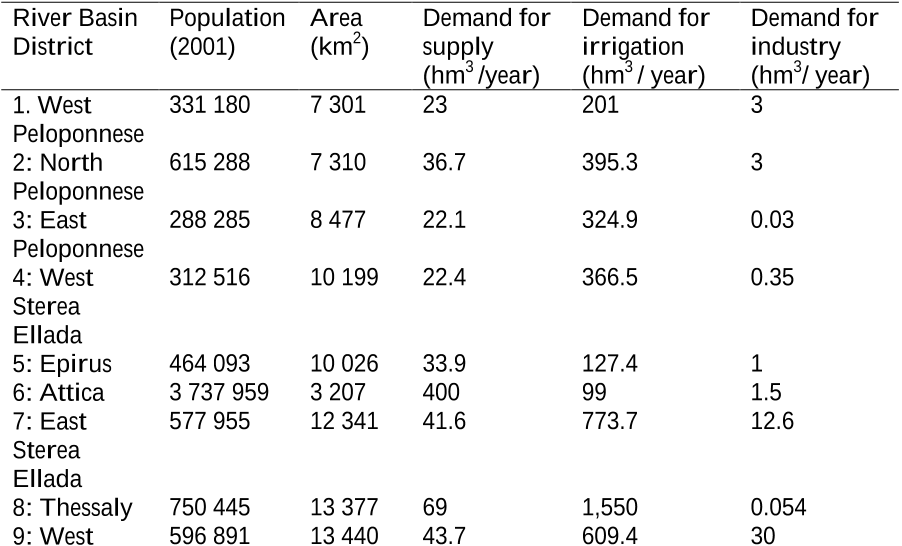
Table 4:Economic analysis of the most important water uses and pressures in each RBD 
Figure 4: Greek River Basins Source: http://www.minenv.gr/nera/ (WFD Article 3 report - Greek maps) 
Figure 3: Greek River Basin Districts Source: http://www.minenv.gr/nera/ (WFD Article 3 report - Greek maps) 
Table 8: Resource Cost per RBD 
Figure 3: Greek River Basin Districts Source: http://www.minenv.gr/nera/ (WFD Article 3 report - Greek maps)


