
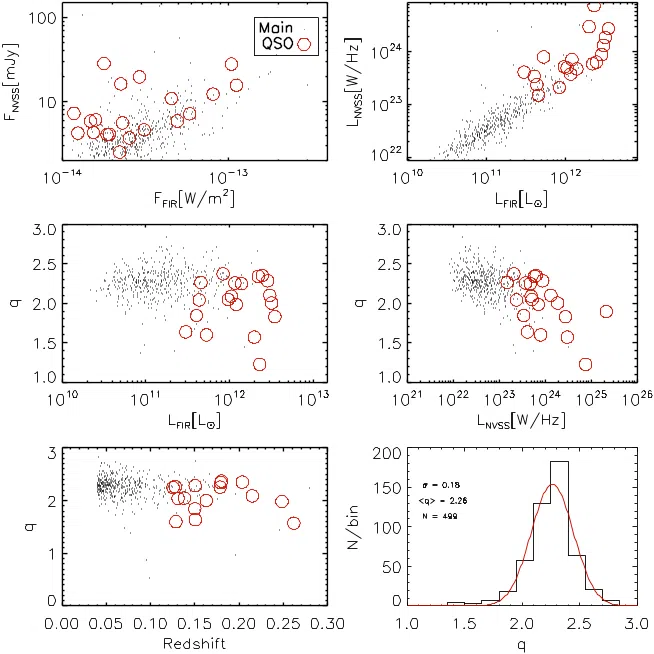
Figure 7. Radio–FIR correlation shown for the NVSS–SDSS–IRAS galaxies (dots) and quasars (open circles). The middle panels show the FIR/radio ratio (i.e., q parameter defined by Equation (1)) as a function of FIR (left) and radio (right) luminosities. Note a decrease in the q-value with increasing radio luminosity. The bottom panels show q as a function of redshift (left) and the distribution of q with its best-fit Gaussian (right). The number of objects in the sample (N), the biweighted mean FIR/radio ratio (〈q〉), and the dispersion (σ ) are indicated in the bottom right panel.
...read more