


The Astrophysical Journal, 724:779–790, 2010 November 20 doi:10.1088/0004-637X/724/1/779
C
2010. The American Astronomical Society. All rights reserved. Printed in the U.S.A.
A CLOSER VIEW OF THE RADIO–FIR CORRELATION: DISENTANGLING THE CONTRIBUTIONS OF STAR
FORMATION AND ACTIVE GALACTIC NUCLEUS ACTIVITY
∗
I. Mori
´
c
1,2
,V.Smol
ˇ
ci
´
c
2,3,4,7
, A. Kimball
5,6
, D. A. Riechers
2,8
,
ˇ
Z Ivezi
´
c
5
, and N. Scoville
2
1
Physics Department, University of Zagreb, Bijeni
ˇ
cka cesta 32, 10002 Zagreb, Croatia
2
California Institute of Technology, MC 249-17, 1200 East California Boulevard, Pasadena, CA 91125, USA
3
European Southern Observatory, Karl-Schwarzschild-Strasse 2, 85748 Garching b. Muenchen, Germany
4
Argelander Institut for Astronomy, Auf dem H
¨
ugel 71, Bonn, 53121, Germany
5
Department of Astronomy, University of Washington, Box 351580, Seattle, WA 98195-1580, USA
6
National Radio Astronomy Observatory, 520 Edgemont Road, Charlottesville, VA 22903, USA
Received 2010 August 9; accepted 2010 September 21; published 2010 November 4
ABSTRACT
We extend the Unified Radio Catalog, a catalog of sources detected by various (NVSS, FIRST, WENSS, GB6) radio
surveys, and SDSS, to IR wavelengths by matching it to the IRAS Point and Faint Source catalogs. By fitting each
NVSS-selected galaxy’s NUV-NIR spectral energy distribution (SED) with stellar population synthesis models we
add to the catalog star formation rates (SFRs), stellar masses, and attenuations. We further add information about
optical emission-line properties for NVSS-selected galaxies with available SDSS spectroscopy. Using an NVSS
20 cm (F
1.4 GHz
2.5 mJy) selected sample, matched to the SDSS spectroscopic (“main” galaxy and quasar) catalogs
and IRAS data (0.04 <z 0.2) we perform an in-depth analysis of the radio–FIR correlation for various types of
galaxies, separated into (1) quasars, (2) star-forming, (3) composite, (4) Seyfert, (5) LINER, and (6) absorption line
galaxies using the standard optical spectroscopic diagnostic tools. We utilize SED-based SFRs to independently
quantify the source of radio and FIR emission in our galaxies. Our results show that Seyfert galaxies have FIR/radio
ratios lower than, but still within the scatter of, the canonical value due to an additional (likely active galactic nucleus
(AGN)) contribution to their radio continuum emission. Furthermore, IR-detected absorption and LINER galaxies
are on average strongly dominated by AGN activity in both their FIR and radio emission; however their average FIR/
radio ratio is consistent with that expected for star-forming galaxies. In summary, we find that most AGN-containing
galaxies in our NVSS–IRAS–SDSS sample have FIR/radio flux ratios indistinguishable from those of the star-
forming galaxies that define the radio–FIR correlation. Thus, attempts to separate AGNs from star-forming galaxies
by their FIR/radio flux ratios alone can separate only a small fraction of the AGNs, such as the radio-loud quasars.
Key words: cosmology: observations – evolution – galaxies: active – galaxies: fundamental parameters – radio
continuum: galaxies
Online-only material: color figures
1. INTRODUCTION
The radio–FIR correlation is one of the tightest correlations
in observational astrophysics (e.g., Helou et al. 1985; Condon
1992; Mauch & Sadler 2007; Yun et al. 2001;Bell2003;
Sargent et al. 2010; Kovacs et al. 2006; Murphy et al. 2009;
Appleton et al. 2004). The correspondence between the radiation
in the (far-)infrared and that in the radio spans over nearly
five orders of magnitude in various types of galaxies, ranging
from dwarfs to ULIRGs. Given that the two observational
windows, IR and radio, trace independent and different intrinsic
physical mechanisms in galaxies—thermal versus synchrotron
radiation—the existence of such a tight correspondence is
remarkable. It is generally believed that recent star formation in
galaxies is the process that relates IR and radio emission.
The radio–FIR correlation has been extensively studied in the
past both in the low- (Helou et al. 1985; Condon 1992; Garrett
2002; Mauch & Sadler 2007; Yun et al. 2001;Bell2003) and
high-redshift universe (Sargent et al. 2010; Michałowski et al.
2010; Kovacs et al. 2006; Sajina et al. 2008; Murphy et al.
2009; Appleton et al. 2004; Vlahakis et al. 2008; Ibar et al.
∗
Based on observations with the National Radio Astronomy Observatory
which is a facility of the National Science Foundation operated under
cooperative agreement by Associated Universities, Inc.
7
ESO ALMA COFUND Fellow.
8
Hubble Fellow.
2008; Chapman et al. 2005). It has been shown that, out to
redshifts of z ∼ 3–4, the FIR/radio ratios of various types of
galaxies are essentially the same as those in the local universe.
At higher redshifts, radio-quiet QSOs have been demonstrated to
have FIR/radio ratios consistent with the local value, while the
FIR/radio ratios of z>4 SMGs are found to be lower by a few
factors. This is somewhat contrary to expectations, as the FIR/
radio ratio is expected to be rising with redshift (especially at
z 3) due to the increase of the cosmic microwave background
(CMB) energy density (U
CMB
) with redshift, U
CMB
∝ (1 + z)
4
,
which suppresses the non-thermal component of a galaxy’s radio
continuum via inverse-Compton (IC) scattering (see Murphy
2009 for details). An explanation for this discrepancy can be
provided by additional processes that add to a galaxy’s radio
continuum, such as increased magnetic field strengths or AGN
contribution, that may compensate for the radio continuum
emission losses due to IC scattering.
The AGN contribution to the radio–FIR correlation has been
studied in the past to some extent. Typically a low FIR/radio
ratio, significantly offsetting a galaxy from the correlation, is
thought to indicate a radio-loud AGN (e.g., Yun et al. 2001;
Condon et al. 2002). However, recent studies have shown that
optically selected AGNs often follow the correlation, albeit
with a slightly lower FIR/radio ratio. For example, based on
SDSS–NVSS–IRAS data, Obri
´
cetal.(2006) have demonstrated
a tight correlation between radio and 60 μm fluxes for low-
779

780 MORI
´
C ET AL. Vol. 724
luminosity AGNs (predominantly Seyferts and LINERs), which
varies by only ∼20% relative to that of star-forming galaxies.
Utilizing 6dFGS-NVSS-IRAS data, Mauch & Sadler (2007)
inferred a lower average FIR/radio ratio for AGN-bearing
galaxies (Seyferts, LINERs, and quasars), but still within the
scatter of the correlation for star-forming galaxies. Furthermore,
studies of the correlation at higher redshifts have yielded a
handful of interesting objects for which it has clearly been shown
that a significant AGN contribution to IR and/or radio exists,
yet their FIR/radio ratio is consistent with the canonical value
for star-forming galaxies (Riechers et al. 2009; Murphy et al.
2009).
In order to understand in more detail the contribution of AGN
activity to the radio–FIR correlation, we perform an in-depth
study of the radio–FIR correlation, with a large sample, as a
function of galaxy type, and comparison with star formation
rates (SFRs) for those individual samples. The various types of
star-forming and AGN-bearing galaxies have been drawn from
the NVSS (Condon et al. 1998), IRAS (Neugebauer et al. 1984),
and Sloan Digital Sky Survey (SDSS; York et al. 2000)sky
surveys. In Section 2, we present the data used in this paper. We
present the correlation for various types of galaxies in Section 3.
In Section 4, we link the FIR and radio emission from galaxies in
our sample to independently derived SFRs, and in Section 5 and
Section 6 we discuss and summarize our results, respectively.
We adopt H
0
= 70, Ω
M
= 0.3, Ω
Λ
= 0.7, and define the
radio synchrotron spectrum as F
ν
∝ ν
−α
, assuming α = 0.7.
Throughout the text we will often use the term “quasar” referring
to both quasi-stellar radio sources and quasi-stellar objects.
2. DATA AND GALAXY SAMPLES: EXPANDING THE
UNIFIED RADIO CATALOG
2.1. Unified Radio Catalog
Kimball & Ivezi
´
c(2008) have constructed a catalog of radio
sources detected by the GB6 (6 cm), FIRST (Becker et al. 1995),
NVSS (Condon et al. 1998; 20 cm), and WENSS (92 cm) radio
surveys, as well as the SDSS (DR6) optical survey (York et al.
2000). This “Unified Radio Catalog” has been generated in
such a way that it allows a broad range of 20 cm based sample
selections and source analysis (see Kimball & Ivezi
´
c 2008 for
details). The 2.7 million entries are comprised of the closest
three FIRST to NVSS matches (within 30
) and vice versa, as
well as unmatched sources from each survey. All entries have
been supplemented by data from the other radio and optical
surveys, where available. Here we select from the Unified Radio
Catalog (version 1.1) all 20 cm sources that have been detected
by the NVSS radio survey (using matchflag
nvss =−1 and
matchflag
first 1; see Kimball & Ivezi
´
c 2008 for details). This
selection yields a radio flux limited (F
1.4 GHz
2.5 mJy) sample
that contains 1,814,748 galaxies. In the following section, we
expand this catalog to IR wavelengths, and augment it with
additional (spectroscopic and SED-based) information.
2.2. Expanding the Unified Radio Catalog
2.2.1. IRAS
For the purpose of this paper, we have expanded the Unified
Radio Catalog to IR wavelengths by cross-correlating it with the
IRAS point-source and faint-source catalogs (hereafter PSC and
FSC, respectively). The IRAS PSC contains 245,889 confirmed
point sources detected at 12, 25, 60 and 100 μm, respectively
(Strauss et al. 1990). The completeness of the catalog at
Figure 1. Distribution of distances between the radio and FIR detections for the
NVSS-IRAS (full black line) and NVSS–SDSS–IRAS (dashed red line) samples.
The cumulative distribution is shown in the inset.
(A color version of this figure is available in the online journal.)
these wavelengths reaches down to 0.4, 0.5, 0.6, and 1.0 Jy,
respectively. The FSC was tuned to fainter levels based on the
same IR data by point-source filtering the individual detector
data streams and then co-adding those using a trimmed-average
algorithm (see Moshir et al. 1992). The reliability of the FSC
is slightly lower than that of the PSC ( 94% compared to
99.997%); however its sensitivity is higher by a factor of ∼2.5.
The FSC contains 173,044 point sources with flux densities
typically greater than 0.2 Jy at 12, 25, and 60 μm and 0.5 Jy at
100 μm.
We used matching radius of 30
, as optimized by Obri
´
cetal.
(2006), in cross-correlating the Unified Radio Catalog with
the IR IRAS data. In Figure 1, we show the distribution of the
distances between the IR and radio detections. The cumulative
distribution displayed in Figure 1 shows that ∼70% of the
positional matches are within an angular distance of 15
.
Our NVSS-selected radio sample contains 18,313 galaxies
with high quality IR photometry
9
(see Table 1). As the FSC and
PSC have been generated based on the same data, most of the
PSC sources are included in the FSC. In our entire NVSS-IRAS
sample, 26% of the sources have a PSC detection but are not
included in the FSC. This fraction, however, reduces to only 3%
after an optical (SDSS) cross-match is performed.
The 60 and 100 μm magnitudes reported in the PSC and
FSC are in agreement for the union of the two IR samples.
The biweighted mean of the flux difference (for a subsample
with SDSS detections) is 0.02 and 0.03 Jy at 60 and 100 μm,
respectively. The root mean scatter of the 60 μm flux difference
distribution is 0.06 Jy, while that of the 100 μm distribution is
significantly larger, i.e., 0.16 Jy. Therefore, in order to access
the highest quality IR photometry, hereafter we use the values
reported in either the FSC or PSC catalog corresponding to
the higher photometric quality flag quoted in the catalogs. The
7
We take the IRAS quality indicator, reported in the FSC and PSC, to be 2
at 60 and 100 μm (the wavelength bands utilized here).

No. 1, 2010 RADIO–FIR CORRELATION 781
Tab le 1
Sample Summary
IRAS (FSC + PSC) SDSS (MAIN + QUASAR) IRAS–SDSS
Total radio sample 18313 9591 524
Quasars ··· 4490 21
Absorption ··· 3072 16
Composite ··· 654 203
SF unambiguous ··· 621 216
SF ambiguous ··· 90
AGN unambiguous ··· 454 43
AGN ambiguous ··· 291 25
Seyfert unambiguous ··· 200 37
LINER unambiguous ··· 254 6
Notes. The first column denotes the number of radio—IRAS (Point Source, PS, and Faint Source, FS) catalog with
high quality IR photometry. The second column shows the number of sources in the radio—SDSS (“main” and
quasar) catalog, and the third column is the matched radio–SDSS (“main” and quasar)–IRAS catalog. The rows
indicate the various galaxy types we separate the objects into. The unambiguous/ambiguous selection is based
on various spectroscopic diagnostic tools (see Figure 5 and the text for details). The shown numbers are limited
to the 0.04 <z<0.3 redshift range.
Figure 2. Distribution of flux density at 20 cm (top panel) and 60 μm (bottom
panel) for various radio-selected samples indicated in the top right of the panels.
(A color version of this figure is available in the online journal.)
distribution of the 60 μm and 20 cm flux densities is shown in
Figure 2.
2.2.2. SDSS Quasar and Main Galaxy Sample Catalogs
We have further matched the NVSS-selected sample from
the Unified Radio Catalog with data drawn from (1) the SDSS
DR5 quasar sample (Schneider et al. 2007), and (2) the DR4
“main” spectroscopic sample for which derivations of emission-
line fluxes from the SDSS spectra are available (see Smol
ˇ
ci
´
c
et al. 2009 and references therein; note that the DR5 quasar and
DR4 main galaxy catalogs were the most up-to-date versions
available at the time). The latter was complemented with stellar
Figure 3. Top panel shows the 1.4 GHz luminosity as a function of redshift
for the NVSS–SDSS galaxies. The bottom panel shows their absolute optical
r-band magnitude (not K-corrected) as a function of redshift.
masses, SFRs, dust attenuations, ages, metallicities, and a
variety of other parameters based on spectral energy distribution
(SED) fitting of the SDSS (ugriz ) photometry using the Bruzual
et al. (2003) stellar population synthesis models. The SED fitting
was performed as described in detail in Smol
ˇ
ci
´
cetal.(2008).
During the inspection of the validity of the final catalog, we
have found about 1% of objects with different spectroscopic
redshifts in various SDSS data releases (Δz>5 × 10
−4
). We
have excluded those from the sample. Furthermore, a small
number (∼0.2%) of duplicate objects was present in both the
SDSS “main” galaxy sample and the SDSS Quasar Catalog.
Visually inspecting their spectra yielded that most of these
objects are better matched to the properties of the “main”
galaxy sample (as no power-law continuum nor broad emission
lines were present in the spectrum), and we have excluded
these from our quasar sample. A summary of the various
radio–IR–optical samples is given in Table 1, and in Figure 3 and
Figure 4 we show the radio (20 cm), optical (r band), and far-IR
luminosities as a function of redshift for the final NVSS–SDSS

782 MORI
´
C ET AL. Vol. 724
Figure 4. Top two panels are the same as Figure 3 but for NVSS–SDSS–IRAS
galaxies. The bottom panel shows the FIR luminosity vs. redshift.
and NVSS–SDSS–IRAS samples (see Equations (3) and (4)).
Note that the shallow IRAS sensitivity (compared to the NVSS
and SDSS data) significantly reduces the number of objects, and
biases the sample toward lower redshifts.
2.3. Radio–Optical–IR Samples
2.3.1. Star-forming and AGN Galaxy Subsamples
We have used the optical spectroscopic information added
to the NVSS selected sample to spectroscopically separate the
galaxies present in the SDSS (DR4) “main” galaxy sample
as absorption line, AGN (LINER/Seyfert), star-forming, or
composite galaxies.
We define emission-line galaxies as those where the rel-
evant emission lines (Hα,Hβ, O[III,λ5007], N[II,λ6584],
S[II,λλ6717,6731]) have been detected at S/N 3, and con-
sider all galaxies with S/N < 3 in any of these lines as ab-
sorption line systems (see e.g., Best et al. 2005; Kewley et al.
2006;Smol
ˇ
ci
´
cetal.2009). As strong emission lines are not
present in the spectra of the latter, yet they are luminous at
20 cm, they can be considered to be (low excitation) AGNs
(see e.g., Best et al. 2005;Smol
ˇ
ci
´
cetal.2008 for a more de-
tailed discussion). Furthermore as illustrated in Figure 5,using
standard optical spectroscopic diagnostics (Baldwin et al. 1981;
Kauffmann et al. 2003; Kewley et al. 2001, 2006) we sort the
emission-line galaxies into (1) star-forming, (2) composite, (3)
Seyfert, and (4) LINER galaxies. The last two classes have been
selected “unambiguously” by requiring combined criteria using
three emission-line flux ratios (see the middle and right panels in
Figure 5). A summary of the number of objects in each class is
given in Table 1. It is noteworthy that the IR detection fraction
is a strong function of spectral class. It is the lowest for absorp-
tion line (0.6%) and LINER (6.5%) galaxies, intermediate for
Seyferts (22%) and the highest for composite (40%) and star-
forming (46%) galaxies. These results suggest lower amounts
of dust (and gas; Solomon & Vanden Bout 2005) in the former
or alternatively dominantly very cold dust that peaks at longer
wavelengths.
The redshift distribution of the various galaxy types with
20 cm NVSS and NVSS-IRAS detections is shown in the two
top panels in Figure 6. Note that the redshift distribution of
20 cm detected absorption line galaxies is biased toward higher
redshifts, compared to all other galaxy types (see the top panel
in Figure 6). However, this is not the case when an IRAS
IR detection is required, as illustrated in the middle panel in
Figure 6. The IR detection fraction of the different galaxy
classes is shown as a function of redshift in the bottom panel
in Figure 6. Except for the overall trend that absorption and
LINER galaxies are detected less efficiently in the IR, there
is no substantial difference between the detection fractions as
a function of redshift for different types of spectroscopically
selected galaxies.
Hereafter, we apply redshift range limits of 0.04 <z<0.3
to our sample. The lower redshift limit is adopted from Kewley
et al. (2005). Kewley et al. explored effects of fixed-size aperture
of the SDSS spectroscopic fibers on the spectral characteristics
such as metallicity, SFR, and reddening. They concluded that
a minimum aperture size covering ≈20% of spectral light was
required to properly approximate global values. The SDSS fiber
aperture of 3
diameter collects such a fraction of light for
galaxies of average size, type, and luminosity at z 0.04.
The upper redshift limit of z = 0.3 is equivalent to that of
the SDSS “main” spectroscopic sample (note however that the
majority of IR-detected galaxies are at z<0.2, see Figure
4). It is worth noting that, because of lower spectral signal
to noise for fixed-luminosity galaxies at greater distances,
galaxies with weak emission lines, such as LINERs, can get
confused with absorption line galaxies at z>0.1(Kewley
et al. 2005). However, as LINER and absorption galaxies have
similar physical properties (e.g., Smol
ˇ
ci
´
cetal.2009), we simply
combine these two types of galaxies, and treat them hereafter as
asingleclass.
2.3.2. Quasar Subsample
Matching the SDSS DR5 quasar catalog to the Unified radio
catalog resulted in 4490 matches (see Table 1). The redshift
range of our radio luminous quasars is 0.09–5.12, with a median
at z = 1.36. Requiring IRAS detections biases the sample toward
low redshifts (0.12 z 1.15), with a median redshift of 0.18,
and selects only ∼0.5% of the radio-detected quasars. The radio
( 10
23
WHz
−1
) and FIR (2 × 10
11
L
) luminosities (see
Equations (3) and (4)) of our quasars are systematically higher
than those of the SDSS “main” spectroscopic sample galaxies
in our radio–optical–IR sample.
3. QUANTIFYING THE RADIO–FIR CORRELATION FOR
VARIOUS SOURCE TYPES
3.1. Parameterizing the Radio–FIR Correlation
The radio–FIR correlation is usually quantified by its slope via
the q parameter (Helou et al. 1985), defined as the logarithmic
ratio of the far-infrared flux to radio flux density:
q = log
F
FIR
/(3.75 × 10
12
Hz)
F
1.4 GHz
, (1)

No. 1, 2010 RADIO–FIR CORRELATION 783
Figure 5. Optical spectroscopic diagnostic diagrams (see Kauffmann et al. 2003; Kewley et al. 2001, 2006) that separate emission-line galaxies into star-forming,
composite galaxies, and various types of AGNs (Seyferts and LINERs). The top panel shows the SDSS–NVSS sample, and the bottom panel the SDSS–NVSS–IRAS
galaxies. Large symbols represent unambiguously identified galaxies (see the text for details). Blue filled squares represent SF galaxies and green dots show composites.
Red open squares and circles represent unambiguous Seyferts and LINERs, respectively.
(A color version of this figure is available in the online journal.)
where F
1.4 GHz
is the 1.4 GHz radio flux density in units of
Wm
−2
Hz
−1
and F
FIR
is the far-infrared flux in units of Wm
−2
.
Following Sanders & Mirabel (1996), we define the latter as
F
FIR
= 1.26 × 10
−14
(2.58S
60 μm
+ S
100 μm
), (2)
where S
60 μm
and S
100 μm
are observed flux densities at 60 and
100 μm (in Jy), respectively.
We compute the far-infrared luminosity as
L
FIR
= 4πD
2
L
CF
FIR
[
L
]
, (3)
where D
L
is the luminosity distance (in units of m) and C is a
scale factor used to correct for the extrapolated flux longward of
the IRAS 100 μm filter. We use C = 1.6 (see Table 1 in Sanders
& Mirabel 1996). Note that this expression can also be utilized
to compute the FIR luminosities for our IR-detected quasars,
given their relatively low redshifts.
The radio luminosity density is computed as
L
1.4 GHz
=
4πD
2
L
(1 + z)
1−α
F
1.4 GHz
, (4)
where z is the redshift of the source, F
1.4 GHz
is its integrated flux
density, and α is the radio spectral index (assuming F
ν
∝ ν
−α
).
To compute the radio luminosities, we assumed a spectral index
of α = 0.7.
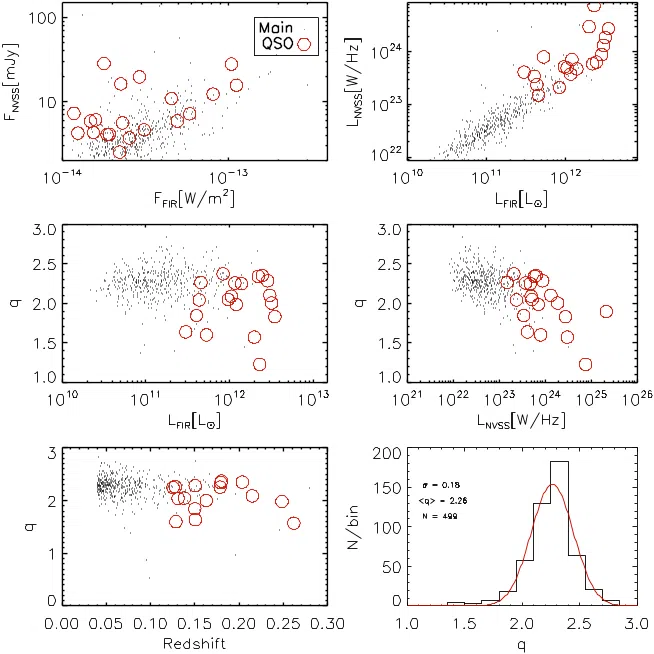
3.2. Radio–FIR Correlation for All Sources
The radio–FIR correlation for the NVSS–SDSS–IRAS sample
is summarized in Figure 7. The radio and FIR flux densities (top
left panel) and luminosities (top right panel) clearly show a
tight correlation that holds over many orders of magnitude. In
the middle panels we show the q parameter, that characterizes
the slope of the radio–FIR correlation (see Equation (1)), as a
function of FIR and radio luminosities. The average q is constant
as a function of FIR luminosity (middle left panel), and it is
decreasing with increasing radio power (middle right panel; see
also below). In the bottom panels of Figure 7, we show the q
parameter as a function of redshift, as well as its distribution for
all our NVSS–SDSS–IRAS sources (galaxies and quasars). We
find that the average (biweighted mean) q-value for the entire
NVSS–SDSS–IRAS sample is q = 2.273 ± 0.008, with a root-
mean-square scatter of σ = 0.18. This is in very good agreement
with previous findings (Condon 1992; Yun et al. 2001; Condon
et al. 2002;Bell2003; Mauch & Sadler 2007), and will be
discussed in more detail in Section 5.