


Q2. What are the characteristics of the evidence?
Shortcomings in the evidence may be any of the following: insufficient duration of trials (or studies); insufficient trials (or studies) available; inadequate sample sizes; or incomplete follow-up.
Q3. What is the evidence for a tentative association between exposure and disease?
The available evidence is based on a substantial number of studies including prospective observational studies and where relevant, randomised controlled trials of sufficient size, duration, and quality showing consistent effects.
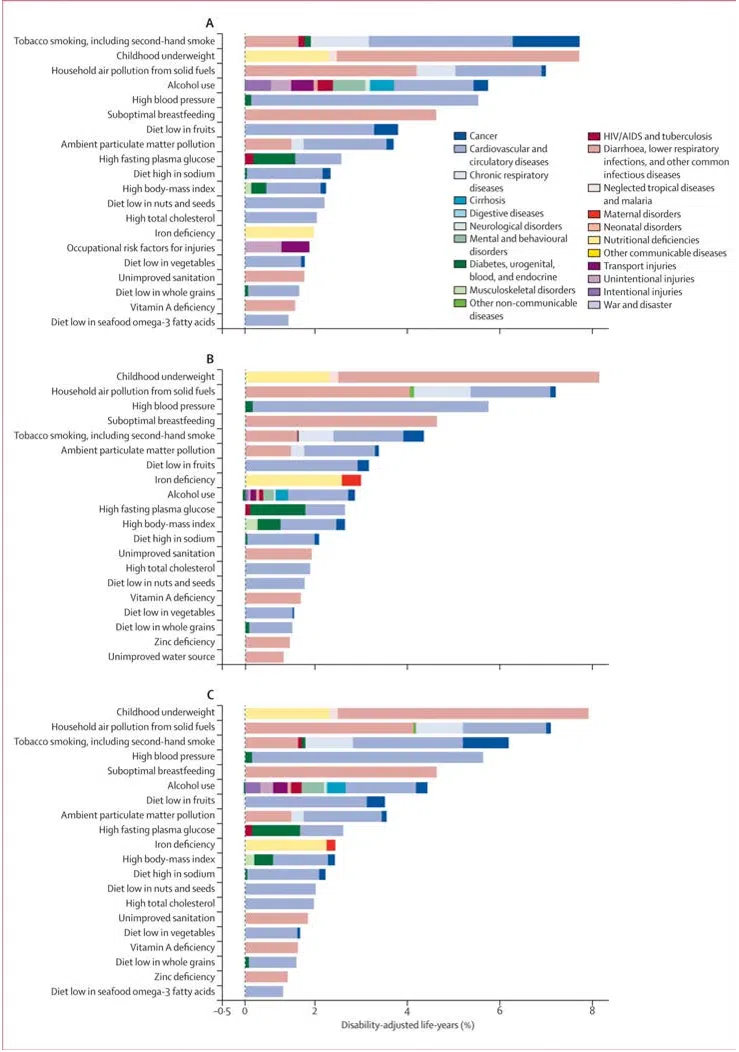
Q4. What is the burden of disease attributable to different risk factors?
In reality, the burden attributable to different risks overlaps because of multicausality and because the effects of some risk factors are partly mediated throughLim et al.