
All figures (11)
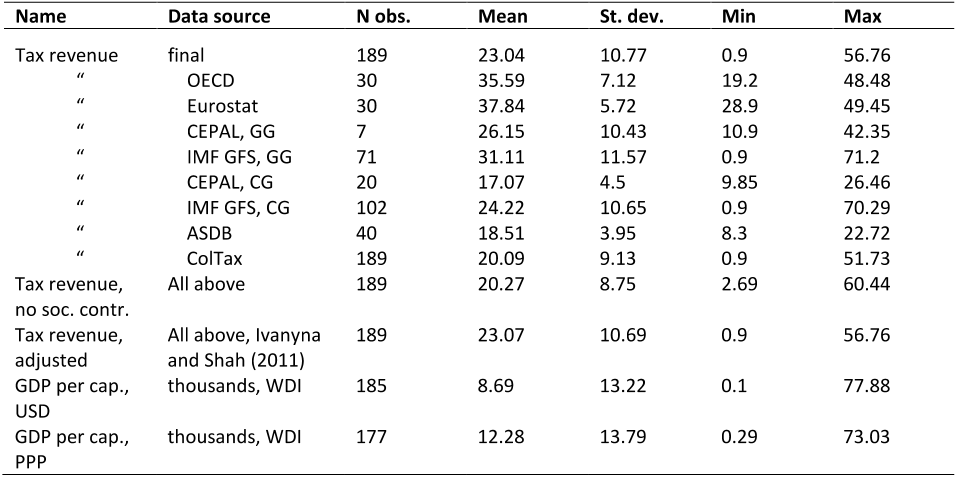
Table 1: Tax ratio and log GDP per capita - descriptive statistics 
Figure 2: Distance from the trend line: regional averages 
Table II: Tax ratio and log GDP per capita – poor vs. rich countries 
Table I: Tax ratio and log GDP per capita – alternative specifications 
Table 5: Tax ratio by country and region – regressions (1990-2008) 
Figure 1: Relation between tax ratio and log GDP per capita 
Table 2: Tax ratio and log GDP per capita – regressions 
Table 4: Tax performance progress matrix: 1997-99 and 2001-03 vs. 2007-08 
Table IV: Low tax performers: Governance, size, special circumstances 
Table III: Tax ratio and log GDP per capita - testing for sample selection 
Table 3: All countries, distance from the trend line


