scispace - formally typeset
Search or ask a question
Journal ArticleDOI

A comparison of multivariate analysis techniques and variable selection strategies in a laser-induced breakdown spectroscopy bacterial classification

TL;DR: The partial least squares discriminant analysis was more effective at distinguishing between highly similar spectra from closely related bacterial genera and may be the preferred multivariate technique in future species-level or strain-level classifications.
About: This article is published in Spectrochimica Acta Part B: Atomic Spectroscopy.The article was published on 2013-09-01 and is currently open access. It has received 38 citations till now. The article focuses on the topics: Discriminant function analysis & Partial least squares regression.

Summary (2 min read)

1. Introduction

  • Since the initial demonstrations of bacterial identification with laser-induced breakdown spectroscopy (LIBS) in 2003, significant progress has been made in the use of multivariate chemometric analyses to classify unknown bacterial LIBS spectra.[1-4].
  • Over the last five years the authors and others have demonstrated a sensitive and specific identification of live bacterial biospecimens utilizing a discriminant function analysis (DFA) to classify LIBS spectra.[5-8].
  • The intensities of strong specific elemental atomic emission lines normalized by the total observed spectral power have been utilized as independent variables in this multivariate analysis. [9].
  • And this is an ongoing area of investigation.
  • Model performance was quantified by calculating truth tables (and the resulting sensitivity and specificity) from the external validation tests.

2.1. Experimental Setup

  • The LIBS apparatus used to obtain the bacterial spectra, as well as their bacterial sample preparation and mounting protocols, have been described at length elsewhere.
  • Five spectra were acquired at each sampling location, thus twenty-five laser pulses were used to obtain this spectrum.
  • The bacteria were chosen to represent a fairly wide taxonomic range.
  • The 32 distinct experiments that were performed yielded the 32 data sets shown in column three of Table 1.
  • No data “outliers” were omitted from their data sets and efforts were made to maximize the number of spectra from any one bacterial deposition rather than to standardize the number of spectra taken.

2.2 Models for Chemometric Analysis (Lines, RM1, and RM2)

  • The three independent variable models that were tested are referred to here as the “lines” model, ratio model one (RM1), and ratio model two (RM2).
  • The lines model was the simplest of the three, having been used in all their previous work.
  • This approach has been utilized with success by Gottfried et al. to discriminate LIBS spectra obtained from explosives residues.
  • The first thirteen variables were merely the intensities of the thirteen strong emission lines used in the lines model (indicated by an asterisk).
  • It was decided that when the dimensionality of the original data was not reduced significantly then the benefits of performing a down-selection were reduced and the more appropriate model would be to use the entire spectrum.

2.3 Chemometric Analysis Techniques

  • Two multivariate chemometric analysis techniques were compared for discrimination between different bacterial genera based on the LIBS emission spectra.
  • This is known as external validation, because each spectrum was tested against a library where no other spectra acquired at the same time or under the same conditions were present.
  • PLS-DA takes a set of independent variables as determined by their models and constructs latent variables to maximize the variance between the two groups.
  • The identity of unknown spectra was then predicted based on this discrimination line in the pre-compiled library.
  • All unknown samples were classified in a PLS-DA test specific for each genus, and if the test group was classified as belonging to the “no group” for each model, it remained unknown and was not classified as belonging to any genus.

3. Results and Discussion

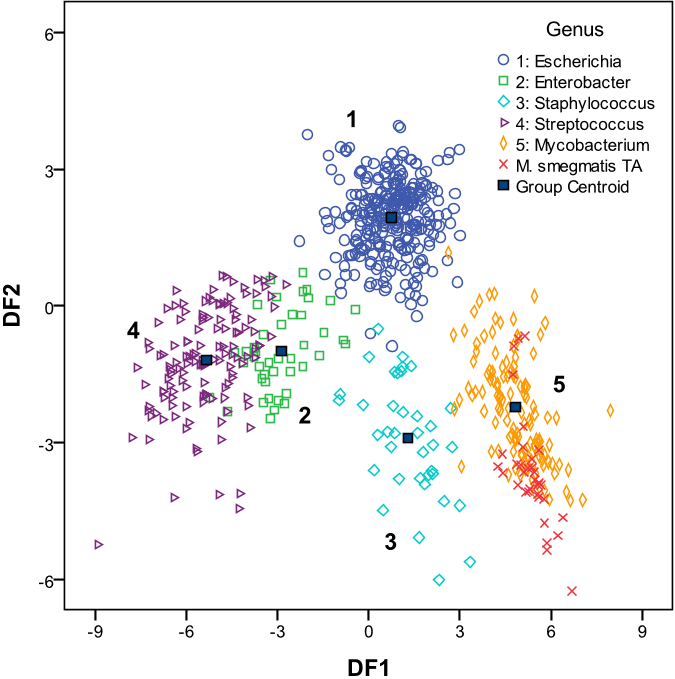
  • In each of the DFA results, four discriminant functions (DF1 through DF4) were constructed to determine the classification of each spectrum.
  • The “unknown” bacterial spectra are represented by the “x” symbols and 34 of 34 unknown spectra were correctly classified as Mycobacterium, even though the model contained no other spectra from strain TA.
  • An investigation of the PLS-DA was conducted to compare the number of LV’s and the corresponding rates of true positives and true negatives.

4. Discussion

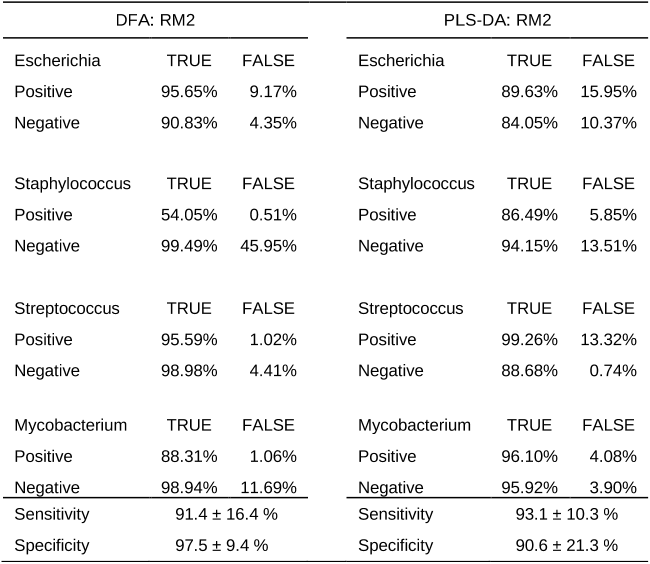
  • A comparison of the DFA performed with the three different models consisting of lines, RM1, and RM2 showed that RM2 yielded the overall highest true positive and true negative rates with true positive rates of 95%, 54%, 95%, and 88% for the four genera and true negative rates of 91%, 99%, 99%, and 99%.
  • The sensitivity and specificity were obtained by averaging the results from the 31 tests and the standard deviation is reported as the uncertainty.
  • This was merely a result of there being only two representative Staphylococci data sets to include in the analysis, as can be seen in Table 1, with one of these data sets being among the earliest experiments performed in the construction of the spectral library.
  • Therefore both analyses can perform both functions, if necessary.
  • It may therefore be true that a DFA is more effective in genus-level discrimination on bacterial specimens with a wide range of potential identities, but discrimination at the species- or strain-level once the genus is accurately identified may require the use of PLS-DA.

5. Conclusion

  • The authors have shown that a sensitive and specific genus level classification of LIBS spectra from live bacterial specimens can be performed with a DFA or a PLS-DA using several different independent variable models.
  • All results were obtained using external-validation tests.
  • The number of latent variables required for efficient classification using this model was investigated, and chosen to be 20 in all subsequent tests.
  • More precise identification at the species-level or strain-level may be subsequently performed with a PLS-DA, which demonstrated improved performance at discriminating highly similar spectra.
  • It is likely 18 that computational processing power would easily allow such a verification, as the classification of one unknown spectrum against a pre-compiled library model is performed rapidly by both techniques.

Did you find this useful? Give us your feedback

Content maybe subject to copyright    Report

Citations
More filters
Book ChapterDOI
TL;DR: An overall view of longitudinal methods in analysis of microbiome and omics data, which cover standard, static, regression-based time series methods, principal trend analysis, and newly developed univariate overdispersed and zero-inflated as well as multivariate distance/kernel-based longitudinal models are provided.
Abstract: Correlation and association analyses are one of the most widely used statistical methods in research fields, including microbiome and integrative multiomics studies. Correlation and association have two implications: dependence and co-occurrence. Microbiome data are structured as phylogenetic tree and have several unique characteristics, including high dimensionality, compositionality, sparsity with excess zeros, and heterogeneity. These unique characteristics cause several statistical issues when analyzing microbiome data and integrating multiomics data, such as large p and small n, dependency, overdispersion, and zero-inflation. In microbiome research, on the one hand, classic correlation and association methods are still applied in real studies and used for the development of new methods; on the other hand, new methods have been developed to target statistical issues arising from unique characteristics of microbiome data. Here, we first provide a comprehensive view of classic and newly developed univariate correlation and association-based methods. We discuss the appropriateness and limitations of using classic methods and demonstrate how the newly developed methods mitigate the issues of microbiome data. Second, we emphasize that concepts of correlation and association analyses have been shifted by introducing network analysis, microbe-metabolite interactions, functional analysis, etc. Third, we introduce multivariate correlation and association-based methods, which are organized by the categories of exploratory, interpretive, and discriminatory analyses and classification methods. Fourth, we focus on the hypothesis testing of univariate and multivariate regression-based association methods, including alpha and beta diversities-based, count-based, and relative abundance (or compositional)-based association analyses. We demonstrate the characteristics and limitations of each approaches. Fifth, we introduce two specific microbiome-based methods: phylogenetic tree-based association analysis and testing for survival outcomes. Sixth, we provide an overall view of longitudinal methods in analysis of microbiome and omics data, which cover standard, static, regression-based time series methods, principal trend analysis, and newly developed univariate overdispersed and zero-inflated as well as multivariate distance/kernel-based longitudinal models. Finally, we comment on current association analysis and future direction of association analysis in microbiome and multiomics studies.

87 citations

Journal ArticleDOI
TL;DR: In this article, the authors reviewed the research progress of chemometrics methods in LIBS for spectral data preprocessing as well as for qualitative and quantitative analyses in the most recent 5 years (2012•2016).
Abstract: Laser‐induced breakdown spectroscopy (LIBS) is a new type of elemental analytical technology with the advantages of real‐time, online, and noncontact as well as enabling the simultaneous analysis of multiple elements. It has become a frontier analytical technique in spectral analysis. However, the issue of how to improve the accuracy of qualitative and quantitative analyses by extracting useful information from a large amount of complex LIBS data remains the main problem for the LIBS technique. Chemometrics is a chemical subdiscipline of multi‐interdisciplinary methods; it offers advantages in data processing, signal analysis, and pattern recognition. It can solve some complicated problems that are difficult for traditional chemical methods. In this paper, we reviewed the research progress of chemometrics methods in LIBS for spectral data preprocessing as well as for qualitative and quantitative analyses in the most recent 5 years (2012‐2016).

80 citations


Cites methods from "A comparison of multivariate analys..."

  • ...The 3 models based on sums, ratios, and complex ratios of measured atomic emission‐line intensities were constructed by down‐selected– independent variables, and PLS‐DA was effective at distinguishing between highly similar spectra from closely related bacterial genera.(47) The PLS‐DA was used to investigate the possibility of discriminating healthy and carious tooth tissues based on atomic and ionic emission lines in the LIBS spectra of teeth; it showed excellent discrimination and prediction of unknown tooth tissues....

    [...]

Journal ArticleDOI
TL;DR: These emerging spectroscopic and spectral imaging techniques have the potential to provide rapid and nondestructive detection of microorganisms and should also provide complementary information to enhance the performance of conventional methods to prevent disease outbreaks and food safety problems.
Abstract: Microorganism contamination and foodborne disease outbreaks are of public concern worldwide. As such, the food industry requires rapid and nondestructive methods to detect microorganisms and to control food quality. However, conventional methods such as culture and colony counting, polymerase chain reaction, and immunoassay approaches are laborious, time-consuming and require trained personnel. Therefore, the emergence of rapid analytical methods is essential. This review introduces 6 spectroscopic and spectral imaging techniques that apply infrared spectroscopy, surface-enhanced Raman spectroscopy, terahertz time-domain spectroscopy, laser-induced breakdown spectroscopy, hyperspectral imaging, and multispectral imaging for microorganism detection. Recent advances of these technologies from 2011 to 2017 are outlined. Challenges in the application of these technologies for microorganism detection in food matrices are addressed. These emerging spectroscopic and spectral imaging techniques have the potential to provide rapid and nondestructive detection of microorganisms. They should also provide complementary information to enhance the performance of conventional methods to prevent disease outbreaks and food safety problems.

72 citations

Journal ArticleDOI
TL;DR: In this article, the authors reviewed the research progress of chemometrics methods in LIBS from the spectral data pre-processing, qualitative and quantitative analysis in recent years, which has the advantages in date processing, signal analysis and pattern recognition.

56 citations

Journal ArticleDOI
TL;DR: It is proposed that the bactericidal mechanism of GO is likely to be the synergy between membrane and oxidative stress towards both tested species, and offer useful guidelines for the future development of GO-based antibacterial surfaces and coatings.
Abstract: While the cytotoxicity of graphene oxide (GO) has been well established, its bactericidal mechanism, however, has yet to be elucidated to advance GO-based biomedical and environmental applications. In an attempt to better understand the bactericidal action of GO, herein we studied the interactions of GO with Gram-negative Escherichia coli and Gram-positive Staphylococcus aureus cells using physical techniques and chemical probes, respectively. In particular, a novel laser-induced breakdown spectroscopy (LIBS) based elemental fingerprint analysis revealed notable differences between viable and non-viable cells based on the difference in the concentration of trace inorganic elements in complex bacterial systems, which reflect cellular membrane integrity. Lower emission intensities from essential inorganic ions in the GO-treated cells offered explicit evidence on the efflux of intracellular molecules from the bacteria through damaged cell membranes. Furthermore, a detailed structural and morphological investigation of bacterial membrane integrity confirmed GO-induced membrane stress upon direct contact interactions with bacterial cells, resulting in the disruption of cellular membranes. Moreover, the generation of intracellular reactive oxygen species (ROS) in the presence of an added antioxidant underlined the role of GO-mediated oxidative stress in bacterial cell inactivation. Thus, by correlating the changes in the bacterial elemental compositions with the severe morphological alterations and the high ROS production witnessed herein, we propose that the bactericidal mechanism of GO is likely to be the synergy between membrane and oxidative stress towards both tested species. Our findings offer useful guidelines for the future development of GO-based antibacterial surfaces and coatings.

52 citations

References
More filters
Journal ArticleDOI
01 Jan 1973
TL;DR: In this paper, a six-step framework for organizing and discussing multivariate data analysis techniques with flowcharts for each is presented, focusing on the use of each technique, rather than its mathematical derivation.
Abstract: Offers an applications-oriented approach to multivariate data analysis, focusing on the use of each technique, rather than its mathematical derivation. The text introduces a six-step framework for organizing and discussing techniques with flowcharts for each. Well-suited for the non-statistician, this applications-oriented introduction to multivariate analysis focuses on the fundamental concepts that affect the use of specific techniques rather than the mathematical derivation of the technique. Provides an overview of several techniques and approaches that are available to analysts today - e.g., data warehousing and data mining, neural networks and resampling/bootstrapping. Chapters are organized to provide a practical, logical progression of the phases of analysis and to group similar types of techniques applicable to most situations. Table of Contents 1. Introduction. I. PREPARING FOR A MULTIVARIATE ANALYSIS. 2. Examining Your Data. 3. Factor Analysis. II. DEPENDENCE TECHNIQUES. 4. Multiple Regression. 5. Multiple Discriminant Analysis and Logistic Regression. 6. Multivariate Analysis of Variance. 7. Conjoint Analysis. 8. Canonical Correlation Analysis. III. INTERDEPENDENCE TECHNIQUES. 9. Cluster Analysis. 10. Multidimensional Scaling. IV. ADVANCED AND EMERGING TECHNIQUES. 11. Structural Equation Modeling. 12. Emerging Techniques in Multivariate Analysis. Appendix A: Applications of Multivariate Data Analysis. Index.

37,124 citations

01 Jan 2009

10,876 citations


"A comparison of multivariate analys..." refers methods in this paper

  • ...DFA is a multivariate analysis technique that uses independent variables (atomic emission intensities) to calculate a dependant variable (bacterial identity) to classify or discriminate between two or more groups [21]....

    [...]

Book
01 Oct 2010
TL;DR: Partial least squares (PLS) was not originally designed as a tool for statistical discrimination as discussed by the authors, but applied scientists routinely use PLS for classification and there is substantial empirical evidence to suggest that it performs well in that role.
Abstract: Partial least squares (PLS) was not originally designed as a tool for statistical discrimination. In spite of this, applied scientists routinely use PLS for classification and there is substantial empirical evidence to suggest that it performs well in that role. The interesting question is: why can a procedure that is principally designed for overdetermined regression problems locate and emphasize group structure? Using PLS in this manner has heurestic support owing to the relationship between PLS and canonical correlation analysis (CCA) and the relationship, in turn, between CCA and linear discriminant analysis (LDA). This paper replaces the heuristics with a formal statistical explanation. As a consequence, it will become clear that PLS is to be preferred over PCA when discrimination is the goal and dimension reduction is needed. Copyright © 2003 John Wiley & Sons, Ltd.

2,067 citations


"A comparison of multivariate analys..." refers background in this paper

  • ...The PLS-DA then calculates a discrimination line (or this can be user-determined) to predict the class of each spectrum based on Bayesian statistics by minimizing the number of false positives and negatives [22]....

    [...]

Journal ArticleDOI
TL;DR: This review discusses the application of laser-induced breakdown spectroscopy (LIBS) to the problem of explosive residue detection and demonstrates the tremendous potential of LIBS for real-time detection of explosives residues at standoff distances.
Abstract: In this review we discuss the application of laser-induced breakdown spectroscopy (LIBS) to the problem of detection of residues of explosives. Research in this area presented in open literature is reviewed. Both laboratory and field-tested standoff LIBS instruments have been used to detect explosive materials. Recent advances in instrumentation and data analysis techniques are discussed, including the use of double-pulse LIBS to reduce air entrainment in the analytical plasma and the application of advanced chemometric techniques such as partial least-squares discriminant analysis to discriminate between residues of explosives and non-explosives on various surfaces. A number of challenges associated with detection of explosives residues using LIBS have been identified, along with their possible solutions. Several groups have investigated methods for improving the sensitivity and selectivity of LIBS for detection of explosives, including the use of femtosecond-pulse lasers, supplemental enhancement of the laser-induced plasma emission, and complementary orthogonal techniques. Despite the associated challenges, researchers have demonstrated the tremendous potential of LIBS for real-time detection of explosives residues at standoff distances.

290 citations

Journal ArticleDOI
TL;DR: LIBS data from the individual laser shots were analyzed by principal-components analysis and were found to contain adequate information to afford discrimination among the different biomaterials.
Abstract: Laser-induced breakdown spectroscopy (LIBS) has been used to study bacterial spores, molds, pollens, and proteins. Biosamples were prepared and deposited onto porous silver substrates. LIBS data from the individual laser shots were analyzed by principal-components analysis and were found to contain adequate information to afford discrimination among the different biomaterials. Additional discrimination within the three bacilli studied appears feasible.

217 citations

Frequently Asked Questions (2)
Q1. What are the contributions in "A comparison of multivariate analysis techniques and variable selection strategies in a laser-induced breakdown spectroscopy bacterial classification" ?

In this paper, the authors compared the use of three different down-selected variable models consisting of emission intensities, the sum of observed ∼4 intensities from the elements P, Ca, Mg, Na, C, and complex ratios of those intensities. 

Such a confirmation will need to be investigated in future work.