scispace - formally typeset
Search or ask a question
Journal ArticleDOI

A comparison of multivariate analysis techniques and variable selection strategies in a laser-induced breakdown spectroscopy bacterial classification

TL;DR: The partial least squares discriminant analysis was more effective at distinguishing between highly similar spectra from closely related bacterial genera and may be the preferred multivariate technique in future species-level or strain-level classifications.
About: This article is published in Spectrochimica Acta Part B: Atomic Spectroscopy.The article was published on 2013-09-01 and is currently open access. It has received 38 citations till now. The article focuses on the topics: Discriminant function analysis & Partial least squares regression.

Summary (2 min read)

1. Introduction

  • Since the initial demonstrations of bacterial identification with laser-induced breakdown spectroscopy (LIBS) in 2003, significant progress has been made in the use of multivariate chemometric analyses to classify unknown bacterial LIBS spectra.[1-4].
  • Over the last five years the authors and others have demonstrated a sensitive and specific identification of live bacterial biospecimens utilizing a discriminant function analysis (DFA) to classify LIBS spectra.[5-8].
  • The intensities of strong specific elemental atomic emission lines normalized by the total observed spectral power have been utilized as independent variables in this multivariate analysis. [9].
  • And this is an ongoing area of investigation.
  • Model performance was quantified by calculating truth tables (and the resulting sensitivity and specificity) from the external validation tests.

2.1. Experimental Setup

  • The LIBS apparatus used to obtain the bacterial spectra, as well as their bacterial sample preparation and mounting protocols, have been described at length elsewhere.
  • Five spectra were acquired at each sampling location, thus twenty-five laser pulses were used to obtain this spectrum.
  • The bacteria were chosen to represent a fairly wide taxonomic range.
  • The 32 distinct experiments that were performed yielded the 32 data sets shown in column three of Table 1.
  • No data “outliers” were omitted from their data sets and efforts were made to maximize the number of spectra from any one bacterial deposition rather than to standardize the number of spectra taken.

2.2 Models for Chemometric Analysis (Lines, RM1, and RM2)

  • The three independent variable models that were tested are referred to here as the “lines” model, ratio model one (RM1), and ratio model two (RM2).
  • The lines model was the simplest of the three, having been used in all their previous work.
  • This approach has been utilized with success by Gottfried et al. to discriminate LIBS spectra obtained from explosives residues.
  • The first thirteen variables were merely the intensities of the thirteen strong emission lines used in the lines model (indicated by an asterisk).
  • It was decided that when the dimensionality of the original data was not reduced significantly then the benefits of performing a down-selection were reduced and the more appropriate model would be to use the entire spectrum.

2.3 Chemometric Analysis Techniques

  • Two multivariate chemometric analysis techniques were compared for discrimination between different bacterial genera based on the LIBS emission spectra.
  • This is known as external validation, because each spectrum was tested against a library where no other spectra acquired at the same time or under the same conditions were present.
  • PLS-DA takes a set of independent variables as determined by their models and constructs latent variables to maximize the variance between the two groups.
  • The identity of unknown spectra was then predicted based on this discrimination line in the pre-compiled library.
  • All unknown samples were classified in a PLS-DA test specific for each genus, and if the test group was classified as belonging to the “no group” for each model, it remained unknown and was not classified as belonging to any genus.

3. Results and Discussion

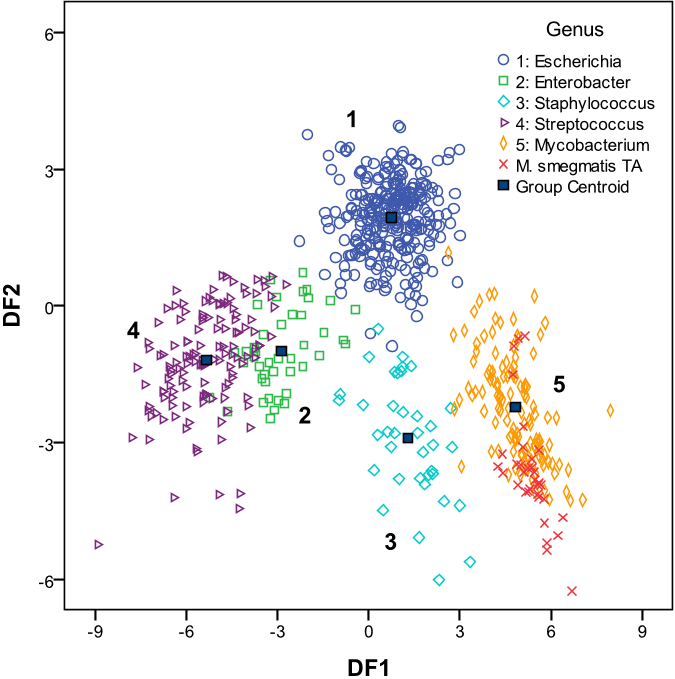
  • In each of the DFA results, four discriminant functions (DF1 through DF4) were constructed to determine the classification of each spectrum.
  • The “unknown” bacterial spectra are represented by the “x” symbols and 34 of 34 unknown spectra were correctly classified as Mycobacterium, even though the model contained no other spectra from strain TA.
  • An investigation of the PLS-DA was conducted to compare the number of LV’s and the corresponding rates of true positives and true negatives.

4. Discussion

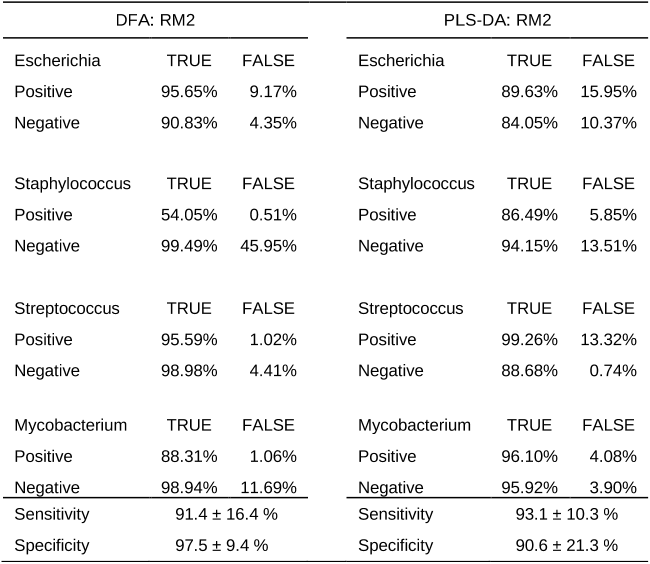
  • A comparison of the DFA performed with the three different models consisting of lines, RM1, and RM2 showed that RM2 yielded the overall highest true positive and true negative rates with true positive rates of 95%, 54%, 95%, and 88% for the four genera and true negative rates of 91%, 99%, 99%, and 99%.
  • The sensitivity and specificity were obtained by averaging the results from the 31 tests and the standard deviation is reported as the uncertainty.
  • This was merely a result of there being only two representative Staphylococci data sets to include in the analysis, as can be seen in Table 1, with one of these data sets being among the earliest experiments performed in the construction of the spectral library.
  • Therefore both analyses can perform both functions, if necessary.
  • It may therefore be true that a DFA is more effective in genus-level discrimination on bacterial specimens with a wide range of potential identities, but discrimination at the species- or strain-level once the genus is accurately identified may require the use of PLS-DA.

5. Conclusion

  • The authors have shown that a sensitive and specific genus level classification of LIBS spectra from live bacterial specimens can be performed with a DFA or a PLS-DA using several different independent variable models.
  • All results were obtained using external-validation tests.
  • The number of latent variables required for efficient classification using this model was investigated, and chosen to be 20 in all subsequent tests.
  • More precise identification at the species-level or strain-level may be subsequently performed with a PLS-DA, which demonstrated improved performance at discriminating highly similar spectra.
  • It is likely 18 that computational processing power would easily allow such a verification, as the classification of one unknown spectrum against a pre-compiled library model is performed rapidly by both techniques.

Did you find this useful? Give us your feedback

Content maybe subject to copyright    Report

Citations
More filters
Book ChapterDOI
01 Jan 2017
TL;DR: In this paper, LiBS technique was used to obtain spectra of Escherichia coli and Staphylococcus aureus for identifying characteristic emission lines and then they were analyzed by K-means classifier for neural network feasibility.
Abstract: LIBS technique was used to obtain spectra of Escherichia coli and Staphylococcus aureus for identifying characteristic emission lines and then they were analyzed by K-means classifier for neural network feasibility. The potential of this method for bacteria identification was demonstrated.

4 citations

Journal ArticleDOI
TL;DR: In this paper, the results were processed by a principle component analysis (PCA) and a deep neural network to improve the separation efficiency of metals from RAM samples of a printed circuit board (PCB).
Abstract: In this study, we collected spectral data using laser induced breakdown spectrometry. Our results were processed by a principle component analysis (PCA) and a deep neural network to improve the separation efficiency of metals from RAM samples of a printed circuit board (PCB). The spectra were collected from 294 spots on the sample surface and subsequently divided into three groups, i.e., Black (K), Yellow (Y), and Green (G) by visual inspection of the surface color. We identified the specific wavelengths that were usable as separation criteria as well as the main elemental composition of each part by comparing the PCA and scanning electron microscopy-electron dispersive spectroscopy results. We also confirmed the possibility of automatic separation with a deep neural network whose separation accuracy was more than 98%. Our results can be used to create a new automatic separation process for waste electronic electrical equipment.

3 citations


Additional excerpts

  • ...이러한 데이터에서 유용한 정보를 유도 하는 것은 쉽지 않기 때문에 많은 연구에서 LIBS 데이터를 해석하기 위해 다변량 통계분석(multivariate statistical analysis)을 적용하고 있다(Martin et al., 2005; Clegg et al., 2009; Gaudiuso et al., 2010; Putnam et al., 2013; Awasthi et al., 2017)....

    [...]

Book ChapterDOI
01 Jan 2017
TL;DR: Special focus is given to the high discriminatory potential of MALDI-TOF MS fingerprinting as a bacterial typing tool, providing maximal information to better understand epidemics and confront foodborne disease outbreaks.
Abstract: A DNA fingerprint refers to a specific DNA profile of an individual. In the last few decades, spectroscopic and spectrometric techniques have emerged as competent fingerprinting tools, representing spectral profiles that give information on the specific composition of the target analyzed. Matrix-assisted laser desorption/ionization time-of-flight mass spectrometry (MALDI-TOF MS), vibrational spectroscopy (FT-IR, Raman, surface-enhanced Raman spectroscopy (SERS)), and laser-induced breakdown spectroscopy (LIBS) have been successfully applied to detect food contaminants by molecular fingerprinting. Food contaminants may be of microbial or chemical origin. Most fingerprinting approaches are targeted at the differentiation of individuals, this being of special interest for the discrimination and identification of microbial foodborne pathogens, as well as for food authenticity purposes. The first part of this chapter describes the use of MALDI-TOF MS for foodborne pathogen detection, emphasizing the applicability for routine microbiological analysis and risk assessment in the food sector. Special focus is given to the high discriminatory potential of MALDI-TOF MS fingerprinting as a bacterial typing tool, providing maximal information to better understand epidemics and confront foodborne disease outbreaks. The second part gives an overview of recent applications of FT-IR, SERS, and LIBS fingerprinting for the detection of food contaminants, including both bacterial pathogens as well as further contaminants such as mycotoxins, pesticides, heavy metals, and melamine. Finally, perspectives and future trends of the described molecular fingerprinting techniques for food safety assessment are discussed.

2 citations

Journal ArticleDOI
TL;DR: In this paper, the quality assessment of isogams is demonstrated by laser-induced breakdown spectroscopy (LIBS) using the comparative standardization method, where the mass concentrations of carbon and hydrogen, as basic elements of tar, relative to that of calcium, as an undesired element, are taken into account as principal parameters to determine the quality.
Abstract: In this paper, the quality assessment of isogams is demonstrated by laser-induced breakdown spectroscopy (LIBS) using the comparative standardization method. Here, the mass concentrations of carbon and hydrogen, as basic elements of tar, relative to that of calcium, as an undesired element, are taken into account as principal parameters to determine the quality of isogams. Hence, the intensity ratios of $${H}_{\alpha }$$ line of hydrogen (656.28 nm), the (0, 0) band of CN (388.34 nm), and the (0, 0) band of C2 (516.52 nm) to the line intensity of once-ionized calcium (317.93 nm) are considered as determinant markers for five different pre-known isogam brands. Qualitatively, classification of the isogams based on this approach is in full agreement with that obtained from the results of Fourier-transform infrared (FTIR) spectroscopy. In FTIR spectra, two stronger transitions of 2849 cm−1 and 2917 cm−1 related to the symmetric and asymmetric stretching vibrations of C–H play the principal role in the analysis of samples. Furthermore, the results obtained from energy-dispersive X-ray (EDX) analysis quantitatively confirm the LIBS outcomes. And finally, to reveal the differences between isogams from various aspects, the linear discriminant analysis (LDA) is exploited as a statistical approach.

2 citations

01 Jan 2017
TL;DR: In this article, the authors evaluate the suitability of LIBS for identifying and discriminating biologic entities in the area of biomedicina, a partir of the cambios in its composicion atomica.
Abstract: En esta tesis se ha estudiado el enfoque cualitativo de la tecnica LIBS en el area de la biomedicina, explorando su potencial para identificar y discriminar muestras biologicas, a partir de los cambios en su composicion atomica. La motivacion de estos estudios fue evaluar la capacidad de LIBS para proporcionar una identificacion rapida en comparacion con los metodos bioanaliticos tradicionales, aprovechando la posibilidad de combinarlo con los metodos quimiometricos para aumentar el rendimiento de la tecnica y demostrar su potencial de uso como un metodo diagnostico en el ambito clinico. Con el fin de desarrollar los modelos de clasificacion, se emplearon diferentes enfoques de los metodos quimiometricos y se compararon para encontrar el mejor enfoque y dar solucion a este problema. Una parte integral es el desarrollo de modelos de clasificacion utilizando los algoritmos de Red Neural Artificial (NN) como la herramienta quimiometrica para el analisis de datos espectrales LIBS en la identificacion y discriminacion de materiales biologicos moleculares complejos como bacterias y hongos. La seleccion de la NN fue fomentada por un estudio en el que la comparacion entre varios metodos quimiometricos, incluyendo Analisis Discriminante Lineal (LDA), Maquinas de Soporte Vectorial (SVM), Modelado Suave Independiente de Analogia de Clase (SIMCA), Analisis Discrecional de minimos cuadrados parciales (PLSDA) y Redes Neuronales Artificiales (NN), demostro el mejor desempeno de la NN en la clasificacion de cepas bacterianas. Hay una multitud de tecnicas que se emplean para identificar los patogenos bacterianos y fungicos presentes en una muestra biologica que causa enfermedades infecciosas. Todas estas tecnicas ofrecen varias ventajas y proporcionan buenos resultados, pero en muchos casos los factores como el tiempo y el coste del analisis son limitados. Por lo tanto, en esta tesis se pretendio desarrollar una metodologia basada en la combinacion LIBS con NN para realizar la identificacion y discriminacion de estos patogenos en la identificacion y discriminacion de bacterias y hongos en muestras biologicas; con especial referencia a la mejora de los estandares de seguridad hospitalaria, particularmente desde el punto de vista microbiologico, mediante el diagnostico precoz de las infecciones adquiridas en el hospital (HAI). La tesis se divide principalmente en tres partes: Introduccion a los fundamentos de las tecnicas utilizadas, procedimiento Experimental y Resultados. La primera parte se centra en la introduccion al objetivo principal de esta tesis. El capitulo 1 da una vision teorica de la tecnica incluyendo los fundamentos de la tecnica LIBS, los antecedentes del analisis basado en LIBS de microorganismos y los avances realizados en esta tecnica para sus aplicaciones medicas. El capitulo 2 incluye una introduccion general a la quimiometria y las figuras de merito que se necesitan tener en cuenta para la evaluacion del desempeno de los metodos quimiometricos en clasificacion. La segunda parte que compone el capitulo 3 describe la configuracion experimental utilizada para las mediciones LIBS y los componentes del sistema experimental desarrollado en el laboratorio. La tercera parte incluye los resultados experimentales donde el capitulo 4 trata sobre la metodologia desarrollada de LIBS y NN para la identificacion y discriminacion de muestras bacterianas. La metodologia se extendio a cepas bacterianas resistentes a antibioticos, que forma la segunda subseccion. Tambien se realizo una comparacion entre diferentes metodos quimiometricos, formando la ultima parte de este capitulo. El capitulo 5 presenta el analisis de muestras de hongos (Candida) por LIBS, su caracterizacion por SEM con EDS, y aplicando la metodologia LIBS y NN para su discriminacion. Finalmente, la ultima parte, el capitulo 6 discute las conclusiones del trabajo y los desafios que enfrentan en este campo.

2 citations

References
More filters
Journal ArticleDOI
01 Jan 1973
TL;DR: In this paper, a six-step framework for organizing and discussing multivariate data analysis techniques with flowcharts for each is presented, focusing on the use of each technique, rather than its mathematical derivation.
Abstract: Offers an applications-oriented approach to multivariate data analysis, focusing on the use of each technique, rather than its mathematical derivation. The text introduces a six-step framework for organizing and discussing techniques with flowcharts for each. Well-suited for the non-statistician, this applications-oriented introduction to multivariate analysis focuses on the fundamental concepts that affect the use of specific techniques rather than the mathematical derivation of the technique. Provides an overview of several techniques and approaches that are available to analysts today - e.g., data warehousing and data mining, neural networks and resampling/bootstrapping. Chapters are organized to provide a practical, logical progression of the phases of analysis and to group similar types of techniques applicable to most situations. Table of Contents 1. Introduction. I. PREPARING FOR A MULTIVARIATE ANALYSIS. 2. Examining Your Data. 3. Factor Analysis. II. DEPENDENCE TECHNIQUES. 4. Multiple Regression. 5. Multiple Discriminant Analysis and Logistic Regression. 6. Multivariate Analysis of Variance. 7. Conjoint Analysis. 8. Canonical Correlation Analysis. III. INTERDEPENDENCE TECHNIQUES. 9. Cluster Analysis. 10. Multidimensional Scaling. IV. ADVANCED AND EMERGING TECHNIQUES. 11. Structural Equation Modeling. 12. Emerging Techniques in Multivariate Analysis. Appendix A: Applications of Multivariate Data Analysis. Index.

37,124 citations

01 Jan 2009

10,876 citations


"A comparison of multivariate analys..." refers methods in this paper

  • ...DFA is a multivariate analysis technique that uses independent variables (atomic emission intensities) to calculate a dependant variable (bacterial identity) to classify or discriminate between two or more groups [21]....

    [...]

Book
01 Oct 2010
TL;DR: Partial least squares (PLS) was not originally designed as a tool for statistical discrimination as discussed by the authors, but applied scientists routinely use PLS for classification and there is substantial empirical evidence to suggest that it performs well in that role.
Abstract: Partial least squares (PLS) was not originally designed as a tool for statistical discrimination. In spite of this, applied scientists routinely use PLS for classification and there is substantial empirical evidence to suggest that it performs well in that role. The interesting question is: why can a procedure that is principally designed for overdetermined regression problems locate and emphasize group structure? Using PLS in this manner has heurestic support owing to the relationship between PLS and canonical correlation analysis (CCA) and the relationship, in turn, between CCA and linear discriminant analysis (LDA). This paper replaces the heuristics with a formal statistical explanation. As a consequence, it will become clear that PLS is to be preferred over PCA when discrimination is the goal and dimension reduction is needed. Copyright © 2003 John Wiley & Sons, Ltd.

2,067 citations


"A comparison of multivariate analys..." refers background in this paper

  • ...The PLS-DA then calculates a discrimination line (or this can be user-determined) to predict the class of each spectrum based on Bayesian statistics by minimizing the number of false positives and negatives [22]....

    [...]

Journal ArticleDOI
TL;DR: This review discusses the application of laser-induced breakdown spectroscopy (LIBS) to the problem of explosive residue detection and demonstrates the tremendous potential of LIBS for real-time detection of explosives residues at standoff distances.
Abstract: In this review we discuss the application of laser-induced breakdown spectroscopy (LIBS) to the problem of detection of residues of explosives. Research in this area presented in open literature is reviewed. Both laboratory and field-tested standoff LIBS instruments have been used to detect explosive materials. Recent advances in instrumentation and data analysis techniques are discussed, including the use of double-pulse LIBS to reduce air entrainment in the analytical plasma and the application of advanced chemometric techniques such as partial least-squares discriminant analysis to discriminate between residues of explosives and non-explosives on various surfaces. A number of challenges associated with detection of explosives residues using LIBS have been identified, along with their possible solutions. Several groups have investigated methods for improving the sensitivity and selectivity of LIBS for detection of explosives, including the use of femtosecond-pulse lasers, supplemental enhancement of the laser-induced plasma emission, and complementary orthogonal techniques. Despite the associated challenges, researchers have demonstrated the tremendous potential of LIBS for real-time detection of explosives residues at standoff distances.

290 citations

Journal ArticleDOI
TL;DR: LIBS data from the individual laser shots were analyzed by principal-components analysis and were found to contain adequate information to afford discrimination among the different biomaterials.
Abstract: Laser-induced breakdown spectroscopy (LIBS) has been used to study bacterial spores, molds, pollens, and proteins. Biosamples were prepared and deposited onto porous silver substrates. LIBS data from the individual laser shots were analyzed by principal-components analysis and were found to contain adequate information to afford discrimination among the different biomaterials. Additional discrimination within the three bacilli studied appears feasible.

217 citations

Frequently Asked Questions (2)
Q1. What are the contributions in "A comparison of multivariate analysis techniques and variable selection strategies in a laser-induced breakdown spectroscopy bacterial classification" ?

In this paper, the authors compared the use of three different down-selected variable models consisting of emission intensities, the sum of observed ∼4 intensities from the elements P, Ca, Mg, Na, C, and complex ratios of those intensities. 

Such a confirmation will need to be investigated in future work.