
All figures (11)
 Figure 4a. Block-diagram of the ring vortex flow phantom, illustrating vortex propagation at velocity Vtrans
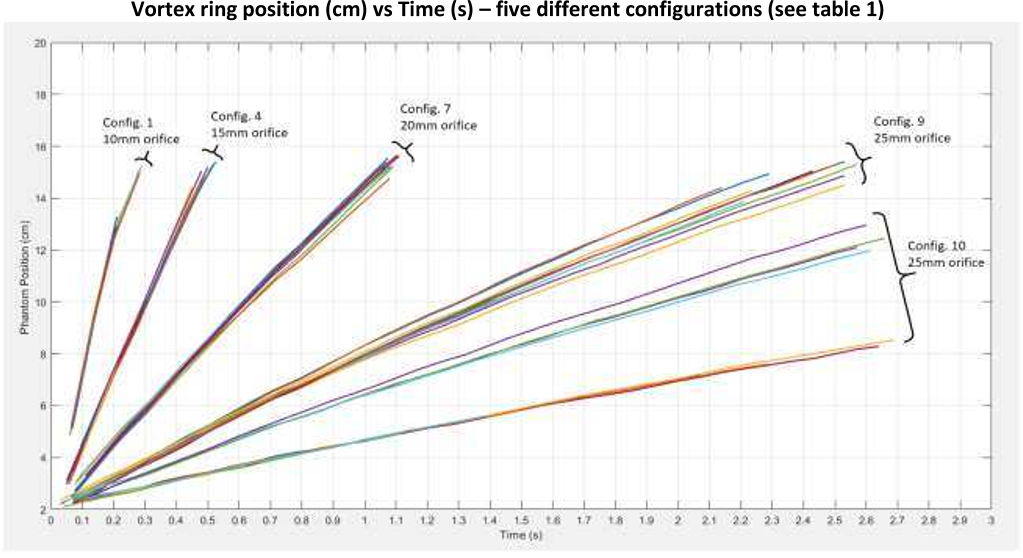 Figure 8: This plot present data for configurations 1, 4, 7, 9, 10 (table 1). The dispersion in ring speed is apparent from this representative collection of experimental runs illustrating ring position vs time. Ring velocity can be determined from line gradient, and variability <10% for each group (except for the 25mm orifice example). Notably, the rings of lower energy and speed are more variable. With a 2.5cm diameter orifice, and lower pump speeds, the ring might not even form.
 Figure 4a. Block-diagram of the ring vortex flow phantom, illustrating vortex propagation at velocity Vtrans
 Figure 5. Assembled ring vortex flow phantom.
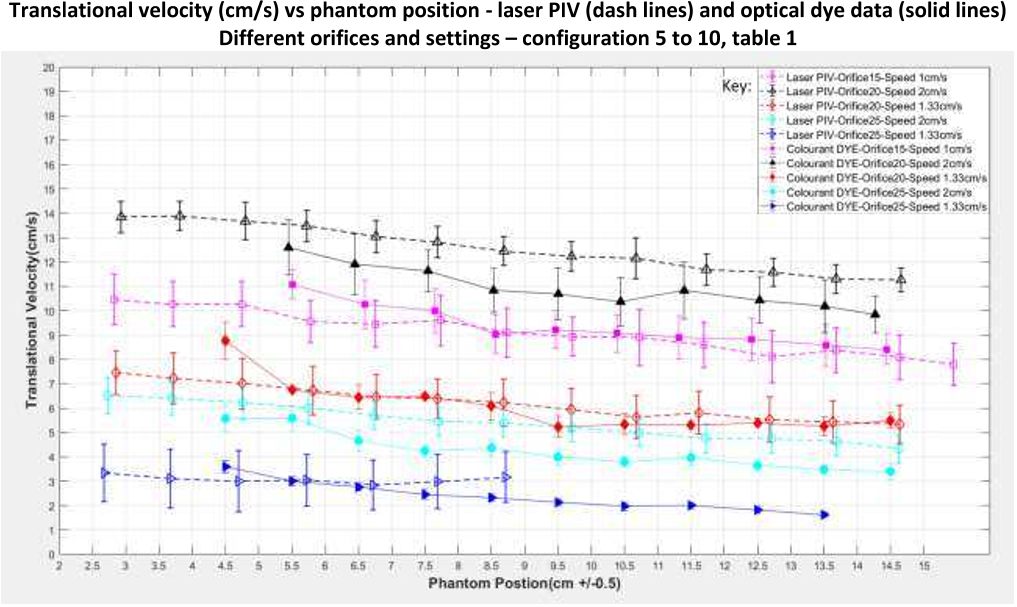 Figure 7. Laser-PIV and coloured dye translational velocity measurements relevant to configuration 6 to 10 (Table 1). Each configuration corresponds to a particular marker/shape combination enabling direct comparison of optical/PIV measurements. Laser-PIV data are plotted with dashed lines while coloured dye data uses solid markers with bold lines. Error bars represent the standard deviation values on 10 acquisitions.
 Table 1. Summary of the flow generating conditions, with Reynolds number at the throat of the orifice cited. Each configuration was repeated ten times to evaluate reproducibility
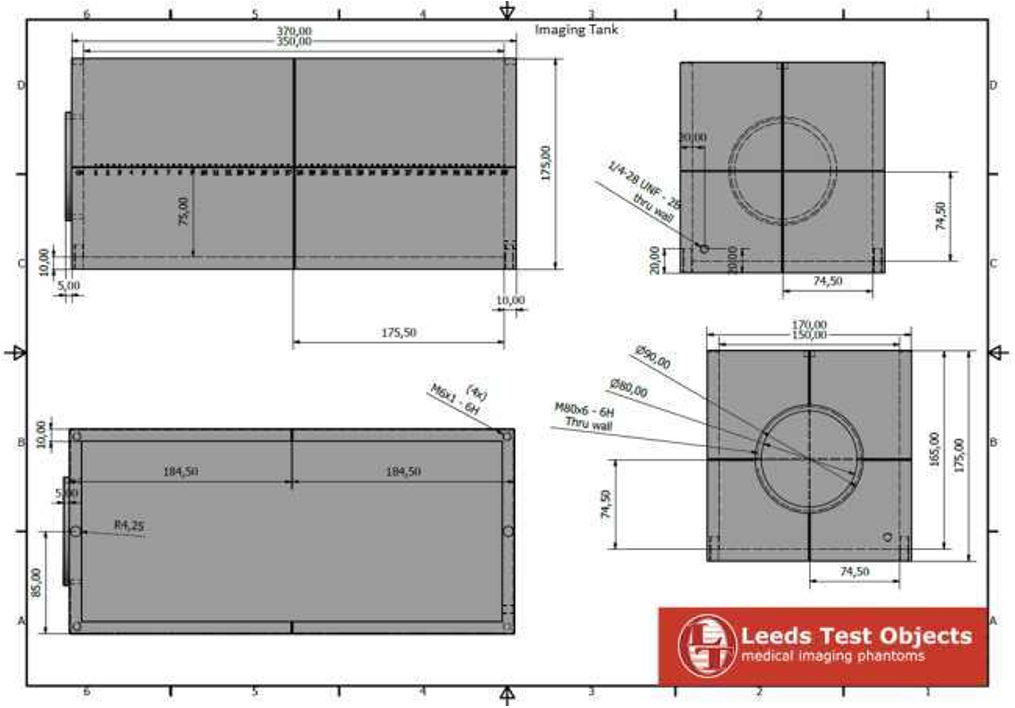 Figure 1. CAD drawing of the ring vortex tank.
 Figure 9: Image (a) displays a colormap derived from the PIV data, depicting the y-component (vertical direction) of the fluid velocities within the ring vortex. (b) shows the structure of the ring (vertical crosssection) captured by the B-scan mode of a Doppler scanner. The color Doppler image (c) clarifies flow toward/away from the probe (placed at the top of the image) and apart from the persistence artefact, appropriately resembles the PIV data of image (a).
 Figure 6. Laser-PIV and coloured dye translational velocity measurements relevant to configuration 1 to 5 (Table 1). Each configuration corresponds to a particular marker/shape combination enabling direct comparison of optical/PIV measurements. Laser-PIV data are plotted with dashed lines while coloured dye data uses solid markers with bold lines. Error bars represent the standard deviation values on 10 acquisitions.
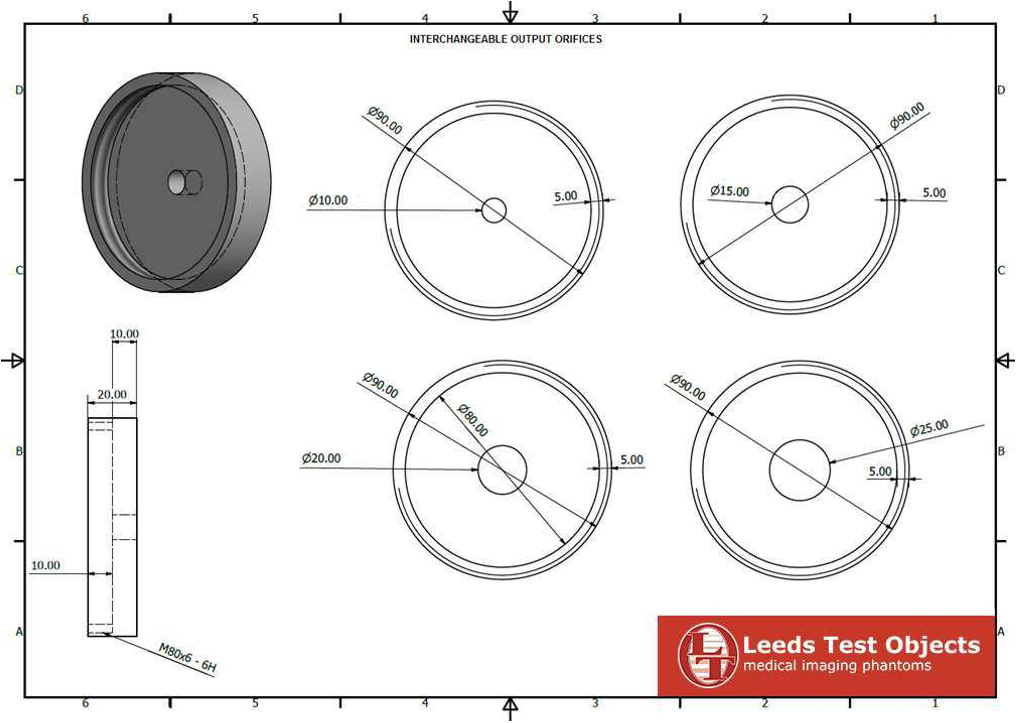 Figure 3. CAD drawing of the attachable/detachable orifices.
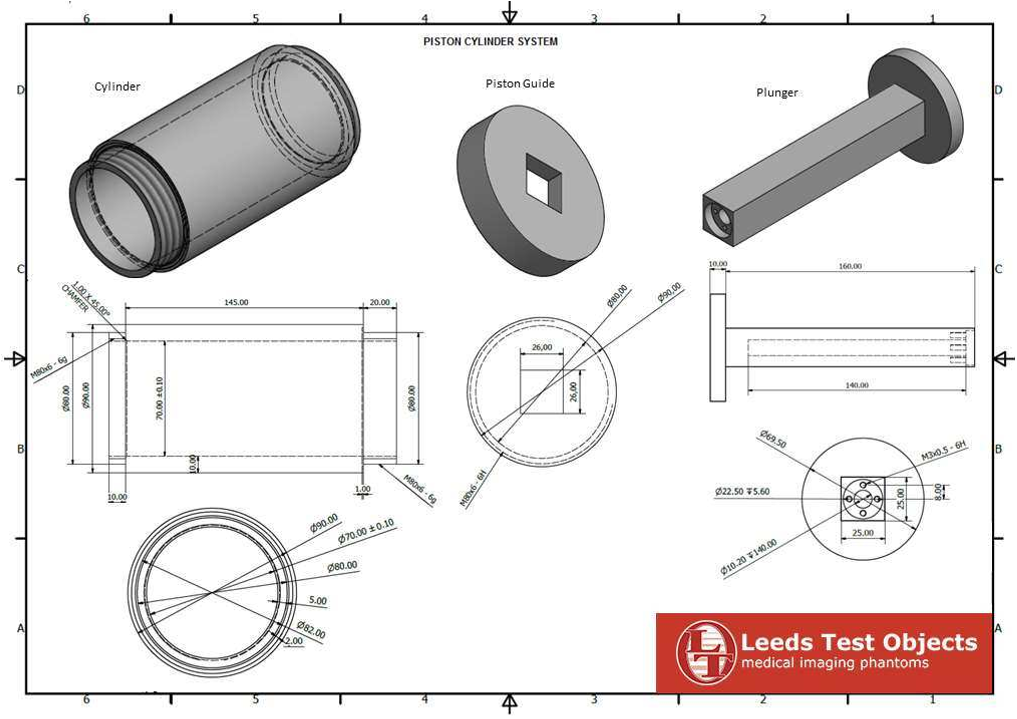 Figure 2. CAD drawing of the piston cylinder system.


