scispace - formally typeset
Search or ask a question
Posted ContentDOI

A Comprehensive Evaluation of Surface Air Temperature Reanalyses over China against Urbanization Bias–Adjusted Observations

TL;DR: In this article, the authors compare the differences in surface air temperature (SAT) between observational that has been adjusted for urbanization bias and reanalysis data (NCEPV1, N CEPV2, ERA5, CFSR, MERRA, JRA55, 20CRV3 and CRA40) over mainland China during 1961-2015.
About: This article is published in Advances in Climate Change Research.The article was published on 2021-02-12 and is currently open access. It has received 13 citations till now.

Summary (1 min read)

Figures

  • Figure 1 Distribution of the elevation distribution and 763 observation stations across mainland China.
  • The designations employed and the presentation of the material on this map do not imply the expression of any opinion whatsoever on the part of Research Square concerning the legal status of any country, territory, city or area or of its authorities, or concerning the delimitation of its frontiers or boundaries.
  • This map has been provided by the authors.
  • (The black dots represent signi cant deviation, the value of color bar means the annual mean SAT bias (units: °C)) Note:.

1961–2015 across China:(a) NCEPV1; (b) JRA55; (c) 20CRV3 (d) OBS. (The black dots represent

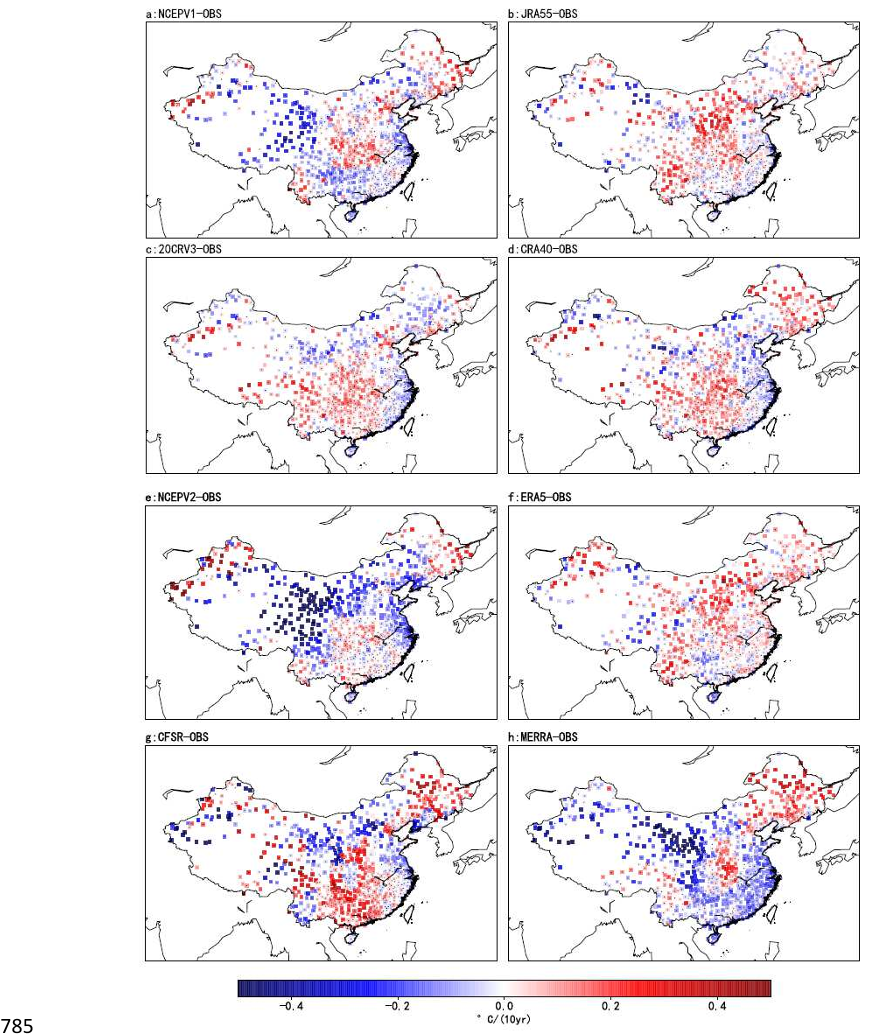
  • Signi cant deviation, the value of color bar means the linear trend bias and linear trend (units: °C/10year)).
  • This map has been provided by the authors.
  • The biases of climate state and linear trends of annual mean temperature between the REAs and OBS for the period 1979–2015.
  • The orange dots represent the altitude of stations between 500-1500m.

Did you find this useful? Give us your feedback

Figures (18)
Citations
More filters
01 Jan 2012
TL;DR: In this article, the urbanization effect on observed temperatures from 1980 to 2009 in China is estimated, based on analysis of urban land use from satellite observation, and the urban heat island (UHI) effect can be estimated if the urban effect on C3 is negligible.
Abstract: Since the 1980s, China has undergone rapid urbanization. Meanwhile, the climate has been warming substantially. In this paper, the urbanization effect on observed temperatures from 1980 to 2009 in China is estimated, based on analysis of urban land use from satellite observation. Urban land-use expansion (ΔU) during 1980–2005 is applied as an urbanization index. According to these ΔU values, stations are divided into three categories: (C1) intense urbanization around the stations; (C2) moderate urbanization around the stations; and (C3) minimal urbanization around the stations. Most C1 stations are in municipalities or provincial capitals, while C2 stations tend to be in prefecture-level cities. C3 stations are mostly in counties. The urban heat island (UHI) effect can be estimated if the urban effect on C3 is negligible. The warming of C1 or C2 relative to that of C3 represents their urbanization effects, assuming that the same larger-scale natural warming has affected each category. For C1, the local urbanization effect is 0.258°C/10 a over 1980–2009, accounting for 41% of the total warming; the trend at C2 is 0.099°C/10 a, or 21%. For all China, the urbanization effect is 0.09°C/10a, accounting for 20% of the total national warming. Winter urban warming is greater than in summer. The assumption of negligible urbanization effect on C3 is debatable, and so the true urbanization effect may equal or slightly exceed estimates. Further, the ΔU index may have some uncertainties, for it is only one of the urbanization indices. However, it provides a new and direct estimation of environmental change, in contrast to indirect indices.

64 citations

Journal Article
TL;DR: The results show that the difference of mean daily temperature between city and suburb is the largest on 24 December in 1995 during the last 4 0 years, and an obvious 12 years cycle of mean annual temperature is found.
Abstract: Variations of mean temperature in Beijing city are ana ly zed in this paper.The results show that the difference of mean daily temperature between city and suburb is the largest on 24 December in 1995 during the last 4 0 years,and the mean daily temperature in the city is 4.6℃ higher than that in the suburb;the difference of temperature between the city and the suburb is the utmost in winter season and the mean seasonal temperature in the city is 1.11℃ higher than that in the suburb,while the difference is the least in spring seaso n,and the temperature in the city is 0.26℃ higher than that in the suburb;for t he inter-annual variability of temperature,the difference of temperature is lit tle from 1961 to 1977,while the difference is great from 1978 to 2000,and the te mperature in the city is 0.62℃ higher than that in the suburb,so the heat islan d effect is reinforced from 1978 to 2000;the difference of temperature is the le ast in 1960's,and the temperature in the city is 0.13℃ higher than that in the suburb,whereas the difference is the maximal in 1990's,and the temperature in th e city is 0.78℃ higher than that in the suburb;the number of high temperature d ays(≥35℃)is going up obviously in recent years,but the highest temperature is not changed greatly,and the highest temperature is higher than 38℃ only in 1997 ,1999 and 2000. The mean annual temperature is increasing apparently during the last 40 years,and it is increasing by 0.43℃/10ɑ in the city and 0.21℃/10ɑ in the suburb,an obvious 12 years cycle of mean annual temperature is found.

11 citations

Journal ArticleDOI
TL;DR: In this article , changes in frequency of record-breaking land surface temperature over Earth's since 1980 are assessed using six different gridded datasets comprising monthly mean air temperature and weather station data retrieved from Global Historical Climatology Network and NOAA Global Summary of the Day.

4 citations

01 Dec 2015
TL;DR: In this paper, the authors evaluated the reliability and consistencies of multidecadal atmospheric reanalysis products and found that most of the reanalyses reproduce well the observed long-term atmospheric precipitable water (PW) changes and interannual variations over China.
Abstract: Many multidecadal atmospheric reanalysis products are available now, but their consistencies and reliability are far from perfect. In this study, atmospheric precipitable water (PW) from the National Centers for Environmental Prediction/National Center for Atmospheric Research (NCEP/NCAR), NCEP/Department of Energy (DOE), Modern Era Retrospective-Analysis for Research and Applications (MERRA), Japanese 55 year Reanalysis (JRA-55), JRA-25, ERA-Interim, ERA-40, Climate Forecast System Reanalysis (CFSR), and 20th Century Reanalysis version 2 is evaluated against homogenized radiosonde observations over China during 1979–2012 (1979–2001 for ERA-40). Results suggest that the PW biases in the reanalyses are within ∼20% for most of northern and eastern China, but the reanalyses underestimate the observed PW by 20%–40% over western China and by ∼60% over the southwestern Tibetan Plateau. The newer-generation reanalyses (e.g., JRA25, JRA55, CFSR, and ERA-Interim) have smaller root-mean-square error than the older-generation ones (NCEP/NCAR, NCEP/DOE, and ERA-40). Most of the reanalyses reproduce well the observed PW climatology and interannual variations over China. However, few reanalyses capture the observed long-term PW changes, primarily because they show spurious wet biases before about 2002. This deficiency results mainly from the discontinuities contained in reanalysis relative humidity fields in the middle-lower troposphere due to the wet bias in older radiosonde records that are assimilated into the reanalyses. An empirical orthogonal function (EOF) analysis revealed two leading modes that represent the long-term PW changes and El Nino–Southern Oscillation-related interannual variations with robust spatial patterns. The reanalysis products, especially the MERRA and JRA-25, roughly capture these EOF modes, which account for over 50% of the total variance. The results show that even during the post-1979 satellite era, discontinuities in radiosonde data can still induce large spurious long-term changes in reanalysis PW and other related fields. Thus, more efforts are needed to remove spurious changes in input data for future long-term reanalyses.

3 citations

Journal ArticleDOI
TL;DR: In this paper , the authors evaluate the consistency and accuracy of three different types of reanalysis data (i.e., ERA5, MERRA2, and CRA40) used to invert the zenith tropospheric delay (ZTD) from 436 international GNSS service (IGS) stations in 2020, based on the integral method.
Abstract: Accurate estimation of tropospheric delay is significant for global navigation satellite system’s (GNSS) high-precision navigation and positioning. However, due to the random and contingent changes in weather conditions and water vapor factors, the classical tropospheric delay model cannot accurately reflect changes in tropospheric delay. In recent years, with the development of meteorological observation/detection and numerical weather prediction (NWP) technology, the accuracy and resolution of meteorological reanalysis data have been effectively improved, providing a new solution for the inversion and modeling of regional or global tropospheric delays. Here, we evaluate the consistency and accuracy of three different types of reanalysis data (i.e., ERA5, MERRA2, and CRA40) used to invert the zenith tropospheric delay (ZTD) from 436 international GNSS service (IGS) stations in 2020, based on the integral method. The results show that the ZTD inversion of the three types of reanalysis data was consistent with the IGS ZTD, even in heavy rain conditions. Furthermore, the average precision of the ZTD inversion of the ERA5 reanalysis data was higher, where the mean deviation (bias), mean absolute error (MAE), and root mean square (RMS) were –3.39, 9.69, and 12.55 mm, respectively. The ZTD average precisions of the MERRA2 and CRA40 inversions were comparable, showing slightly worse performance than the ERA5. In addition, we further analyzed the global distribution characteristics of the ZTD errors inverted from the reanalysis data. The results show that ZTD errors inverted from the reanalysis data were highly correlated with station latitude and climate type, and they were mainly concentrated in the tropical climate zone at low latitudes. Compared to dividing error areas by latitude, dividing error areas by climatic category could better reflect the global distribution of errors and would also provide a data reference for the establishment of tropospheric delay models considering climate type.

2 citations

References
More filters
Journal ArticleDOI
TL;DR: Several global quantities are computed from the ERA40 reanalysis for the period 1958-2001 and explored for trends as discussed by the authors, including temperature, integrated water vapor (IWV), and kinetic energy.
Abstract: Several global quantities are computed from the ERA40 reanalysis for the period 1958-2001 and explored for trends. These are discussed in the context of changes to the global observing system. Temperature, integrated water vapor (IWV), and kinetic energy are considered. The ERA40 global mean temperature in the lower troposphere has a trend of +0.11 K per decade over the period of 1979-2001, which is slightly higher than the MSU measurements, but within the estimated error limit. For the period 1958 2001 the warming trend is 0.14 K per decade but this is likely to be an artifact of changes in the observing system. When this is corrected for, the warming trend is reduced to 0.10 K per decade. The global trend in IWV for the period 1979-2001 is +0.36 mm per decade. This is about twice as high as the trend determined from the Clausius-Clapeyron relation assuming conservation of relative humidity. It is also larger than results from free climate model integrations driven by the same observed sea surface temperature as used in ERA40. It is suggested that the large trend in IWV does not represent a genuine climate trend but an artifact caused by changes in the global observing system such as the use of SSM/I and more satellite soundings in later years. Recent results are in good agreement with GPS measurements. The IWV trend for the period 1958-2001 is still higher but reduced to +0.16 mm per decade when corrected for changes in the observing systems. Total kinetic energy shows an increasing global trend. Results from data assimilation experiments strongly suggest that this trend is also incorrect and mainly caused by the huge changes in the global observing system in 1979. When this is corrected for, no significant change in global kinetic energy from 1958 onward can be found.

509 citations

Journal ArticleDOI
TL;DR: In this article, the authors compared seven reanalysis datasets for the Arctic region over the 30-yr period 1981-2010: National Centers for Environmental Prediction (NCEP), National Center for Atmospheric Research Reanalysis 1, NCEP-R1, U.S. Department of Energy Reanalysis 2, CFSR, Twentieth-Century Reanalysis (20CR), Modern-Era Retrospective Analysis for Research and Applications (MERRA), ECMWF Interim Re-Analysis (ERA-Interim), and Japanese 25-year Reanalysis Project
Abstract: Atmospheric reanalyses depend on a mix of observations and model forecasts. In data-sparse regions such as the Arctic, the reanalysis solution is more dependent on the model structure, assumptions, and data assimilation methods than in data-rich regions. Applications such as the forcing of ice–ocean models are sensitive to the errors in reanalyses. Seven reanalysis datasets for the Arctic region are compared over the 30-yr period 1981–2010: National Centers for Environmental Prediction (NCEP)–National Center for Atmospheric Research Reanalysis 1 (NCEP-R1) and NCEP–U.S. Department of Energy Reanalysis 2 (NCEP-R2), Climate Forecast System Reanalysis (CFSR), Twentieth-Century Reanalysis (20CR), Modern-Era Retrospective Analysis for Research and Applications (MERRA), ECMWF Interim Re-Analysis (ERA-Interim), and Japanese 25-year Reanalysis Project (JRA-25). Emphasis is placed on variables not observed directly including surface fluxes and precipitation and their trends. The monthly averaged surface tem...

490 citations

Journal ArticleDOI
TL;DR: In this article, a dataset of 282 meteorological stations including all of the ordinary and national basic/reference surface stations of north China is used to analyze the urbanization effect on surface air temperature trends.
Abstract: A dataset of 282 meteorological stations including all of the ordinary and national basic/reference surface stations of north China is used to analyze the urbanization effect on surface air temperature trends. These stations are classified into rural, small city, medium city, large city, and metropolis based on the updated information of total population and specific station locations. The significance of urban warming effects on regional average temperature trends is estimated using monthly mean temperature series of the station group datasets, which undergo inhomogeneity adjustment. The authors found that the largest effect of urbanization on annual mean surface air temperature trends occurs for the large-city station group, with the urban warming being 0.16°C (10 yr) 1 , and the effect is the smallest for the small-city station group with urban warming being only 0.07°C (10 yr) 1 . A similar assessment is made for the dataset of national basic/reference stations, which has been widely used in regional climate change analyses in China. The results indicate that the regional average annual mean temperature series, as calculated using the data from the national basic/reference stations, is significantly impacted by urban warming, and the trend of urban warming is estimated to be 0.11°C (10 yr) 1 . The contribution of urban warming to total annual mean surface air temperature change as estimated with the national basic/reference station dataset reaches 37.9%. It is therefore obvious that, in the current regional average surface air temperature series in north China, or probably in the country as a whole, there still remain large effects from urban warming. The urban warming bias for the regional average temperature anomaly series is corrected. After that, the increasing rate of the regional annual mean temperature is brought down from 0.29°C (10 yr) 1 to 0.18°C (10 yr) 1 , and the total change in temperature approaches 0.72°C for the period analyzed.

410 citations

Journal ArticleDOI
TL;DR: The 20CRv2c dataset as mentioned in this paper is the first ensemble of sub-daily global atmospheric conditions spanning over 100 years, which provides a best estimate of the weather at any given place and time as well as an estimate of its confidence and uncertainty.
Abstract: Historical reanalyses that span more than a century are needed for a wide range of studies, from understanding large‐scale climate trends to diagnosing the impacts of individual historical extreme weather events. The Twentieth Century Reanalysis (20CR) Project is an effort to fill this need. It is supported by the National Oceanic and Atmospheric Administration (NOAA), the Cooperative Institute for Research in Environmental Sciences (CIRES), and the U.S. Department of Energy (DOE), and is facilitated by collaboration with the international Atmospheric Circulation Reconstructions over the Earth initiative. 20CR is the first ensemble of sub‐daily global atmospheric conditions spanning over 100 years. This provides a best estimate of the weather at any given place and time as well as an estimate of its confidence and uncertainty. While extremely useful, version 2c of this dataset (20CRv2c) has several significant issues, including inaccurate estimates of confidence and a global sea level pressure bias in the mid‐19th century. These and other issues can reduce its effectiveness for studies at many spatial and temporal scales. Therefore, the 20CR system underwent a series of developments to generate a significant new version of the reanalysis. The version 3 system (NOAA‐CIRES‐DOE 20CRv3) uses upgraded data assimilation methods including an adaptive inflation algorithm; has a newer, higher‐resolution forecast model that specifies dry air mass; and assimilates a larger set of pressure observations. These changes have improved the ensemble‐based estimates of confidence, removed spin‐up effects in the precipitation fields, and diminished the sea‐level pressure bias. Other improvements include more accurate representations of storm intensity, smaller errors, and large‐scale reductions in model bias. The 20CRv3 system is comprehensively reviewed, focusing on the aspects that have ameliorated issues in 20CRv2c. Despite the many improvements, some challenges remain, including a systematic bias in tropical precipitation and time‐varying biases in southern high‐latitude pressure fields.

409 citations

Journal ArticleDOI
TL;DR: In this article, the authors summarized the main results and findings of studies conducted by Chinese scientists in the past five years and showed that observed climate change in China bears a strong similarity with the global average.
Abstract: This article summarizes the main results and findings of studies conducted by Chinese scientists in the past five years It is shown that observed climate change in China bears a strong similarity with the global average The country-averaged annual mean surface air temperature has increased by 11°C over the past 50 years and 05–08°C over the past 100 years, slightly higher than the global temperature increase for the same periods Northern China and winter have experienced the greatest increases in surface air temperature Although no significant trend has been found in country-averaged annual precipitation, interdecadal variability and obvious trends on regional scales are detectable, with northwestern China and the mid and lower Yangtze River basin having undergone an obvious increase, and North China a severe drought Some analyses show that frequency and magnitude of extreme weather and climate events have also undergone significant changes in the past 50 years or so Studies of the causes of regional climate change through the use of climate models and consideration of various forcings, show that the warming of the last 50 years could possibly be attributed to an increased atmospheric concentration of greenhouse gases, while the temperature change of the first half of the 20th century may be due to solar activity, volcanic eruptions and sea surface temperature change A significant decline in sunshine duration and solar radiation at the surface in eastern China has been attributed to the increased emission of pollutants Projections of future climate by models of the NCC (National Climate Center, China Meteorological Administration) and the IAP (Institute of Atmospheric Physics, Chinese Academy of Sciences), as well as 40 models developed overseas, indicate a potential significant warming in China in the 21st century, with the largest warming set to occur in winter months and in northern China Under varied emission scenarios, the country-averaged annual mean temperature is projected to increase by 15–21°C by 2020, 23–33°C by 2050, and by 39–60°C by 2100, in comparison to the 30-year average of 1961–1990 Most models project a 10%–12% increase in annual precipitation in China by 2100, with the trend being particularly evident in Northeast and Northwest China, but with parts of central China probably undergoing a drying trend Large uncertainty exists in the projection of precipitation, and further studies are needed Furthermore, anthropogenic climate change will probably lead to a weaker winter monsoon and a stronger summer monsoon in eastern Asia

315 citations

Related Papers (5)
Frequently Asked Questions (7)
Q1. How many reanalysis datasets have been developed?

The biases in 70 inter–annual variability, time series, and spatial distribution characteristics between reanalysis and 71 observational data have been analyzed. 

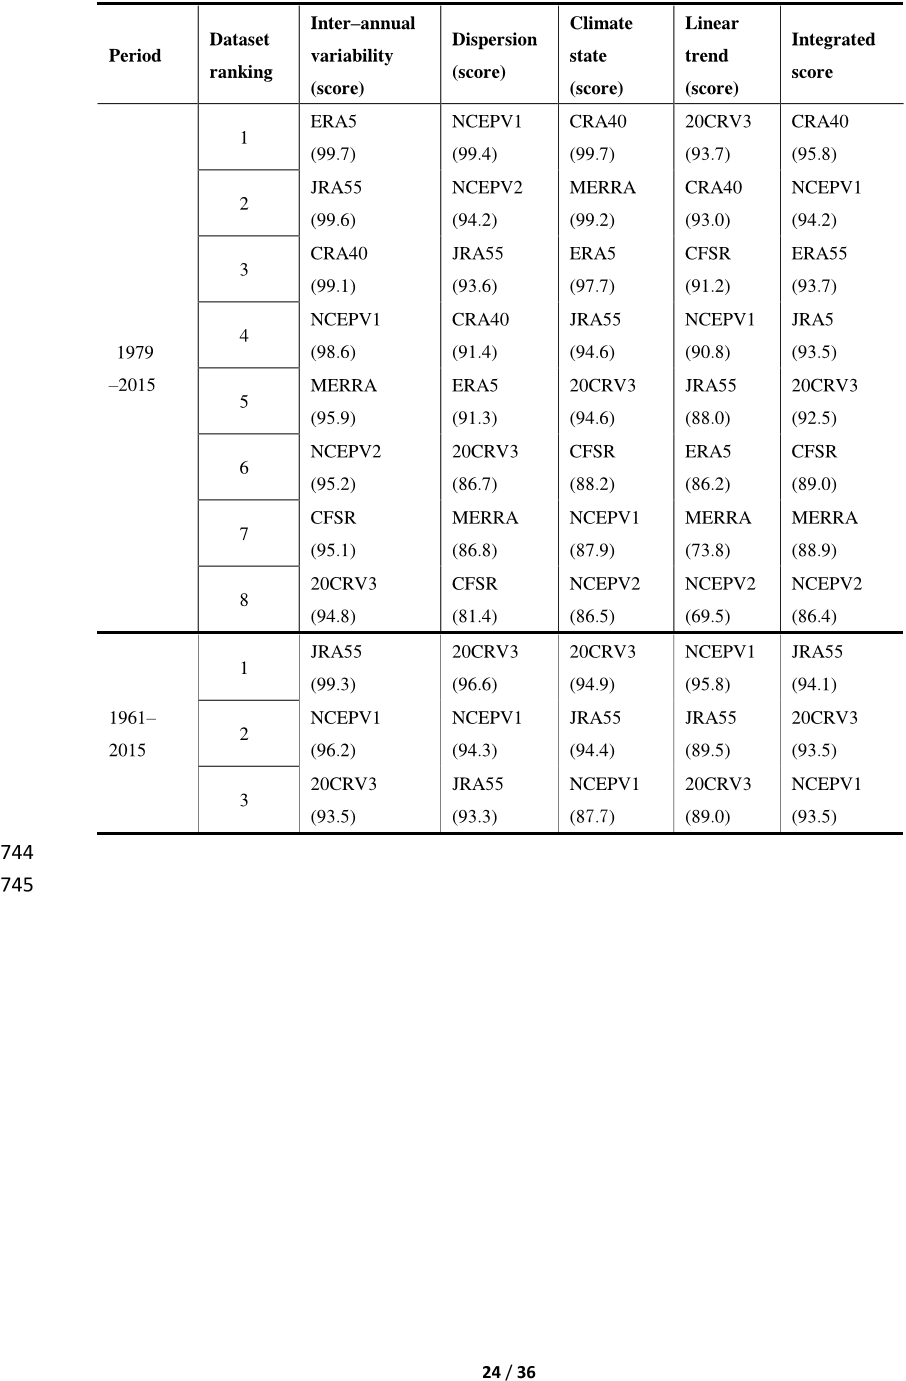
The integrated score of 469 20CRV3 was 92.5 and 93.5 during the periods of 1979–2015 and 1961–2015 respectively, with the 470 better performance than other REAs in linear trend (1979–2015), dispersion (1961–2015), and 471 climate state (1961–2015). 

Since these reanalyses have the disadvantages of incorporating the errors from 53 the numerical prediction models, the assimilation processes, and the observation systems 54 (Bengtsson et al., 2004a, 2004b; Zhao et al., 2010; Zhao et al., 2015), the reliability of the reanalysis 55 data needs to be proven on global and regional scales. 

In this study, the authors evaluate the applicability of the reanalysis data by using the urbanization 125 bias–adjusted observational data from 1961–2015 across mainland China. 

527 (4) The REA biases in correlation, standard deviation, climate state and linear trends generally 528 increase with increasing elevation of stations. 

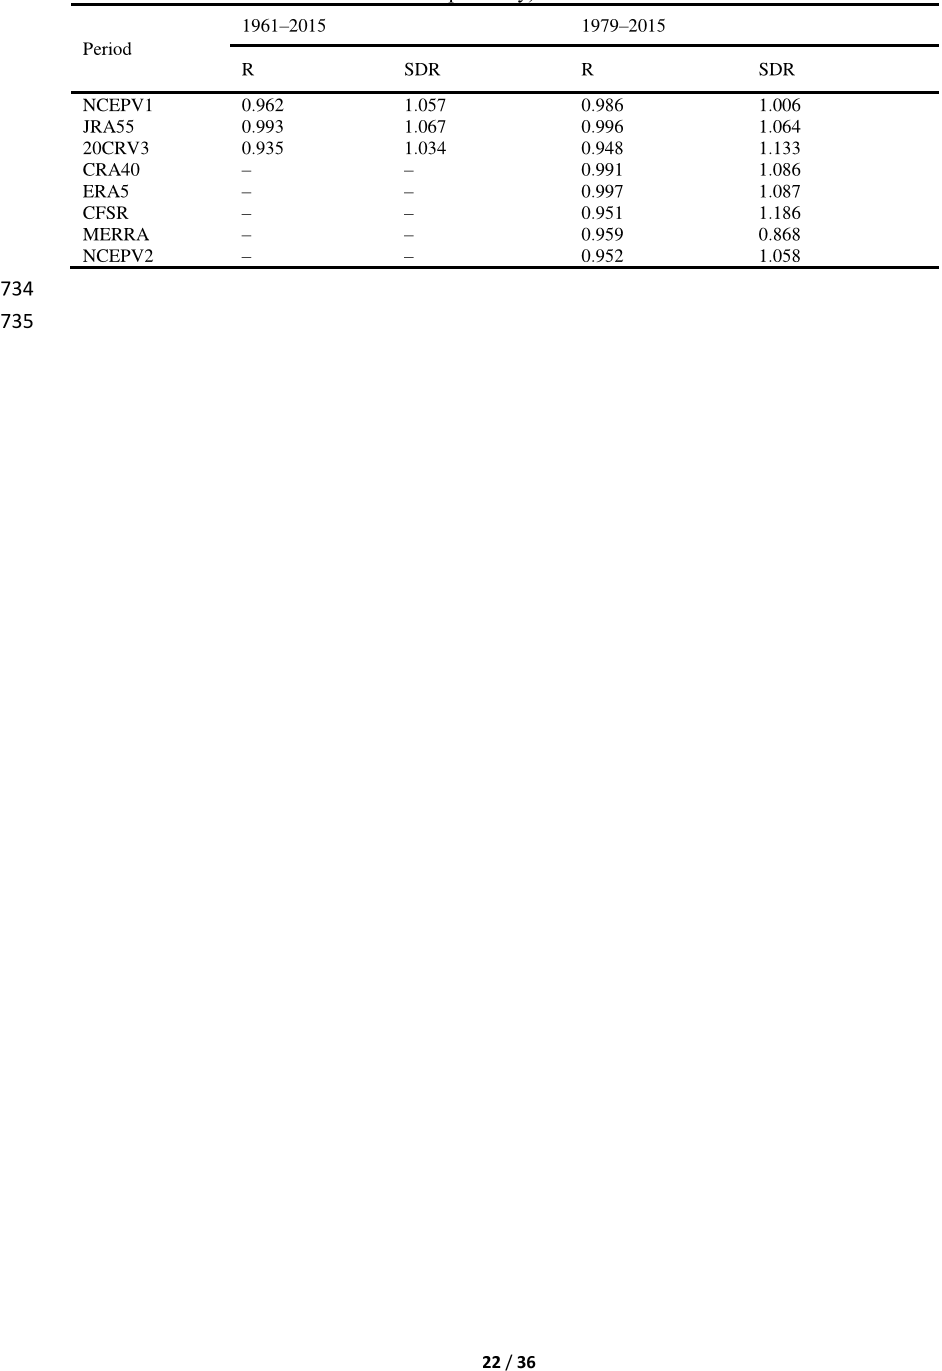
The time series, correlation, standard deviation, 177 climate state, and linear trends of the reanalysis data are evaluated against the observations. 

The 512 cold biases of CRA40, NCEPV1 and JRA55 are mainly caused by the lower SAT in summer, 513 whereas those of NCEPV2, CFSR, and ERA5 are mainly caused by the lower winter mean 514 temperature.