
All figures (15)
![Figure 3: Plot of the trapped hydrogen concentration (CT ) as a function of the lattice hydrogen concentration (CL), equivalent plastic strain (εp) and trap binding energy (EB). (a) Trapping model by Kumnick and Johnson [2]. (b) Trapping model by Sofronis et al. [34, 35].](/figures/figure-3-plot-of-the-trapped-hydrogen-concentration-ct-as-a-3tt1rt8b.png) Figure 3: Plot of the trapped hydrogen concentration (CT ) as a function of the lattice hydrogen concentration (CL), equivalent plastic strain (εp) and trap binding energy (EB). (a) Trapping model by Kumnick and Johnson [2]. (b) Trapping model by Sofronis et al. [34, 35].
Figure 3: Plot of the trapped hydrogen concentration (CT ) as a function of the lattice hydrogen concentration (CL), equivalent plastic strain (εp) and trap binding energy (EB). (a) Trapping model by Kumnick and Johnson [2]. (b) Trapping model by Sofronis et al. [34, 35].![Figure 8: Hydrogen effect on decohesion by quantum-mechanical approaches: (a) Traction separation curves for decohesion along Al(111) planes with a hydrogen coverage between 0 and 1, by Van der Ven and Ceder [54]. (b) Cleavage energy for decohesion along Al(111) and Fe(110) as a function of hydrogen coverage, by Jiang and Carter [55].](/figures/figure-8-hydrogen-effect-on-decohesion-by-quantum-mechanical-23kezcai.png) Figure 8: Hydrogen effect on decohesion by quantum-mechanical approaches: (a) Traction separation curves for decohesion along Al(111) planes with a hydrogen coverage between 0 and 1, by Van der Ven and Ceder [54]. (b) Cleavage energy for decohesion along Al(111) and Fe(110) as a function of hydrogen coverage, by Jiang and Carter [55].
Figure 8: Hydrogen effect on decohesion by quantum-mechanical approaches: (a) Traction separation curves for decohesion along Al(111) planes with a hydrogen coverage between 0 and 1, by Van der Ven and Ceder [54]. (b) Cleavage energy for decohesion along Al(111) and Fe(110) as a function of hydrogen coverage, by Jiang and Carter [55].![Figure 13: Normalized threshold stress intensity factor and normalized hydrogen dependent cohesive stress as a function of hydrogen concentration, according to experimental data by Thomas et al. [4], the linear decohesion model and the exponential decohesion model by Serebrinsky et al. [11], with ∆G0b = 30 kJ/mol.](/figures/figure-13-normalized-threshold-stress-intensity-factor-and-3c3wwpbe.png) Figure 13: Normalized threshold stress intensity factor and normalized hydrogen dependent cohesive stress as a function of hydrogen concentration, according to experimental data by Thomas et al. [4], the linear decohesion model and the exponential decohesion model by Serebrinsky et al. [11], with ∆G0b = 30 kJ/mol.
Figure 13: Normalized threshold stress intensity factor and normalized hydrogen dependent cohesive stress as a function of hydrogen concentration, according to experimental data by Thomas et al. [4], the linear decohesion model and the exponential decohesion model by Serebrinsky et al. [11], with ∆G0b = 30 kJ/mol.![Figure 4: Reported diffusion coefficients for hydrogen in iron and steel. Adapted from Grong [41].](/figures/figure-4-reported-diffusion-coefficients-for-hydrogen-in-d00c7l0u.png) Figure 4: Reported diffusion coefficients for hydrogen in iron and steel. Adapted from Grong [41].
Figure 4: Reported diffusion coefficients for hydrogen in iron and steel. Adapted from Grong [41]. Figure 5: Hydrostatic stress and equivalent plastic strain as a function of the distance from the notch tip, plotted at the end of loading.
![Figure 7: Cohesive laws by Hillerborg et al. [47], Needleman [48] and Scheider [49].](/figures/figure-7-cohesive-laws-by-hillerborg-et-al-47-needleman-48-1ymh7zoe.png) Figure 7: Cohesive laws by Hillerborg et al. [47], Needleman [48] and Scheider [49].
Figure 7: Cohesive laws by Hillerborg et al. [47], Needleman [48] and Scheider [49].![Figure 11: Relationship between critical cohesive energy at fracture and hydrogen coverage for the polynomial cohesive law by Needleman [48]. Single hydrogen influence denotes hydrogen reduction of the critical cohesive stress. Double hydrogen influence denotes hydrogen reduction of the critical cohesive stress and of the critical separation.](/figures/figure-11-relationship-between-critical-cohesive-energy-at-bq8dksxp.png) Figure 11: Relationship between critical cohesive energy at fracture and hydrogen coverage for the polynomial cohesive law by Needleman [48]. Single hydrogen influence denotes hydrogen reduction of the critical cohesive stress. Double hydrogen influence denotes hydrogen reduction of the critical cohesive stress and of the critical separation.
Figure 11: Relationship between critical cohesive energy at fracture and hydrogen coverage for the polynomial cohesive law by Needleman [48]. Single hydrogen influence denotes hydrogen reduction of the critical cohesive stress. Double hydrogen influence denotes hydrogen reduction of the critical cohesive stress and of the critical separation.![Figure 12: Hydrogen influenced cohesive laws from the decohesion model by Liang and Sofronis [10], T 0n is the normal traction and q is a non-dimensional separation parameter.](/figures/figure-12-hydrogen-influenced-cohesive-laws-from-the-32g68x8i.png) Figure 12: Hydrogen influenced cohesive laws from the decohesion model by Liang and Sofronis [10], T 0n is the normal traction and q is a non-dimensional separation parameter.
Figure 12: Hydrogen influenced cohesive laws from the decohesion model by Liang and Sofronis [10], T 0n is the normal traction and q is a non-dimensional separation parameter.![Figure 10: Reduction in cohesive energy at different levels of hydrogen coverage for the polynomial cohesive law by Needleman [48], where (a) illustrates hydrogen influence on the cohesive strength only (single) and (b) illustrates hydrogen influence on both the cohesive strength and the critical separation (double).](/figures/figure-10-reduction-in-cohesive-energy-at-different-levels-3rbx36bt.png) Figure 10: Reduction in cohesive energy at different levels of hydrogen coverage for the polynomial cohesive law by Needleman [48], where (a) illustrates hydrogen influence on the cohesive strength only (single) and (b) illustrates hydrogen influence on both the cohesive strength and the critical separation (double).
Figure 10: Reduction in cohesive energy at different levels of hydrogen coverage for the polynomial cohesive law by Needleman [48], where (a) illustrates hydrogen influence on the cohesive strength only (single) and (b) illustrates hydrogen influence on both the cohesive strength and the critical separation (double).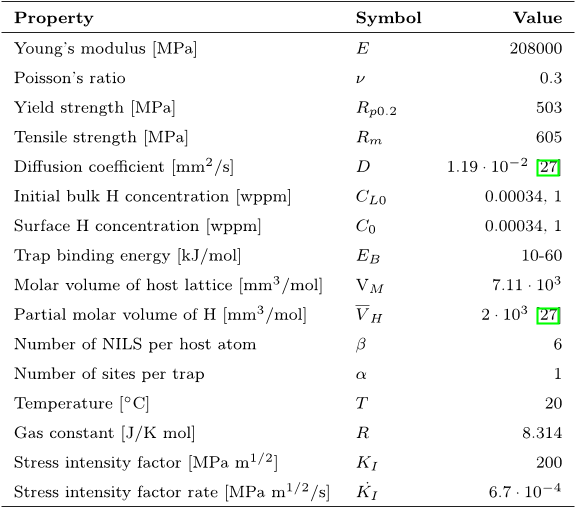 Table 2: Input parameters and boundary conditions for FE hydrogen diffusion analysis.
![Figure 2: Dislocation trap densities according to the work by Kumnick and Johnson [2] and the model by Sofronis et al. [34, 35]. In calculating CT , it is assumed αθT = 1, which accordingly gives the maximum possible hydrogen concentration trapped at dislocations.](/figures/figure-2-dislocation-trap-densities-according-to-the-work-by-bvfr3wyo.png) Figure 2: Dislocation trap densities according to the work by Kumnick and Johnson [2] and the model by Sofronis et al. [34, 35]. In calculating CT , it is assumed αθT = 1, which accordingly gives the maximum possible hydrogen concentration trapped at dislocations.
Figure 2: Dislocation trap densities according to the work by Kumnick and Johnson [2] and the model by Sofronis et al. [34, 35]. In calculating CT , it is assumed αθT = 1, which accordingly gives the maximum possible hydrogen concentration trapped at dislocations.![Figure 15: CTOD-R curves for various deformation rates, comparing experimental tests (symbol) and simulation results (lines) [14].](/figures/figure-15-ctod-r-curves-for-various-deformation-rates-3b0szsgq.png) Figure 15: CTOD-R curves for various deformation rates, comparing experimental tests (symbol) and simulation results (lines) [14].
Figure 15: CTOD-R curves for various deformation rates, comparing experimental tests (symbol) and simulation results (lines) [14].![Figure 9: Hydrogen coverage as a function of hydrogen concentration, for various levels of Gibbs energy (kJ/mol). Plotted according to the Langmuir-McLean isotherm [63].](/figures/figure-9-hydrogen-coverage-as-a-function-of-hydrogen-141pq59o.png) Figure 9: Hydrogen coverage as a function of hydrogen concentration, for various levels of Gibbs energy (kJ/mol). Plotted according to the Langmuir-McLean isotherm [63].
Figure 9: Hydrogen coverage as a function of hydrogen concentration, for various levels of Gibbs energy (kJ/mol). Plotted according to the Langmuir-McLean isotherm [63]. Figure 6: Normalized hydrogen concentration as a function of distance from the notch tip using the boundary layer approach, plotted at the end of loading. (a) Low trap density model, C0 = 0.00034 wppm, EB = 30 − 60 kJ/mol. (b) Low trap density model, C0 = 1 wppm, EB = 30 − 40, 60 kJ/mol. (c) High trap density model, C0 = 0.00034 wppm, EB = 20 − 60 kJ/mol. (d) High trap density model, C0 = 1 wppm, EB = 20 − 40, 60 kJ/mol.
 Figure 14: Hydrogen coverage and reduction in cohesive strength as a function of distance from the notch tip, plotted at the end of loading. ∆G0b = 30 kJ/mol. (a) Low trap density model, C0 = 0.00034 wppm, EB = 30 (CTot), 40 − 60 kJ/mol. (b) Low trap density model, C0 = 1 wppm, EB = 30 − 40, 60 kJ/mol. (c) High trap density model, C0 = 0.00034 wppm, EB = 20 − 60 kJ/mol. (d) High trap density model, C0 = 1 wppm, EB = 20 − 40, 60 kJ/mol.
![Figure 3: Plot of the trapped hydrogen concentration (CT ) as a function of the lattice hydrogen concentration (CL), equivalent plastic strain (εp) and trap binding energy (EB). (a) Trapping model by Kumnick and Johnson [2]. (b) Trapping model by Sofronis et al. [34, 35].](/figures/figure-3-plot-of-the-trapped-hydrogen-concentration-ct-as-a-3tt1rt8b.webp)
![Figure 8: Hydrogen effect on decohesion by quantum-mechanical approaches: (a) Traction separation curves for decohesion along Al(111) planes with a hydrogen coverage between 0 and 1, by Van der Ven and Ceder [54]. (b) Cleavage energy for decohesion along Al(111) and Fe(110) as a function of hydrogen coverage, by Jiang and Carter [55].](/figures/figure-8-hydrogen-effect-on-decohesion-by-quantum-mechanical-23kezcai.webp)
![Figure 13: Normalized threshold stress intensity factor and normalized hydrogen dependent cohesive stress as a function of hydrogen concentration, according to experimental data by Thomas et al. [4], the linear decohesion model and the exponential decohesion model by Serebrinsky et al. [11], with ∆G0b = 30 kJ/mol.](/figures/figure-13-normalized-threshold-stress-intensity-factor-and-3c3wwpbe.webp)
![Figure 4: Reported diffusion coefficients for hydrogen in iron and steel. Adapted from Grong [41].](/figures/figure-4-reported-diffusion-coefficients-for-hydrogen-in-d00c7l0u.webp)

![Figure 7: Cohesive laws by Hillerborg et al. [47], Needleman [48] and Scheider [49].](/figures/figure-7-cohesive-laws-by-hillerborg-et-al-47-needleman-48-1ymh7zoe.webp)
![Figure 11: Relationship between critical cohesive energy at fracture and hydrogen coverage for the polynomial cohesive law by Needleman [48]. Single hydrogen influence denotes hydrogen reduction of the critical cohesive stress. Double hydrogen influence denotes hydrogen reduction of the critical cohesive stress and of the critical separation.](/figures/figure-11-relationship-between-critical-cohesive-energy-at-bq8dksxp.webp)
![Figure 12: Hydrogen influenced cohesive laws from the decohesion model by Liang and Sofronis [10], T 0n is the normal traction and q is a non-dimensional separation parameter.](/figures/figure-12-hydrogen-influenced-cohesive-laws-from-the-32g68x8i.webp)
![Figure 10: Reduction in cohesive energy at different levels of hydrogen coverage for the polynomial cohesive law by Needleman [48], where (a) illustrates hydrogen influence on the cohesive strength only (single) and (b) illustrates hydrogen influence on both the cohesive strength and the critical separation (double).](/figures/figure-10-reduction-in-cohesive-energy-at-different-levels-3rbx36bt.webp)

![Figure 2: Dislocation trap densities according to the work by Kumnick and Johnson [2] and the model by Sofronis et al. [34, 35]. In calculating CT , it is assumed αθT = 1, which accordingly gives the maximum possible hydrogen concentration trapped at dislocations.](/figures/figure-2-dislocation-trap-densities-according-to-the-work-by-bvfr3wyo.webp)
![Figure 15: CTOD-R curves for various deformation rates, comparing experimental tests (symbol) and simulation results (lines) [14].](/figures/figure-15-ctod-r-curves-for-various-deformation-rates-3b0szsgq.webp)
![Figure 9: Hydrogen coverage as a function of hydrogen concentration, for various levels of Gibbs energy (kJ/mol). Plotted according to the Langmuir-McLean isotherm [63].](/figures/figure-9-hydrogen-coverage-as-a-function-of-hydrogen-141pq59o.webp)

