
All figures (11)

Fig. 9 Condenser-side surface temperature difference from the mean, normalized by the device power (profile drawn along the length of the device passing through the center) 
Fig. 2 Schematic diagram of the test section (top inset shows the heater block assembly) 
Fig. 6 (a) Calibrated numerical model estimates of the heat loss and (b) junction-to-ambient temperature differences, as a function of input power for the copper and aluminum heat spreaders 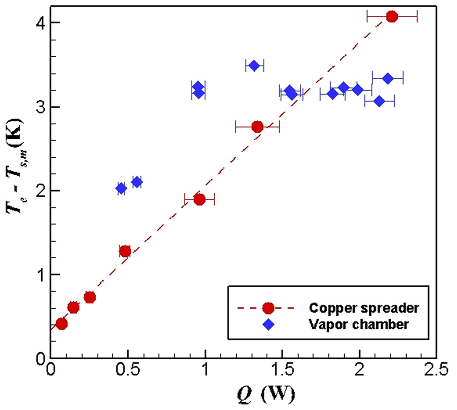
Fig. 7 Thermal resistance as a function of power for the solid copper spreader and the vapor chamber 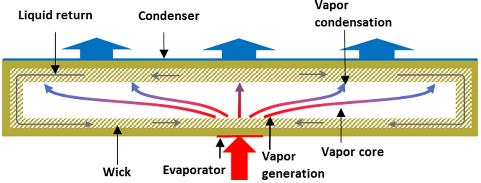
Fig. 1 Schematic diagram of vapor chamber operation 
Fig. 8 Contours of the condenser-side surface temperature for the (a) vapor chamber and (b) solid copper spreader at device heat inputs of approximately 1 W (left) and 2 W (right). Note the different temperature scales. 
Fig. 10 Spreading metric for the prototype vapor chamber relative to the solid copper heat spreader as a function of device heat input 
Table 1 Heat-loss calibration data set 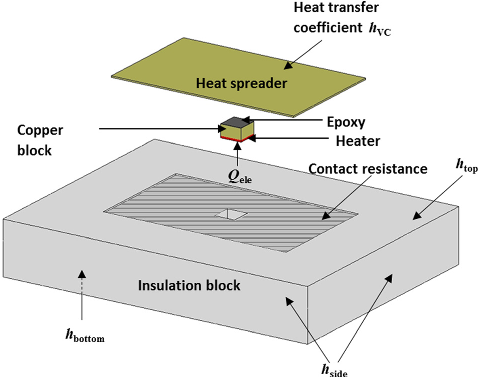
Fig. 4 Exploded view of the numerical conduction model domain and boundary conditions 
Fig. 3 Photograph of the experimental facility 
Fig. 5 Comparison of thermocouple temperatures obtained from experiments against those from the simulations at an electrical heat input of 1 W and ambient temperature of 298.2 K. Each bar is an average temperature from each grouping of thermocouples.


