All figures (12)

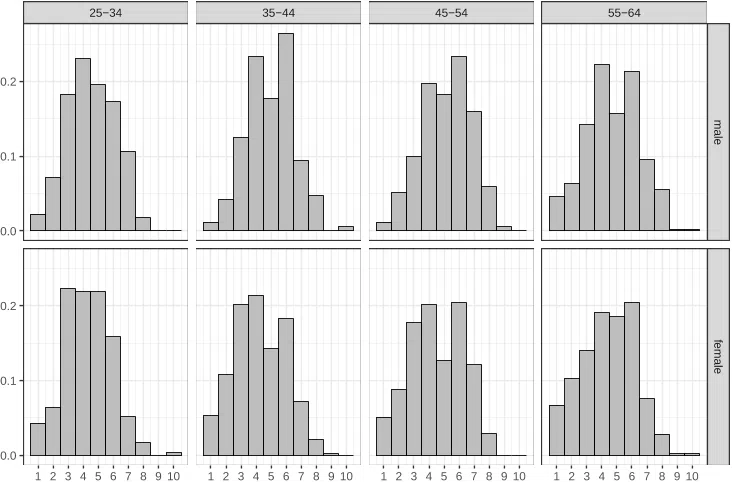
Figure 7: Income evaluation distribution for each social category 
Figure 8: Estimated parameters of objective and subjective income distribution for each social category (posterior mean and interval between 0.05 and 0.95 quantiles) 
Figure 3: Example of objective and subjective income distributions (µo = µs = 5, σo = 1, σs = 2) (left) and p distribution (right) 
Figure 4: Example of trajectory of p∗ according to δ and α (σo = 1) 
Figure 5: Estimated objective and subjective income distribution (left: logged income, right: income) 
Figure 10: Kullback–Leibler distance from objective to subjective income distribution for each social category 
Figure 1: Individual income distribution and fitted lognormal distribution (SSP 2015 data, unit: ten thousand Japanese yen) 
Table 2: Summary of MCMC estimation (different model) 
Table 1: Summary of MCMC estimation (common model) 
Figure 9: Estimated objective and subjective logged income distribution for each social category 
Figure 6: Individual income distribution and fitted lognormal distribution for each social category 
Figure 2: Distribution of relative income evaluation (SSP 2015 data)