
All figures (22)
 Figure 15. First‐year ice. Mean individual pond area for the standard case and snow sensitivity studies.
 Figure 30. Multiyear ice case. Change of area‐averaged surface albedo with time for the standard case and vertical permeability sensitivity studies.
 Figure 29. Multiyear ice case. Change of area‐averaged surface albedo with time for the standard case and ice sensitivity studies.
 Figure 9. (a) Variation in the fractional distribution of surface area with time for the standard multiyear ice case, where mean ice thickness is 2.50 m, standard deviation in ice thickness is 1.10 m, mean snow thickness is 0.30 m, and standard deviation in snow thickness is 0.25 m. Fraction of the surface with a snow cover is light blue, fraction of the surface covered with melt ponds is red, and fraction of the surface with no ice cover (open ocean) is dark blue. (b) Change in mean snow depth (light blue), mean pond depth (red), and mean ice thickness (black) with time for the standard multiyear ice case.
 Figure 12. First‐year ice. Mean individual pond area for the standard case (red) and snow sensitivity studies. Scale for the thick snow case (dotted black) is given on the right‐hand axis.
 Figure 4. Contour plots showing simulated pond depth on first‐year ice during the melt season. Pond depth on the day that ponds initially form (on day 175) and pond coverage before freezeup (on day 210) are shown. Dark blue represents bare ice, and pond depth scale is illustrated in the color bar with red for the deepest ponds. White regions are areas where sea ice has melted through entirely.
 Figure 8. Contour plots showing simulated pond depth on multiyear ice during the melt season. Note the color scale is different from that in Figure 4. Pond depth on the day that ponds initially form (on day 175) and pond coverage before freezeup (on day 210) are shown. Dark blue represents bare ice, and pond depth scale is illustrated in the color bar with red for the deepest ponds. White regions are areas where sea ice has melted through entirely.
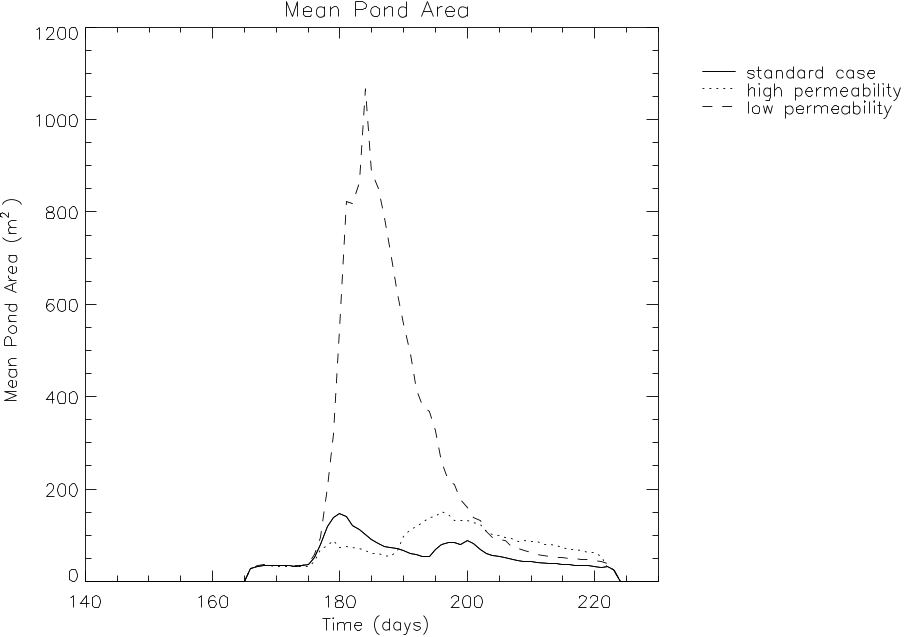 Figure 24. Multiyear ice. Mean individual pond area for the standard case and vertical permeability sensitivity studies.
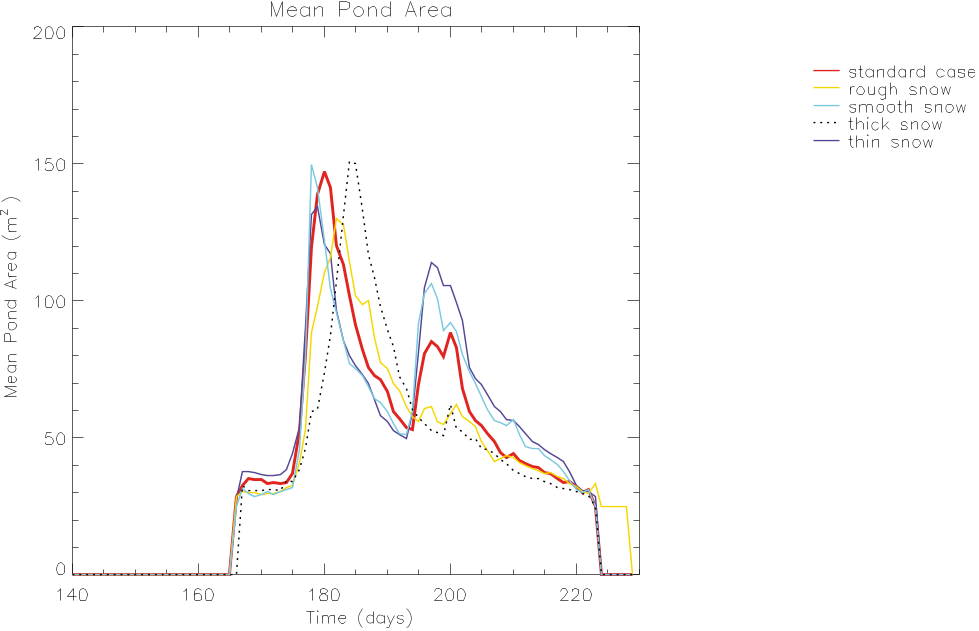 Figure 18. Multiyear ice case. Mean individual pond area for the standard case and snow sensitivity studies.
 Figure 7. Change of area‐averaged surface albedo with time for first‐year ice (solid line) and multiyear ice (dashed line).
 Figure 2. (left) Contour plots of the initial first‐year ice mean ice thickness and snow depth in each cell. (right) The height of the ice surface above sea level and the height of the snow surface above sea level. Surface heights above sea level can be negative.
 Figure 1. A schematic diagram of the cellular automaton. Each cell has an individual ice thickness, H, and has a horizontal surface area of 25 m2. Melting decreases the ice thickness in a cell and allows a pond to form on the surface. Water can drain through a cell or can be transported to adjacent cells.
 Figure 26. First‐year ice case. Change of area‐averaged surface albedo with time for the standard case (solid line) and ice sensitivity studies.
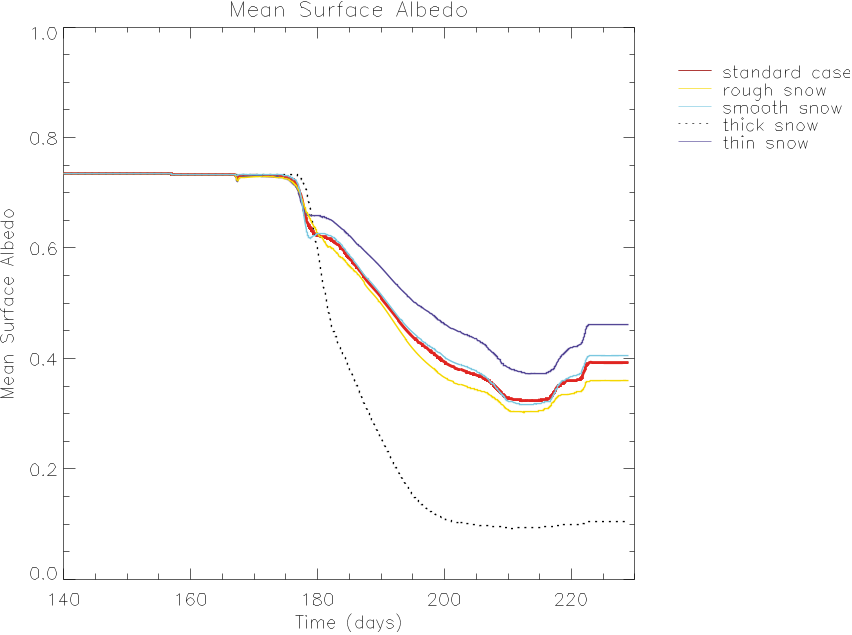 Figure 25. First‐year ice. Change of area‐averaged surface albedo with time for the standard case and snow sensitivity studies.
 Table 2. Summary of Important Results From the Standard First‐Year Ice Case and Sensitivity Studiesa
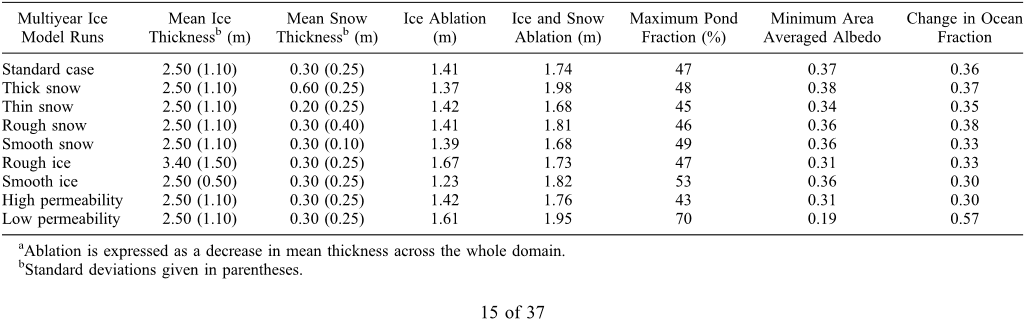 Table 3. Summary of Important Results From the Standard Multiyear Ice Case and Sensitivity Studiesa
 Figure 6. Mean individual pond area for first‐year ice (solid line) and multiyear ice (dashed line).
 Figure 17. First‐year ice. Mean individual pond area for the standard case and snow sensitivity studies. Scale for the low‐permeability case (dashed line) is on the right‐hand axis.
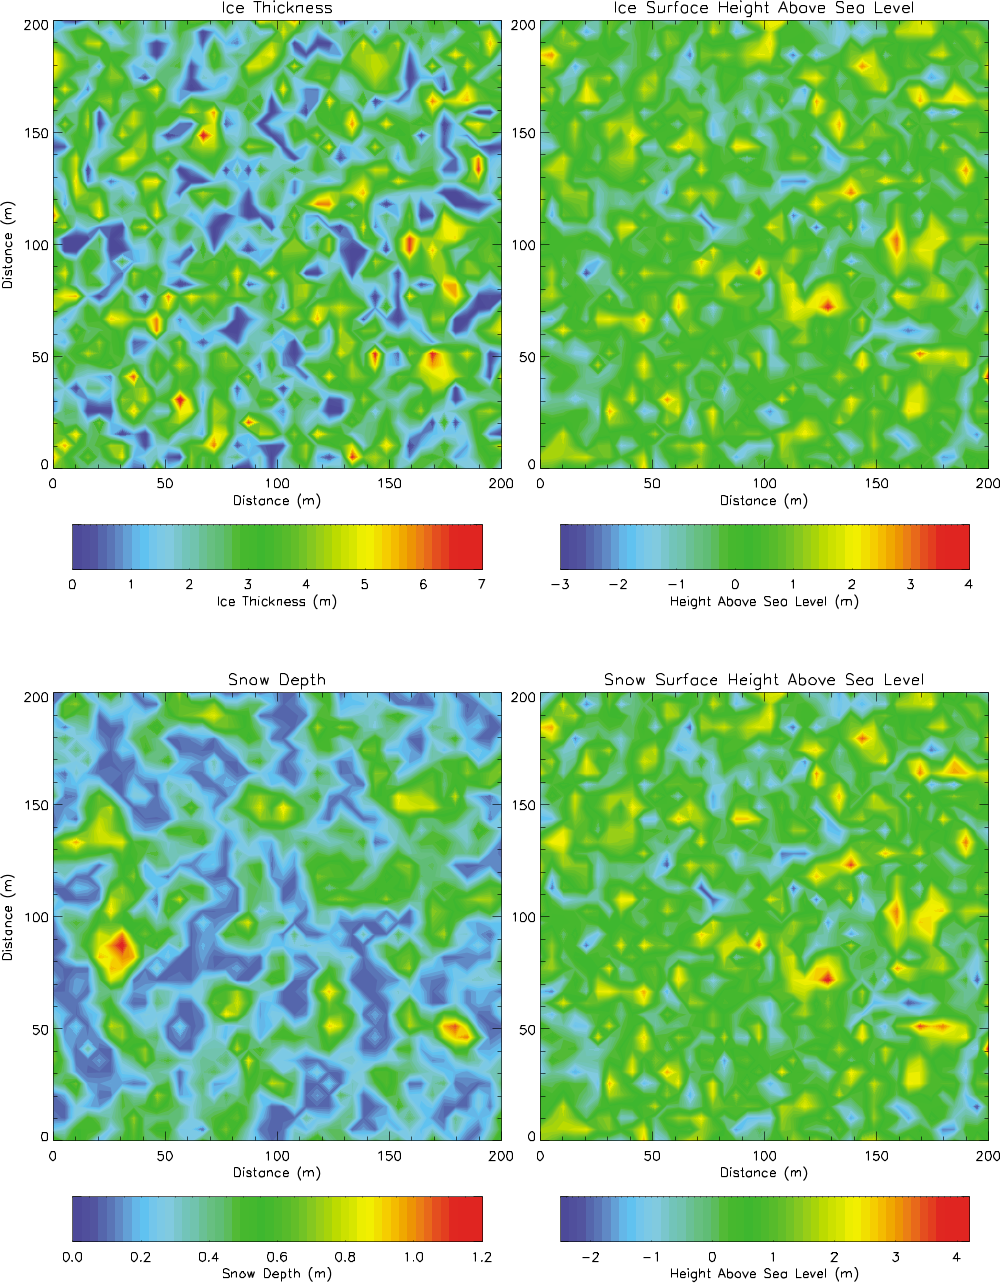 Figure 3. (left) Contour plots of the initial multiyear ice mean ice thickness and snow depth in each cell. (right) The height of the ice surface above sea level and the height of the snow surface above sea level. Surface heights above sea level can be negative.
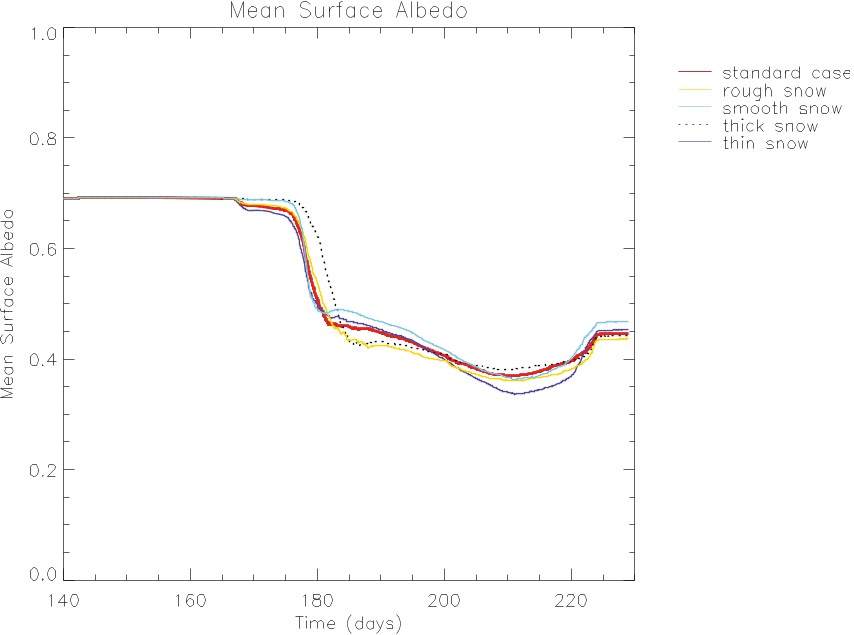 Figure 28. Multiyear ice. Change of area‐averaged surface albedo with time for the standard case and snow sensitivity studies.
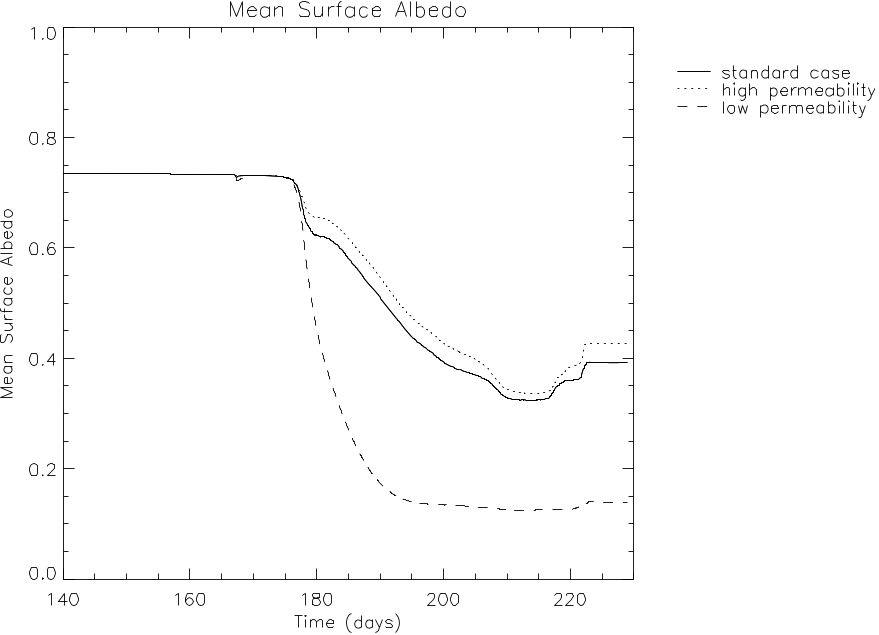 Figure 27. First‐year ice case. Change of area‐averaged surface albedo with time for the standard case and permeability sensitivity studies.
 Figure 21. Multiyear ice. Mean individual pond area for the standard case and ice sensitivity studies.


