
All figures (30)

Fig. 14. Representation of the mass balance of a large newwaste water treatment plant with fresh water output quality. C: collection; DL: large existing DWTPs; DS: small existing DWTPs; ILfs: large industrial consumers with fresh water consumption and sewage discharge; ILfn: large industrial consumers with fresh water consumption and natural water course discharge; S: sink.X 
Fig. 21. Pareto curve obtained for the multi-objective problem. 
Fig. 3. Representation of the mass balance of commercial and residential consumption. DS: existing small DWTPs with surface water consumption; NS: new small DWTPs; MAs: modified small WWTPs with drinking water output quality; NAs: new small WWTPs with drinking water output quality; D: distribution; C: collection; WS: small existing WWTPs; NAs: new small WWTPs with drinking water output quality; NBs: new small WWTPs with fresh water output quality; NCs: new small WWTPs with irrigation water output quality; NDs: new small WWTPs with discharge water output quality; MAs: modified small WWTPs with drinking water output quality; MBs: modified small WWTPs with fresh water output quality; MCs: modified small WWTPs with irrigation water output quality; S: sink. 
Fig. 18. Representation of the mass balance of collection node. RC: residential consumption; CC: commercial consumption; EB: industrial effluent treatment plant connected with large industrial consumers; ELds: related to ILds; ELdn: related to ILdn; WL: large existing DWTPs; NAl: new large WWTPs with drinking water output quality; NBl: new large WWTPs with fresh water output quality; NCl: new large WWTPs with irrigation water output quality; NDl: new large WWTPs with discharge water output quality; MAl: modified large WWTPs with drinking water output quality; MBl: modified large WWTPs with fresh water output quality; MCl: modified large WWTPs with irrigation water output quality; S: sink. 
Fig. 4. Representation of the mass balance of local industrial consumption. DS: existing small DWTPs with surface water consumption; NS: new small DWTPs; MAs: modified small WWTPs with drinking water output quality; NAs: new small WWTPs with drinking water output quality; D: distribution; EB: industrial effluent treatment plant connected with by-district industrial consumers; S: sink. 
Fig. 5. Representation of the mass balance of large industrial consumption supplied with drinking water and discharging into surface water courses. DS: small existing DWTPs; D: distribution; NS: new small DWTPs; NAs: new small WWTPs with drinking water output quality;MAs: modified small WWTPs with drinking water output quality; ELdn: related to ILdn; S: sink.X 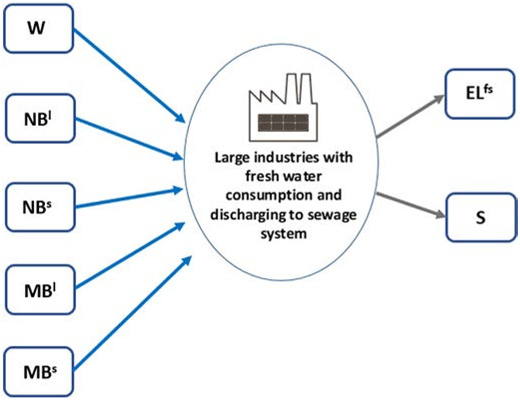
Fig. 6. Representation of the mass balance of large industrial consumption supplied with fresh water and discharging into sewage system. W: water source; NBl: new big WWTPs with fresh water output quality; NBs: new small WWTPs with fresh water output quality; MBl: modified big WWTPs with fresh water output quality; MBs: modified small WWTPs with fresh water output quality; ELfs: related to.ILfs 
Fig. 16. Representation of the mass balance of a large newwaste water treatment plant with discharge in natural course. C: collection; KS: natural surface discharge course; S: sink. 
Fig. 17. Representation of the mass balance of a distribution node. DL: large existing DWTPs; NAl: new large WWTPs with drinking water output quality; MAl: modified large WWTPs with drinking water output quality; NL: new large DWTPs; RC: residential consumption; CC: commercial consumption; PD: urban park irrigation with drinking water consumption; ILds: large industrial consumers with drinking water consumption and sewage discharge; ILdn: large industrial consumers with drinking water consumption and natural water course discharge; IB: by-district industrial consumers; S: sink. 
Fig. 15. Representation of the mass balance of a large newwaste water treatment plant with irrigation water output quality. C: collection; AC: agricultural irrigation; PD: urban park irrigation with drinking water consumption; PF: urban park irrigation with fresh water consumption; S: sink.X 
Fig. 22. Section of the Pareto curve obtained for the multi-objective problem. 
Table 2 Results for mono-objective problems. 
Table 6 Water loss factors in each set 
Table 7 Locations of different districts, considering the lower left corner as the origin of the plan 
Fig. 20. Division of Santiago for the simplified version. Modified image from INE (2018a). 
Fig. 8. Representation of the mass balance of urban park irrigation with fresh water consumption. W; water source; NCl: new large WWTPs with irrigation water output quality; NCs: new small WWTPs with irrigation water output quality; MCl: modified large WWTPs with irrigation water output quality; MCs: modified small WWTPs with irrigation water output quality; KG natural groundwater discharge course; S: sink. 
Fig. 10. Representation of the mass balance of a large existing drinking water treatment plant. W: water source; NBl: new big WWTPs with fresh water output quality; NBs: new small WWTPs with fresh water output quality; MBl: modified big WWTPs with fresh water output quality; MBs: modified small WWTPs with fresh water output quality; D : distribution; S: sink. 
Fig. 7. Representation of the mass balance of agricultural irrigation consumption. W: water source; NCl: new large WWTPs with irrigation water output quality; NCs: new small WWTPs with irrigation water output quality; MCl: modified large WWTPs with irrigation water output quality; MCs: modified small WWTPs with irrigation water output quality; KG natural groundwater discharge course; S: sink. 
Fig. 9. Representation of the mass balance of urban park irrigation with drinking or fresh water consumption. D; distribution; DS: small existing DWTP; NCl: new large WWTPs with irrigation water output quality; NCs: new small WWTPs with irrigation water output quality; MCl: modified large WWTPs with irrigation water output quality; MCs: modified small WWTPs with irrigation water output quality; KG natural groundwater discharge course; S: sink. 
Fig. 1. Diagram representing the methodology followed in the research. 
Table 7 Locations of different districts, considering the lower left corner as the origin of the plan 
Table 10 Teri for each treatment plant 
Table 8 Average diameters for transport cost 
Table 9 Cvri and Cfri for each treatment plant 
Fig. 19. Drinking water consumption during a year. Illustrative example for the comprehension of the text. These values may vary each year. 
Fig. 11. Representation of the mass balance for small existing drinking water treatment plant. W: water source; NBl: new big WWTPs with fresh water output quality; NBs: new small WWTPs with fresh water output quality; MBl: modified big WWTPs with fresh water output quality; MBs: modified small WWTPs with fresh water output quality; RC: residential consumption; CC: commercial consumption; PD: urban park irrigation with drinking water consumption; ILds: large industrial consumers with drinking water consumption and sewage discharge; ILdn: large industrial consumers with drinking water consumption and natural water course discharge; IB: by-district industrial consumers; S: sink. 
Fig. 12. Representation of the mass balance of a large existing wastewater treatment plant. C: collection; KS: natural surface discharge course; S: sink. 
Fig. 13. Representation of the mass balance of a large new wastewater treatment plant with drinking water output quality. C: collection; D: distribution; S: sink.X 
Table 1 Technologies used in different types of recycling plants, depending on the quality required Rodríguez-Miranda (2015); ii) activated sludge: Guo et al. (2014); iii) micro-filtration: M nation: McGivney and Kawamura (2008); vi) trickling filter: McGivney and Kawamura ( et al. (2014); vii) ion exchange: McGivney and Kawamura (2008); ix) filtration: McGivne 
Fig. 2. Graph of the problem. Current and new plants are included as treatment nodes, and the respective consumption within a city.


