scispace - formally typeset
Search or ask a question
Journal ArticleDOI

A Multi-Scale Analysis of 27,000 Urban Street Networks: Every US City, Town, Urbanized Area, and Zillow Neighborhood

TL;DR: This study illustrates the use of OSMnx and OpenStreetMap to consistently conduct street network analysis with extremely large sample sizes, with clearly defined network definitions and extents for reproducibility, and using nonplanar, directed graphs.
Abstract: OpenStreetMap offers a valuable source of worldwide geospatial data useful to urban researchers. This study uses the OSMnx software to automatically download and analyze 27,000 US street networks from OpenStreetMap at metropolitan, municipal, and neighborhood scales - namely, every US city and town, census urbanized area, and Zillow-defined neighborhood. It presents empirical findings on US urban form and street network characteristics, emphasizing measures relevant to graph theory, transportation, urban design, and morphology such as structure, connectedness, density, centrality, and resilience. In the past, street network data acquisition and processing have been challenging and ad hoc. This study illustrates the use of OSMnx and OpenStreetMap to consistently conduct street network analysis with extremely large sample sizes, with clearly defined network definitions and extents for reproducibility, and using nonplanar, directed graphs. These street networks and measures data have been shared in a public repository for other researchers to use.

Summary (3 min read)

Introduction

  • Cross-sectional analysis of American urban form can reveal these artifacts and histories through street networks at metropolitan, municipal, and neighborhood scales.
  • Second, reproducibility has been difficult when the dozens of decisions that go into analysis—such as spatial extents, topological simplification and correction, definitions of nodes and edges, etc.—are ad hoc or only partly reported (e.g. Porta et al., 2006; Strano et al., 2013).
  • First, it describes and demonstrates a new methodology for easily and consistently acquiring, constructing, and analyzing large samples of street networks as nonplanar directed graphs.
  • Third, it investigates with large sample sizes some previous smallersample findings in the research literature.

Methodology

  • Street networks can be conceptualized as primal, directed, nonplanar graphs.
  • Planar graphs may reasonably model the street networks of old European town centers, but poorly model the street networks of modern autocentric cities like Los Angeles or Shanghai with many gradeseparated expressways, bridges, and underpasses (Boeing, 2018b).
  • OSMnx is a Python-based research tool that easily downloads OpenStreetMap data for any place name, address, or polygon in the world, then constructs it into a spatially-embedded graph-theoretic object for analysis and visualization (Boeing, 2017).
  • The authors retain only the urbanized areas subset of these data (i.e. areas with greater than 50,000 population), discarding the small urban clusters subset.
  • The second set of geometries defines their municipal-scale study sites using 51 separate TIGER/Line shapefiles (again, 2016) of US Census Bureau places within all 50 states plus DC.

Street network measures

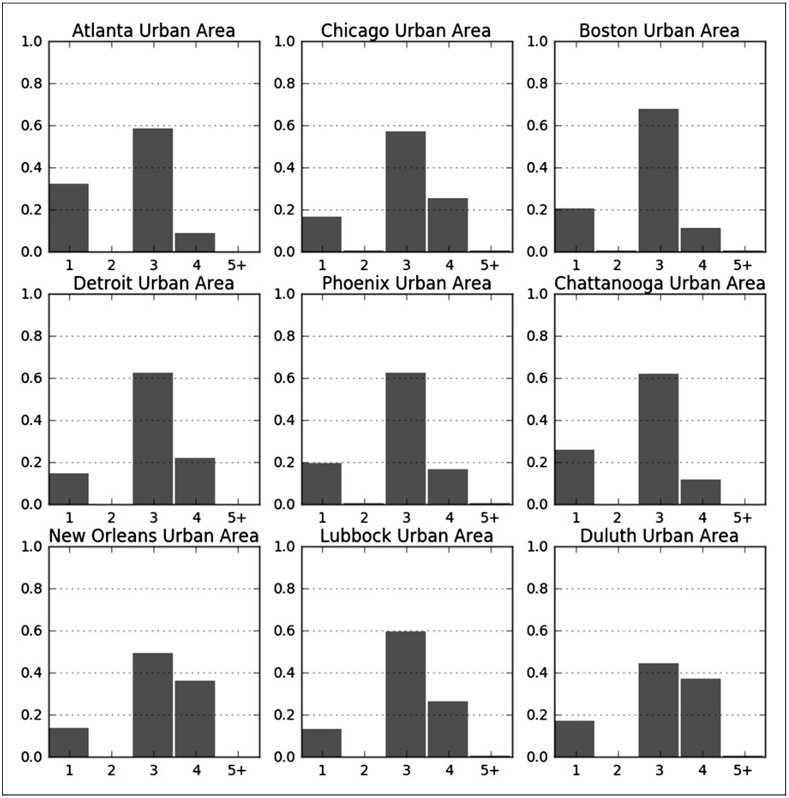
  • The network’s average node degree quantifies connectedness in terms of the average number of edges incident to its nodes.
  • It measures the average number of physical streets that emanate from each node (i.e. intersection or dead-end).
  • In total, this study cross-sectionally analyzes 27,009 networks: 497 urbanized areas’ street networks, 19,655 cities’ and towns’ street networks, and 6857 neighborhoods’ street networks.
  • These sample sizes are larger than those of any previous similar study.

Metropolitan-scale street networks

  • Table 1 presents summary statistics for the entire data set of 497 urbanized areas.
  • The gridlike San Angelo, TX urbanized area has the most streets per node (3.2) on average, and (outside of Puerto Rico, which contains the seven lowest urbanized areas) the sprawling, disconnected Lexington Park, MD urbanized area has the fewest (2.2).
  • The relationship between fine-grained networks and connectedness/gridness is not, however, clear-cut: intersection density has only a weak, positive linear relationship with the proportion of four-way intersections in the urbanized area (r2 ¼ 0:17).
  • Densities and average distances such as intersection density and the average street segment length exhibit only moderate heterogeneity.
  • Due to the substantial variation in urbanized area size, from 25 to 9000 km2, the preceding analysis covers a wide swath of metropolitan types.

Municipal-scale street networks

  • Table 3 presents summary statistics of street network characteristics across the entire data set of 19,655 cities and towns—every incorporated city and town in the US.
  • The latter’s small sample size may limit the generalizability of this finding.
  • These distributions comprise the lognormal, Gumbel, gamma, exponentiated Weibull, Fréchet, power-law, uniform, and exponential distributions.
  • An exception to this general pattern, of course, lies in consistently-sized orthogonal grids filling a city’s incorporated spatial extents.
  • The authors find that such cities are not uncommon in the US, particularly between the Mississippi River and the Rocky Mountains: the Great Plains states are characterized by a unique street network form that is both orthogonal and reasonably dense.

Neighborhood-scale street networks

  • The authors have thus far examined every urban street network in the US at the metropolitan and municipal scales.
  • While the metropolitan scale captures the emergent character of the wider region’s complex system, and the municipal scale captures planning decisions made by a single city government, the neighborhood best represents the scale of individual urban design interventions into the urban form.
  • A few neighborhoods have no intersections within their Zillow-defined boundaries, resulting in a minimum intersection density of 0 across the data set.
  • Nationwide, the typical neighborhood averages 2.9 streets per intersection, reflecting the prevalence of three-way intersections in the US, discussed earlier.
  • Some central San Francisco orthogonal grid networks with many four-way intersections—such as Downtown, Chinatown, and the Financial District—have surprisingly low ANCs: 1.5, 1.3, and 1.6, respectively.

Discussion

  • These findings suggest the influence of planning eras, design paradigms, transportation technologies, topography, and economics on US street network density, resilience, and connectedness.
  • The median average circuity is lower across the neighborhoods data set than across the municipal set, which in turn is lower than across the urbanized areas set.
  • This analysis finds a strong linear relationship, invariant across scales, between total street length and the number of nodes in a network.
  • The spatial signatures of the Homestead Act, successive land use regulations, urban design paradigms, and planning instruments remain clearly etched in these cities’ urban forms and street networks today.

Conclusion

  • First, it presented empirical urban morphological findings from metric and topological analyses of the street networks of every US city/town, urbanized area, and Zillow neighborhood—particularly focusing on density, connectedness, and resilience.
  • Second, its methods demonstrate the use of OSMnx as a new street network research toolkit, suggesting to urban planners and scholars new methods for acquiring and analyzing data consistently and at scale.
  • Third, it built on past findings about the distribution of street segment lengths and the relationship between the total street length and the number of nodes in a network.
  • This study hasmade all of these network datasets—for 497 urbanized areas, 19,655 cities and towns, and 6857 neighborhoods—along with all of their attribute data and morphological measures available in an online public repository for other researchers to study and repurpose.

Did you find this useful? Give us your feedback

Figures (10)

Content maybe subject to copyright    Report

UC Berkeley
UC Berkeley Previously Published Works
Title
A multi-scale analysis of 27,000 urban street networks: Every US city,
town, urbanized area, and Zillow neighborhood
Permalink
https://escholarship.org/uc/item/80n7572n
Journal
Environment and Planning B: Urban Analytics and City Science, 47(4)
ISSN
2399-8083 2399-8091
Author
Boeing, Geoff
Publication Date
2018-08-08
DOI
10.1177/2399808318784595
Data Availability
The data associated with this publication are available at:
https://dataverse.harvard.edu/dataverse/osmnx-street-networks
Peer reviewed
eScholarship.org Powered by the California Digital Library
University of California

Article
Urban Analytics and
City Science
A multi-scale analysis of
27,000 urban street
networks: Every US city,
town, urbanized area, and
Zillow neighborhood
Geoff Boeing
University of California, USA
Abstract
OpenStreetMap offers a valuable source of worldwide geospatial data useful to urban researchers. This
study uses the OSMnx software to automatically download and analyze 27,000 US street networks
from OpenStreetMap at metropolitan, municipal, and neighborhood scales—namely, every US city and
town, census urbanized area, and Zillow-defined neighborhood. It presents empirical findings on US
urban form and street network characteristics, emphasizing measures r eleva nt to graph theory,
transportation, urban design, and morphology such as structure, connectedness, density, centrality,
and resilience. In the past, street network data acquisition and processing have been challenging and ad
hoc. This study illustrates the use of OSMnx and OpenStr eetMap to consistently conduct street
network analysi s with extremely large sample sizes, with clearly defin ed network definiti ons and
extents for repr oducibility, and using nonplanar, directed graphs. These street networks and
measures data have been shared in a public repository for other resear chers to use.
Keywords
GIS, network analysis, OpenStreetMap, street networks, urban form, urban morphology
Introduction
On 20 May 1862, Abraham Lincoln signed the Homestead Act into law, making land across
the United States’ Midwest and Great Plains available for free to applicants (Porterfield,
2005). Under its auspices over the next 70 years, the federal government distributed 10% of
the entire US landmass to private owners in the form of 1.6 million homesteads (Lee, 1979;
Sherraden, 2005). New towns with gridiron street networks sprang up rapidly across the
Great Plains and Midwest, due to both the prevailing urban design paradigm of the day and
the standardized rectilinear town plats used repeatedly to lay out instant new cities
(Southworth and Ben-Joseph, 1997). Through path dependence, the spatial signatures of
Corresponding author:
Geoff Boeing, School of Public Policy and Urban Affairs, Northeastern University, 360 Huntington Ave, 310 Renaissance
Park, Boston, MA 02115, USA.
Email: g.boeing@northeastern.edu
EPB: Urban Analytics and City Science
2020, Vol. 47(4) 590–608
! The Author(s) 2018
Article reuse guidelines:
sagepub.com/journals-permissions
DOI: 10.1177/2399808318784595
journals.sagepub.com/home/epb

these land use laws, design paradigms, and planning instruments can still be seen today in
these cities’ urban forms and street networks. Cross-sectional analysis of American urban
form can reveal these artifacts and histories through street networks at metropolitan,
municipal, and neighborhood scales.
Network analysis is a natural approach to the study of cities as complex systems (Masucci
et al., 2009). The empirical literature on street networks is growing ever richer, but suffers
from some limitations—discussed in detail in Boeing (2017) and summarized here. First,
sample sizes tend to be fairly small due to data availability, gathering, and processing
constraints: most studies in this literature that conduct topological or metric analyses tend
to have sample sizes ranging around 10 to 50 networks (Barthelemy and Flammini, 2008;
Buhl et al., 2006; Cardillo et al., 2006; Strano et al., 2013), which may limit the
generalizability and interpretability of findings. Second, reproducibility has been difficult
when the dozens of decisions that go into analysis—such as spatial extents, topological
simplification and correction, definitions of nodes and edges, etc.—are ad hoc or only
partly reported (e.g. Porta et al., 2006; Strano et al., 2013). Third, and related to the first
two, studies frequently oversimplify to planar or undirected primal graphs for tractability
(e.g. Barthelemy and Flammini, 2008; Buhl et al., 2006; Cardillo et al., 2006; Masucci et al.,
2009), or use dual graphs despite the loss of geographic, metric information (Batty, 2005;
Crucitti et al., 2006a, 2006b; Jiang and Claramunt, 2002; Ratti, 2004).
This study addresses these limitations by conducting a morphological analysis of urban street
networks at multiple scales, with large sample sizes, with clearly defined network definitions and
extents for reproducibility, and using nonplanar, directed graphs. In particular, it examines
27,000 urban street networks—represented as primal, nonplanar, weighted multidigraphs
with possible self-loops—at multiple overlapping scales across the US, focusing on structure,
connectedness, centrality, and resilience. It examines the street networks of every incorporated
city and town, census urbanized area, and Zillow-defined neighborhood in the US. To do so, it
uses OSMnx
1
—a new street network research toolkit (Boeing, 2017)—to download, model, and
analyze these street networks at metropolitan, municipal, and neighborhood scales. These street
networks and measures data sets have been compiled and shared in a public repository at the
Harvard Dataverse
2
for other researchers to use.
The purpose of this paper is threefold. First, it describes and demonstrates a new
methodology for easily and consistently acquiring, constructing, and analyzing large samples
of street networks as nonplanar directed graphs. Second, it presents empirical findings of
descriptive urban morphology for the street networks of every US city, urbanized area, and
Zillow neighborhood. Third, it investigates with large sample sizes some previous smaller-
sample findings in the research literature. This paper is organized as follows. In the next
section, it discusses the data sources, tools, and methods used to collect, model, and analyze
these street networks. Then, it presents findings of the analyses at metropolitan, municipal, and
neighborhood scales. Finally, it concludes with a discussion of these findings and their
implications for street network analysis, urban morphology, and city planning.
Methodology
A network (also called a graph in mathematics) comprises a set of nodes connected to one
another by a set of edges. Street networks can be conceptualized as primal, directed,
nonplanar graphs. A primal street network represents intersections as nodes and street
segments as edges. A directed network has directed edges: that is, edge uv points one-way
from node u to node v, but there need not exist a reciprocal edge vu.Aplanar network can be
represented in two dimensions with its edges intersecting only at nodes (O’Sullivan, 2014;
Boeing 591

Viana et al., 2013). Most street networks are nonplanar—due to grade-separated
expressways, overpasses, bridges, tunnels, etc.—but most quantitative studies of urban
street networks represent them as planar (e.g. Barthelemy and Flammini, 2008; Buhl
et al., 2006; Cardillo et al., 2006; Masucci et al., 2009; Strano et al., 2013) for tractability
because bridges and tunnels are uncommon in some cities. Planar graphs may reasonably
model the street networks of old European town centers, but poorly model the street
networks of modern autocentric cities like Los Angeles or Shanghai with many grade-
separated expressways, bridges, and underpasses (Boeing, 2018b).
Study sites and data acquisition
This study uses OSMnx to download, construct, correct, analyze, and visualize street
network graphs at metropolitan, municipal, and neighborhood scales. OSMnx is a
Python-based research tool that easily downloads OpenStreetMap data for any place
name, address, or polygon in the world, then constructs it into a spatially-embedded
graph-theoretic object for analysis and visualization (Boeing, 2017). OpenStreetMap is a
collaborative worldwide mapping project that makes its spatial data available via various
APIs (Corcoran et al., 2013; Jokar Arsanjani et al., 2015). These data are of high quality and
compare favorably to CIA World Factbook estimates and US Census TIGER/Line data
(Frizzelle et al., 2009; Haklay, 2010; Maron, 2015; Over et al., 2010; Wu et al., 2005; Zielstra
and Hochmair, 2011). In 2007, OpenStreetMap imported the TIGER/Line roads (2005
vintage) and since then, many community-led corrections and improvements have been
made (Willis, 2008). Many of these additions go beyond TIGER/Line’s scope, including
passageways between buildings, footpaths through parks, bike routes, and detailed feature
attributes such as finer-grained street classifiers, speed limits, etc.
To define the study sites and their spatial boundaries, we use three sets of geometries. The
first defines the metropolitan-scale study sites using the 2016 TIGER/Line shapefile of US
Census Bureau urban areas. Each census-defined urban area comprises a set of tracts that
meet a minimum density threshold (US Census Bureau, 2010). We retain only the urbanized
areas subset of these data (i.e. areas with greater than 50,000 population), discarding the
small urban clusters subset. The second set of geometries defines our municipal-scale study
sites using 51 separate TIGER/Line shapefiles (again, 2016) of US Census Bureau places
within all 50 states plus DC. We discard the subset of census-designated places (i.e. small
unincorporated communities) in these data, while retaining every US city and town. The
third set of geometries defines the neighborhood-scale study sites using 42 separate shapefiles
from Zillow, a real estate database company. These shapefiles contain neighborhood
boundaries for major cities in 41 states plus DC. This fairly new data set comprises nearly
7000 neighborhoods, but as Schernthanner et al. (2016) point out, Zillow does not publish
the methodology used to construct these boundaries. However, despite its newness it already
has a track record in the academic literature: Besbris et al. (2015) use Zillow boundaries to
examine neighborhood stigma and Albrecht and Abramovitz (2014) use them to study
neighborhood-level poverty in New York.
For each of these geometries, we use OSMnx to download the (drivable, public) street
network within it, a process described in detail in Boeing (2017) and summarized here. First
OSMnx buffers each geometry by 0.5 km, then downloads the OpenStreetMap ‘‘nodes’’ and
‘‘ways’’ within this buffer. Next, it constructs a street network from these data, corrects the
topology, calculates street counts per node, then truncates the network to the original,
desired polygon. OSMnx saves each of these networks to disk as GraphML and
shapefiles. Finally, it calculates metric and topological measures for each network,
592 EPB: Urban Analytics and City Science 47(4)

summarized below. Such measures extend the toolkit commonly used in urban form studies
(Ewing and Cervero, 2010; Talen, 2003).
Street network measures
Brief descriptions of these OSMnx-calculated measures are discussed here, but extended
technical definitions and algorithms can be found in e.g. (Albert and Baraba
´
si, 2002;
Barthelemy, 2011; Brandes and Erlebach, 2005; Costa et al., 2007; Cranmer et al., 2017;
Dorogovtsev and Mendes, 2002; Newman, 2003, 2010; Trudeau, 1994). The average street
segment length is a linear proxy for block size and specifies the network’s grain. Node density
divides the node count by the network’s area, while intersection density excludes dead-ends to
represent the density of street junctions. Edge density divides the total directed network
length by area, while street density does the same for an undirected representation of the
graph (to not double-count bidirectional streets). Average circuity measures the ratio of edge
lengths to the great-circle distances between the nodes these edges connect, indicating the
street pattern’s curvilinearity (cf. Boeing, 2018a).
The network’s average node degree quantifies connectedness in terms of the average number
of edges incident to its nodes. The average streets per node adapts this for physical form rather
than directed circulation. It measures the average number of physical streets that emanate from
each node (i.e. intersection or dead-end). The distribution and proportion of streets per node
characterize the type, pervasiveness, and spatial dispersal of network connectedness and dead-
ends. Connectivity represents the fewest number of nodes or edges that will disconnect the
network if they are removed and is thus an indicator of resilience. A network’s average node
connectivity (ANC)—the mean number of internally node-disjoint paths between each pair of
nodes—more usefully represents how many nodes must be removed on average to disconnect a
randomly selected pair of nodes (Beineke et al., 2002; Dankelmann and Oellermann, 2003).
Brittle points of vulnerability characterize networks with low average connectivity.
A node’s clustering coefficient represents the ratio between its neighbors’ links and the
maximum number of links that could exist between them (Jiang and Claramunt, 2004;
Opsahl and Panzarasa, 2009). The weighted clustering coefficient weights this by edge
length and the average clustering coefficient is the mean of the clustering coefficients of all
the nodes. Betweenness centrality evaluates how many of the network’s shortest paths pass
through some node (or edge) to indicate its importance (Barthelemy, 2004; Huang et al.,
2016; Zhong et al., 2017). A network’s maximum betweenness centrality (MBC) measures the
share of shortest paths that pass through the network’s most important node: higher
maximum betweenness centralities suggest networks more prone to inefficiency if this
important choke point should fail. Finally, PageRank ranks nodes based on the structure
of incoming links and the rank of the source node (Agryzkov et al., 2012; Brin and Page,
1998; Chin and Wen, 2015; Gleich, 2015; Jiang, 2009).
In total, this study cross-sectionally analyzes 27,009 networks: 497 urbanized areas’ street
networks, 19,655 cities and towns street networks, and 6857 neighborhoods’ street networks.
These sample sizes are larger than those of any previous similar study. The following section
presents the findings of these analyses at metropolitan, municipal, and neighborhood scales.
Results
Metropolitan-scale street networks
Table 1 presents summary statistics for the entire data set of 497 urbanized areas. These
urbanized areas span a wide range of sizes, from the Delano, CA Urbanized Area’s 26 km
2
Boeing 593

Citations
More filters
Journal ArticleDOI
TL;DR: In this article, the authors analyzed the betweenness centrality of nodes in large complex networks and showed that for trees or networks with a small loop density, a larger density of loops leads to the same result.
Abstract: We analyze the betweenness centrality (BC) of nodes in large complex networks. In general, the BC is increasing with connectivity as a power law with an exponent $\eta$. We find that for trees or networks with a small loop density $\eta=2$ while a larger density of loops leads to $\eta<2$. For scale-free networks characterized by an exponent $\gamma$ which describes the connectivity distribution decay, the BC is also distributed according to a power law with a non universal exponent $\delta$. We show that this exponent $\delta$ must satisfy the exact bound $\delta\geq (\gamma+1)/2$. If the scale free network is a tree, then we have the equality $\delta=(\gamma+1)/2$.

477 citations

Journal ArticleDOI
TL;DR: This paper found that people who grew up outside cities were better at navigating in environments that were topologically similar to where they grew up, while growing up in cities with a low street network entropy (for example, Chicago) led to better results at video game levels with a regular layout.
Abstract: The cultural and geographical properties of the environment have been shown to deeply influence cognition and mental health1-6. Living near green spaces has been found to be strongly beneficial7-11, and urban residence has been associated with a higher risk of some psychiatric disorders12-14-although some studies suggest that dense socioeconomic networks found in larger cities provide a buffer against depression15. However, how the environment in which one grew up affects later cognitive abilities remains poorly understood. Here we used a cognitive task embedded in a video game16 to measure non-verbal spatial navigation ability in 397,162 people from 38 countries across the world. Overall, we found that people who grew up outside cities were better at navigation. More specifically, people were better at navigating in environments that were topologically similar to where they grew up. Growing up in cities with a low street network entropy (for example, Chicago) led to better results at video game levels with a regular layout, whereas growing up outside cities or in cities with a higher street network entropy (for example, Prague) led to better results at more entropic video game levels. This provides evidence of the effect of the environment on human cognition on a global scale, and highlights the importance of urban design in human cognition and brain function.

60 citations

Posted Content
TL;DR: This chapter defines complementary measures and study their empirical values and their spatial correlations on European territorial systems, and introduces a generative model of urban growth at a mesoscopic scale.
Abstract: Urban systems are composed by complex couplings of several components, and more particularly between the built environment and transportation networks. Their interaction is involved in the emergence of the urban form. We propose in this chapter to introduce an approach to urban morphology grasping both aspects and their interaction. We first define complementary measures, study their empirical values and their spatial correlations on European territorial systems. The behavior of indicators and correlations suggest underlying non-stationary and multi-scalar processes. We then introduce a generative model of urban growth at a mesoscopic scale. Given a fixed exogenous growth rate, population is distributed following a preferential attachment depending on a potential controlled by the local urban form (density, distance to network) and network measures (centralities and generalized accessibilities), and then diffused in space to capture urban sprawl. Network growth is included through a multi-modeling paradigm: implemented heuristics include biological network generation and gravity potential breakdown. The model is calibrated both at the first (measures) and second (correlations) order, the later capturing indirectly relations between networks and territories.

17 citations


Cites background or methods from "A Multi-Scale Analysis of 27,000 Ur..."

  • ...Boeing (2017a) furthermore shows that statistics of network measures significantly change when the scale of study switches from neighborhood to cities and metropolitan areas....

    [...]

  • ...Recent tools such as the one proposed by Boeing (2017b) provide algorithms to operate an extraction of network topology....

    [...]

Journal ArticleDOI
TL;DR: A typology of measures and indicators for assessing the physical complexity of the built environment at the scale of urban design is developed and extends quantitative measures from city planning, network science, ecosystems studies, fractal geometry, statistical physics, and information theory to the analysis of urban form and qualitative human experience.
Abstract: Complex systems have become a popular lens for analyzing cities and complexity theory has many implications for urban performance and resilience. This paper develops a typology of measures and indicators for assessing the physical complexity of the built environment at the scale of urban design. It extends quantitative measures from city planning, network science, ecosystems studies, fractal geometry, statistical physics, and information theory to the analysis of urban form and qualitative human experience. Metrics at multiple scales are scattered throughout diverse bodies of literature and have useful applications in analyzing the adaptive complexity that both evolves and results from local design processes. In turn, they enable urban designers to assess resilience, adaptability, connectedness, and livability with an advanced toolkit. The typology developed here applies to empirical research of various neighborhood types and design standards. It includes temporal, visual, spatial, scaling, and connectivity measures of the urban form. Today, prominent urban design movements openly embrace complexity but must move beyond inspiration and metaphor to formalize what "complexity" is and how we can use it to assess both the world as-is as well as proposals for how it could be instead.

9 citations


Cites background from "A Multi-Scale Analysis of 27,000 Ur..."

  • ...Shannon entropy indicates that the more types of things there are and the more equal each type’s proportional abundance is, the less predictable the type of any single object will be (Boeing 2018b)....

    [...]

  • ...Network science provides a lens to explore structure through connectivity (Jiang 2016; Boeing 2017, 2018a; Turnbull et al. 2018)....

    [...]

  • ...Boeing (2018b) adapts entropy measures to analyze urban spatial order through street orientations....

    [...]

References
More filters
Journal ArticleDOI
TL;DR: In this paper, a simple model based on the power-law degree distribution of real networks was proposed, which was able to reproduce the power law degree distribution in real networks and to capture the evolution of networks, not just their static topology.
Abstract: The emergence of order in natural systems is a constant source of inspiration for both physical and biological sciences. While the spatial order characterizing for example the crystals has been the basis of many advances in contemporary physics, most complex systems in nature do not offer such high degree of order. Many of these systems form complex networks whose nodes are the elements of the system and edges represent the interactions between them. Traditionally complex networks have been described by the random graph theory founded in 1959 by Paul Erdohs and Alfred Renyi. One of the defining features of random graphs is that they are statistically homogeneous, and their degree distribution (characterizing the spread in the number of edges starting from a node) is a Poisson distribution. In contrast, recent empirical studies, including the work of our group, indicate that the topology of real networks is much richer than that of random graphs. In particular, the degree distribution of real networks is a power-law, indicating a heterogeneous topology in which the majority of the nodes have a small degree, but there is a significant fraction of highly connected nodes that play an important role in the connectivity of the network. The scale-free topology of real networks has very important consequences on their functioning. For example, we have discovered that scale-free networks are extremely resilient to the random disruption of their nodes. On the other hand, the selective removal of the nodes with highest degree induces a rapid breakdown of the network to isolated subparts that cannot communicate with each other. The non-trivial scaling of the degree distribution of real networks is also an indication of their assembly and evolution. Indeed, our modeling studies have shown us that there are general principles governing the evolution of networks. Most networks start from a small seed and grow by the addition of new nodes which attach to the nodes already in the system. This process obeys preferential attachment: the new nodes are more likely to connect to nodes with already high degree. We have proposed a simple model based on these two principles wich was able to reproduce the power-law degree distribution of real networks. Perhaps even more importantly, this model paved the way to a new paradigm of network modeling, trying to capture the evolution of networks, not just their static topology.

18,415 citations

Journal ArticleDOI
TL;DR: Developments in this field are reviewed, including such concepts as the small-world effect, degree distributions, clustering, network correlations, random graph models, models of network growth and preferential attachment, and dynamical processes taking place on networks.
Abstract: Inspired by empirical studies of networked systems such as the Internet, social networks, and biological networks, researchers have in recent years developed a variety of techniques and models to help us understand or predict the behavior of these systems. Here we review developments in this field, including such concepts as the small-world effect, degree distributions, clustering, network correlations, random graph models, models of network growth and preferential attachment, and dynamical processes taking place on networks.

17,647 citations


"A Multi-Scale Analysis of 27,000 Ur..." refers background in this paper

  • ...…OSMnx-calculated measures are discussed here, but extended technical definitions and algorithms can be found in e.g. (Albert and Barabási, 2002; Barthelemy, 2011; Brandes and Erlebach, 2005; Costa et al., 2007; Cranmer et al., 2017; Dorogovtsev and Mendes, 2002; Newman, 2003, 2010; Trudeau, 1994)....

    [...]

Journal ArticleDOI
01 Apr 1998
TL;DR: This paper provides an in-depth description of Google, a prototype of a large-scale search engine which makes heavy use of the structure present in hypertext and looks at the problem of how to effectively deal with uncontrolled hypertext collections where anyone can publish anything they want.
Abstract: In this paper, we present Google, a prototype of a large-scale search engine which makes heavy use of the structure present in hypertext. Google is designed to crawl and index the Web efficiently and produce much more satisfying search results than existing systems. The prototype with a full text and hyperlink database of at least 24 million pages is available at http://google.stanford.edu/. To engineer a search engine is a challenging task. Search engines index tens to hundreds of millions of web pages involving a comparable number of distinct terms. They answer tens of millions of queries every day. Despite the importance of large-scale search engines on the web, very little academic research has been done on them. Furthermore, due to rapid advance in technology and web proliferation, creating a web search engine today is very different from three years ago. This paper provides an in-depth description of our large-scale web search engine -- the first such detailed public description we know of to date. Apart from the problems of scaling traditional search techniques to data of this magnitude, there are new technical challenges involved with using the additional information present in hypertext to produce better search results. This paper addresses this question of how to build a practical large-scale system which can exploit the additional information present in hypertext. Also we look at the problem of how to effectively deal with uncontrolled hypertext collections where anyone can publish anything they want.

14,696 citations


"A Multi-Scale Analysis of 27,000 Ur..." refers background in this paper

  • ...Finally, PageRank ranks nodes based on the structure of incoming links and the rank of the source node (Agryzkov et al., 2012; Brin and Page, 1998; Chin and Wen, 2015; Gleich, 2015; Jiang, 2009)....

    [...]

Book
25 Mar 2010
TL;DR: This book brings together for the first time the most important breakthroughs in each of these fields and presents them in a coherent fashion, highlighting the strong interconnections between work in different areas.
Abstract: The scientific study of networks, including computer networks, social networks, and biological networks, has received an enormous amount of interest in the last few years. The rise of the Internet and the wide availability of inexpensive computers have made it possible to gather and analyze network data on a large scale, and the development of a variety of new theoretical tools has allowed us to extract new knowledge from many different kinds of networks.The study of networks is broadly interdisciplinary and important developments have occurred in many fields, including mathematics, physics, computer and information sciences, biology, and the social sciences. This book brings together for the first time the most important breakthroughs in each of these fields and presents them in a coherent fashion, highlighting the strong interconnections between work in different areas. Subjects covered include the measurement and structure of networks in many branches of science, methods for analyzing network data, including methods developed in physics, statistics, and sociology, the fundamentals of graph theory, computer algorithms, and spectral methods, mathematical models of networks, including random graph models and generative models, and theories of dynamical processes taking place on networks.

10,567 citations


"A Multi-Scale Analysis of 27,000 Ur..." refers background in this paper

  • ...…OSMnx-calculated measures are discussed here, but extended technical definitions and algorithms can be found in e.g. (Albert and Barabási, 2002; Barthelemy, 2011; Brandes and Erlebach, 2005; Costa et al., 2007; Cranmer et al., 2017; Dorogovtsev and Mendes, 2002; Newman, 2003, 2010; Trudeau, 1994)....

    [...]

Journal ArticleDOI
TL;DR: A meta-analysis of the built environment-travel literature existing at the end of 2009 is conducted in order to draw generalizable conclusions for practice, and finds that vehicle miles traveled is most strongly related to measures of accessibility to destinations and secondarily to street network design variables.
Abstract: Problem: Localities and states are turning to land planning and urban design for help in reducing automobile use and related social and environmental costs. The effects of such strategies on travel demand have not been generalized in recent years from the multitude of available studies. Purpose: We conducted a meta-analysis of the built environment-travel literature existing at the end of 2009 in order to draw generalizable conclusions for practice. We aimed to quantify effect sizes, update earlier work, include additional outcome measures, and address the methodological issue of self-selection. Methods: We computed elasticities for individual studies and pooled them to produce weighted averages. Results and conclusions: Travel variables are generally inelastic with respect to change in measures of the built environment. Of the environmental variables considered here, none has a weighted average travel elasticity of absolute magnitude greater than 0.39, and most are much less. Still, the combined effect o...

3,551 citations


"A Multi-Scale Analysis of 27,000 Ur..." refers background in this paper

  • ...Such measures extend the toolkit commonly used in urban form studies (Ewing and Cervero, 2010; Talen, 2003)....

    [...]

Frequently Asked Questions (2)
Q1. What are the contributions mentioned in the paper "A multi-scale analysis of 27,000 urban street networks: every us city, town, urbanized area, and zillow neighborhood" ?

This study uses the OSMnx software to automatically download and analyze 27,000 US street networks from OpenStreetMap at metropolitan, municipal, and neighborhood scales—namely, every US city and town, census urbanized area, and Zillow-defined neighborhood. This study illustrates the use of OSMnx and OpenStreetMap to consistently conduct street network analysis with extremely large sample sizes, with clearly defined network definitions and extents for reproducibility, and using nonplanar, directed graphs. 

This study hasmade all of these network datasets—for 497 urbanized areas, 19,655 cities and towns, and 6857 neighborhoods—along with all of their attribute data and morphological measures available in an online public repository for other researchers to study and repurpose.