
All figures (22)
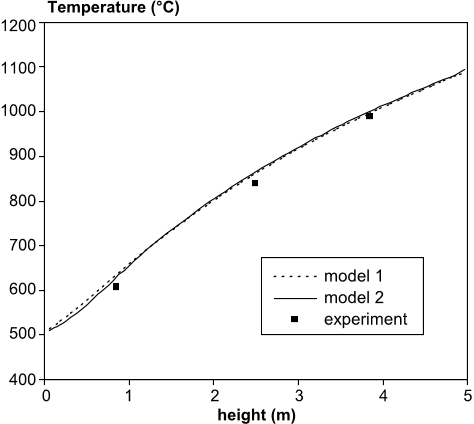
Fig. 15. Wall temperature profile in the middle of the period. ![Fig. 4. Evolution of the dimensionless velocity profile as a function of the distance to the wall when Grz = 8.44 · 1010: comparison between our numerical results and Ref. [28].](/figures/fig-4-evolution-of-the-dimensionless-velocity-profile-as-a-1sv6bmi9.png)
Fig. 4. Evolution of the dimensionless velocity profile as a function of the distance to the wall when Grz = 8.44 · 1010: comparison between our numerical results and Ref. [28]. 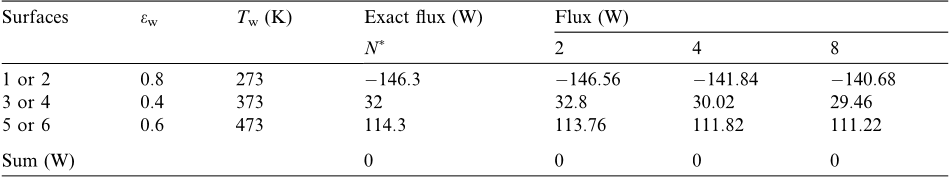
Table 2 Results of the test for a transparent medium ![Fig. 3. Evolution of the local heat transfer coefficient along the plate: comparison between our numerical results and Ref. [28].](/figures/fig-3-evolution-of-the-local-heat-transfer-coefficient-along-9sj31awp.png)
Fig. 3. Evolution of the local heat transfer coefficient along the plate: comparison between our numerical results and Ref. [28]. 
Fig. 8. Dimensions of the enclosure used for testing the radiative model. 
Table 3 Results of the test for a semi-transparent medium 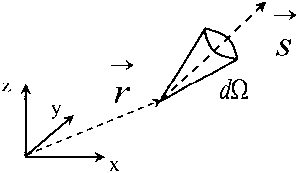
Fig. 2. Definition of the variables used in the radiation calculations. ![Fig. 7. Axial evolution of the dimensionless heat transfer coefficient: comparison between our numerical results and experimental values from [32].](/figures/fig-7-axial-evolution-of-the-dimensionless-heat-transfer-14c4v5c6.png)
Fig. 7. Axial evolution of the dimensionless heat transfer coefficient: comparison between our numerical results and experimental values from [32]. 
Table 4 Absolute error of the suction pyrometers ( C) 
Fig. 11. A–A view of the test regenerator showing the 36 sub-channels. 
Fig. 12. Distribution of the thermocouples in the wing of a cruciform. ![Fig. 6. Evolution of turbulence intensity as a function of the distance to the wall when Grz = 8.44 · 1010: comparison between our numerical results and Ref. [28].](/figures/fig-6-evolution-of-turbulence-intensity-as-a-function-of-the-13cb56uz.png)
Fig. 6. Evolution of turbulence intensity as a function of the distance to the wall when Grz = 8.44 · 1010: comparison between our numerical results and Ref. [28]. 
Table 6 Working conditions 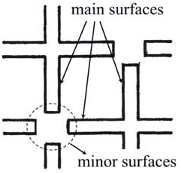
Fig. 13. Scheme of an elementary channel. 
Table 5 Comparison of calculation methods for geometric data 
Fig. 10. Tip of one of the suction pyrometers. 
Fig. 9. Test section of our experimental regenerator. ![Fig. 5. Evolution of the dimensionless temperature profile as a function of the distance to the wall when Grz = 8.44 · 1010: comparison between our numerical results and Ref. [28].](/figures/fig-5-evolution-of-the-dimensionless-temperature-profile-as-182tce17.png)
Fig. 5. Evolution of the dimensionless temperature profile as a function of the distance to the wall when Grz = 8.44 · 1010: comparison between our numerical results and Ref. [28]. ![Table 7 Experimental results of Lagarenne [9] for an elementary channel](/figures/table-7-experimental-results-of-lagarenne-9-for-an-3l2pi8ny.png)
Table 7 Experimental results of Lagarenne [9] for an elementary channel ![Fig. 14. Profile of the regenerated heat flux for the cold period: comparison between our numerical models and the experimental data from [9].](/figures/fig-14-profile-of-the-regenerated-heat-flux-for-the-cold-14fk42lr.png)
Fig. 14. Profile of the regenerated heat flux for the cold period: comparison between our numerical models and the experimental data from [9]. 
Table 8 Comparison of global energy exchanged for an elementary channel (models 1 and 2 have been presented in Section 2) 
Fig. 1. Sketch of the flow in the channel of a glass furnace regenerator during each hot (a) and cold (b) period.

![Fig. 4. Evolution of the dimensionless velocity profile as a function of the distance to the wall when Grz = 8.44 · 1010: comparison between our numerical results and Ref. [28].](/figures/fig-4-evolution-of-the-dimensionless-velocity-profile-as-a-1sv6bmi9.webp)

![Fig. 3. Evolution of the local heat transfer coefficient along the plate: comparison between our numerical results and Ref. [28].](/figures/fig-3-evolution-of-the-local-heat-transfer-coefficient-along-9sj31awp.webp)


![Fig. 7. Axial evolution of the dimensionless heat transfer coefficient: comparison between our numerical results and experimental values from [32].](/figures/fig-7-axial-evolution-of-the-dimensionless-heat-transfer-14c4v5c6.webp)


![Fig. 6. Evolution of turbulence intensity as a function of the distance to the wall when Grz = 8.44 · 1010: comparison between our numerical results and Ref. [28].](/figures/fig-6-evolution-of-turbulence-intensity-as-a-function-of-the-13cb56uz.webp)


![Fig. 5. Evolution of the dimensionless temperature profile as a function of the distance to the wall when Grz = 8.44 · 1010: comparison between our numerical results and Ref. [28].](/figures/fig-5-evolution-of-the-dimensionless-temperature-profile-as-182tce17.webp)
![Table 7 Experimental results of Lagarenne [9] for an elementary channel](/figures/table-7-experimental-results-of-lagarenne-9-for-an-3l2pi8ny.webp)
![Fig. 14. Profile of the regenerated heat flux for the cold period: comparison between our numerical models and the experimental data from [9].](/figures/fig-14-profile-of-the-regenerated-heat-flux-for-the-cold-14fk42lr.webp)

