


22
Published by Class Professional Publishing: www.classprofessional.co.uk
Reich, T and Budka, M, British Paramedic Journal 2019, vol. 4(2) 22–30
Proof of concept for a syndromic
surveillance system based on routine
ambulance records in the South West
of England, for the inuenza season
2016/2017
Thilo Reich*
Bournemouth University
ORCID iD: https://orcid.org/0000-0001-7705-0987
Marcin Budka
Bournemouth University
ORCID iD: http://orcid.org/0000-0003-0158-6309
Clinical audit
* Corresponding author:
Thilo Reich, Department of Computing and Informatics, Bournemouth University, Fern Barrow, Poole, Dorset BH12 5BB, UK.
Email: thilo-reich@runbox.com
British Paramedic Journal
2019, vol. 4(2) 22–30
© The Author(s) 2019
ISSN 1478–4726
https://doi.org/10.29045/14784726.2019.09.4.2.22
Reprints and permissions:
info@class.co.uk
The BPJ is the journal of the
College of Paramedics:
www.collegeofparamedics.co.uk
Abstract
Introduction: The introduction of electronic patient records in the ambulance service provides
new opportunities to monitor the population. Approximately 36% of patients presenting to
English ambulance services are discharged at scene. Ambulance records are therefore an ideal
data source for syndromic early event detection systems to monitor infectious disease in the
pre-hospital population. It has been previously found that tympanic temperature records can be
used to detect inuenza outbreaks in emergency departments. This study aimed to determine
whether routine tympanic temperature readings collected by ambulance crews can be used to
detect seasonal inuenza.
Methods: Here we show that temperature readings do allow the detection of seasonal inuenza
before methods applied to conventional data sources. The counts of pyretic patients were used
to calculate a sliding case ratio as a measurement to detect seasonal inuenza outbreaks. This
method does not rely on conventional thresholds and can be adapted to the data.
Results: The data collected correlated with seasonal inuenza. The 2016/2017 outbreak was
detected up to nine weeks before other surveillance programmes. The results show that
ambulance records can be a useful data source for biosurveillance systems.
Conclusion: Temperature readings from routinely collected ambulance patient records can be
used as a surveillance tool for febrile diseases.
Keywords
biosurveillance; electronic patient records; outbreak detection; pre-hospital data

Reich, T and Budka, M 23
Reich, T and Budka, M, British Paramedic Journal 2019, vol. 4(2) 22–30
between 35.5 and 42.0°C, and 0.3°C outside this range
(Braun, 2007, 2013). The definition of pyrexia used in
this evaluation was 37.8–42.0°C (Bordonaro et al., 2016;
Obermeyer, Samra, & Mullainathan, 2017). All tempera-
ture readings outside of the manufacturer’s specifications
were excluded as erroneous values.
Data processing
All data were processed using MATLAB R2017a (The
MathWorks, MA, USA). Daily and weekly counts of call
volumes and pyretic patient numbers were used as a ba-
sis for all following data analyses. Due to the staggered
deployment of the electronic devices within SWASFT,
ePCRs were not available in all areas until 5 January
2016, so the evaluation was limited to the period between
5 January 2016 and 30 April 2017. Since the start of the
2015/2016 flu season was not captured, all detections
were run against the 2016/2017 flu peak.
Data smoothing
As the daily patient count varies considerably from
one day to another resulting in a noisy time series, the
data were smoothed using an exponential moving aver-
age (EMA), with an averaging window of 21 days. This
window size was chosen because the incubation period
of influenza can be up to 3.6 days (Lessler et al., 2009),
followed by an onset of symptoms and transmission pe-
riod of the virus which can last up to 10 days in hospital
(Fielding, Kelly, Mercer, & Glass, 2014; Ip et al., 2015;
Suess et al., 2012). This means a patient could be conta-
gious for up to 14 days following infection. Accounting
for the incubation period, a secondary patient could show
symptoms 18 days after the infection of the index case.
Therefore, the averaging window size was chosen to be
21 days as this allows for some leeway.
An EMA method was also used because it gives data
points a greater weighting if they are closer to the present
compared to samples from the more distant past (Fricker,
2010). This places greater emphasis on data from new pa-
tients rather than on older data points.
The weekly summed data were used without smooth-
ing as well as an EMA of three weeks equivalent to three
sample points.
Baseline calculation
The weekly sums and the smoothed daily and weekly
counts of pyretic patients were binned with bin-counts cal-
culated using the Freedman–Diaconis Rule (Freedman &
Diaconis, 1981). The centre of the most frequent bin
range was determined and will be referred to as baseline.
Normalisation
Figures showing variables of different scales were nor-
malised using min–max normalisation to represent the
Introduction
The digitisation of ambulance healthcare records has cre-
ated a large pre-hospital data source that to date is mostly
untapped. South Western Ambulance Service NHS Foun-
dation Trust (SWASFT) introduced electronic patient
care records (ePCRs) in March 2015, making it possible
to access and monitor all data recorded in near real-time.
Infections usually result in pyrexia (Bartfai & Conti,
2011; Hasday, Fairchild, & Shanholtz, 2000), making body
temperature-based surveillance systems non-specific, but
sensitive to virtually any pyrexia-causing disease. Tem-
perature screening has been applied during outbreaks
of infectious diseases, such as severe acute respiratory
syndrome (SARS) (Samaan, Patel, Spencer, & Roberts,
2004; Syed, Sopwith, Regan, & Bellis, 2003). It has also
been demonstrated that the monitoring of body tempera-
ture on its own makes it possible to detect outbreaks
of seasonal flu in emergency departments (Bordonaro
et al., 2016). However, if syndromic surveillance systems
were put in place in ambulance services, it might be pos-
sible to detect outbreaks of disease while it is still in the
community, prior to detection by hospital-based systems
( Barishansky, 2009).
This study aimed to demonstrate that it is possible to
utilise ambulance service ePCRs to detect disease out-
breaks, solely based on tympanic temperature readings.
The objectives of this study were:
• To establish if the pre-hospital tympanic temper-
ature readings mirrored the seasonal influenza
peak during the 2016/2017 season.
• To evaluate a method adapted from Singh,
Savill, Ferguson, Robertson and Woolhouse
(2010) using case ratios (CRs) and its applica-
bility as an early event detection (EED) system
when applied to pre-hospital tympanic tempera-
ture readings.
Methods
Data extraction
All ePCRs created between 1 January 2015 and 30 April
2017, with an incident postcode matching the county of
Devon or Cornwall, were eligible for inclusion. Records
without valid postcodes were excluded. The postcode, re-
cord creation date, tympanic temperature and age were
requested and provided by the SWASFT Clinical Infor-
mation and Records Office.
Temperature measurement in South
Western Ambulance Service NHS
Foundation Trust
The most commonly used temperature probes within
SWASFT are the Braun ThermoScan 7 IRT6520 and
ThermoScan 5 IRT4520. Both devices have a measure-
ment range of 34.0–42.2°C with an accuracy of 0.2°C

24 British Paramedic Journal 4(2)
Reich, T and Budka, M, British Paramedic Journal 2019, vol. 4(2) 22–30
an increase in cases, which remains > 1 for at least one
week. It has to be noted that outbreak here refers to an
increase of pyrexia cases caused by an unspecified infec-
tious agent and could be caused by several agents circu-
lating at the same time.
A delay of one week was chosen because it includes
the incubation time, meaning that secondary patients ex-
posed to influenza should have developed pyrexia within
one week (Lessler et al., 2009).
Using CR
d
as an indication of an outbreak start is based
on the assumption that a disease becomes uncontrolled
once CR becomes larger than 1 (Woolhouse et al., 2001).
The final change of CR
d
to > 1, that is not followed
by a recovery to < 1 within one week until the curve
reaches its peak, is considered the ascending period of
the outbreak.
Results
Data characteristics
Between 1 January 2015 and 30 April 2017, there were
375,740 ePCRs generated by SWASFT. Once records
with missing postcodes, faulty formatting and abnormally
high or low temperature values were excluded, 346,063
remained. As previously mentioned, the saturation data
for ePCR deployment were not reached until 5 January
2016 and so records before this were omitted, resulting in
280,452 records available which were used for all follow-
ing analyses. Of those, 44,472 met the study definition
for pyrexia (Figure 1).
Temperatures recorded were in the range of 21.0–
47.0°C, with a mean temperature of 36.9°C. Tempera-
tures outside of this range were assumed to be errors.
The temperature-based exclusion removed eight patients
(0.0023%) with temperatures of > 42.0°C, three of those
within the 42.0–42.2°C range. The lower temperature
cut-off removed 98 patients (0.028%) with temperatures
of < 32.0°C.
The dataset from the date of saturation was made up
of 54.0% female and 46.0% male patients. The age range
was 0–115 years (one outlier of 864 years was excluded),
with a mean age of 60 and a median age of 68.
The estimated population in 2016 was 779,834 for
Devon and 553,687 for Cornwall. The combined popula-
tion was 1,333,521 (Office for National Statistics, 2017).
In comparison to the estimated age distribution of Devon
and Cornwall, the SWASFT data were skewed towards
the elderly and young children (Figure 2).
Inuenza detection
To establish whether seasonal influenza was detectable,
weekly case numbers were compared with weekly sentinel
influenza cases recorded by the ECDC in England. Sen-
tinel surveillance data are based on a network of selected
healthcare facilities, which select patients with symp-
toms suggesting influenza for laboratory confirmation.
values on a scale between 0 and 1, where the maximum
value is assigned to 1.
Reference datasets
To establish whether the seasonal influenza outbreak is
detectable in the ePCR data, these data were compared to
a reference dataset of weekly influenza cases in England
obtained from the European Centre for Disease Preven-
tion and Control (ECDC).
Calculation of the modied
case ratio CR
d
The ability of an infectious agent to spread within a
population can be described using the basic reproduction
number or R
0
. This value indicates the mean secondary
infections caused by each infected host in a naïve popu-
lation without immunity against the infectious agent.
R
0
is calculated retrospectively using information about
the number of contacts of each infected individual and
the resulting secondary infections (Breban, Vardavas, &
Blower, 2007).
Methods exist to estimate R
0
from the progress of a dis-
ease outbreak, which rely on knowledge about the trans-
mission characteristics of the infectious agent gathered
from previous outbreaks (Althaus, 2014; Griffin, Garske,
Ghani, & Clarke, 2011; Potapov, Merrill, Pybus, &
Lewis, 2015). As this evaluation only focuses on abnor-
mal temperature readings, the infection that could be re-
sponsible is not possible to determine and so cannot be
compared directly to previous outbreaks. However, Singh
et al. (2010) demonstrated that weekly CRs can be used
as an indirect measure of R
0
and allow detection of pan-
demic influenza outbreak, and so this method was adapted
in this study by using several different time frames com-
pared solely to the weekly CR.
To distinguish between different time frames used to
calculate the modified CR in this evaluation, it is referred
to as CR
d
where d represents the chosen time step be-
tween observations in days, using the calculation shown
in the following equation:
where n
y
represents the number of pyretic patients at the
days of observation with the previously defined time step
between observations in days. Thus, n
y
1 represents the first
observation and n
y
2 the latest. Here this method is applied
to pyrexia cases as an unspecific substitute for infection.
Outbreak denition
In this study, the outbreak definition is focused on the
ascending slope, representing an increase in pyrexia case
numbers. Therefore, the definition of an outbreak is the
persistent transition from CR
d
< 1 to CR
d
> 1 indicating
24 British Paramedic Journal 4(2)
Reich, T and Budka, M, British Paramedic Journal 2019, vol. 4(2) 22–30
an increase in cases, which remains > 1 for at least one
week. It has to be noted that outbreak here refers to an
increase of pyrexia cases caused by an unspecified infec-
tious agent and could be caused by several agents circu-
lating at the same time.
A delay of one week was chosen because it includes
the incubation time, meaning that secondary patients ex-
posed to influenza should have developed pyrexia within
one week (Lessler et al., 2009).
Using CR
d
as an indication of an outbreak start is based
on the assumption that a disease becomes uncontrolled
once CR becomes larger than 1 (Woolhouse et al., 2001).
The final change of CR
d
to > 1, that is not followed
by a recovery to < 1 within one week until the curve
reaches its peak, is considered the ascending period of
the outbreak.
Results
Data characteristics
Between 1 January 2015 and 30 April 2017, there were
375,740 ePCRs generated by SWASFT. Once records
with missing postcodes, faulty formatting and abnormally
high or low temperature values were excluded, 346,063
remained. As previously mentioned, the saturation data
for ePCR deployment were not reached until 5 January
2016 and so records before this were omitted, resulting in
280,452 records available which were used for all follow-
ing analyses. Of those, 44,472 met the study definition
for pyrexia (Figure 1).
Temperatures recorded were in the range of 21.0–
47.0°C, with a mean temperature of 36.9°C. Tempera-
tures outside of this range were assumed to be errors.
The temperature-based exclusion removed eight patients
(0.0023%) with temperatures of > 42.0°C, three of those
within the 42.0–42.2°C range. The lower temperature
cut-off removed 98 patients (0.028%) with temperatures
of < 32.0°C.
The dataset from the date of saturation was made up
of 54.0% female and 46.0% male patients. The age range
was 0–115 years (one outlier of 864 years was excluded),
with a mean age of 60 and a median age of 68.
The estimated population in 2016 was 779,834 for
Devon and 553,687 for Cornwall. The combined popula-
tion was 1,333,521 (Office for National Statistics, 2017).
In comparison to the estimated age distribution of Devon
and Cornwall, the SWASFT data were skewed towards
the elderly and young children (Figure 2).
Influenza detection
To establish whether seasonal influenza was detectable,
weekly case numbers were compared with weekly sentinel
influenza cases recorded by the ECDC in England. Sen-
tinel surveillance data are based on a network of selected
healthcare facilities, which select patients with symp-
toms suggesting influenza for laboratory confirmation.
values on a scale between 0 and 1, where the maximum
value is assigned to 1.
Reference datasets
To establish whether the seasonal influenza outbreak is
detectable in the ePCR data, these data were compared to
a reference dataset of weekly influenza cases in England
obtained from the European Centre for Disease Preven-
tion and Control (ECDC).
Calculation of the modified
case ratio CR
d
The ability of an infectious agent to spread within a
population can be described using the basic reproduction
number or R
0
. This value indicates the mean secondary
infections caused by each infected host in a naïve popu-
lation without immunity against the infectious agent.
R
0
is calculated retrospectively using information about
the number of contacts of each infected individual and
the resulting secondary infections (Breban, Vardavas, &
Blower, 2007).
Methods exist to estimate R
0
from the progress of a dis-
ease outbreak, which rely on knowledge about the trans-
mission characteristics of the infectious agent gathered
from previous outbreaks (Althaus, 2014; Griffin, Garske,
Ghani, & Clarke, 2011; Potapov, Merrill, Pybus, &
Lewis, 2015). As this evaluation only focuses on abnor-
mal temperature readings, the infection that could be re-
sponsible is not possible to determine and so cannot be
compared directly to previous outbreaks. However, Singh
et al. (2010) demonstrated that weekly CRs can be used
as an indirect measure of R
0
and allow detection of pan-
demic influenza outbreak, and so this method was adapted
in this study by using several different time frames com-
pared solely to the weekly CR.
To distinguish between different time frames used to
calculate the modified CR in this evaluation, it is referred
to as CR
d
where d represents the chosen time step be-
tween observations in days, using the calculation shown
in the following equation:
CR
n
n
n
y
y
=
2
1
where n
y
represents the number of pyretic patients at the
days of observation with the previously defined time step
between observations in days. Thus, n
y
1 represents the first
observation and n
y
2 the latest. Here this method is applied
to pyrexia cases as an unspecific substitute for infection.
Outbreak definition
In this study, the outbreak definition is focused on the
ascending slope, representing an increase in pyrexia case
numbers. Therefore, the definition of an outbreak is the
persistent transition from CR
d
< 1 to CR
d
> 1 indicating
4_CA_Reich.indd 24 05/08/19 3:05 PM

Reich, T and Budka, M 25
Reich, T and Budka, M, British Paramedic Journal 2019, vol. 4(2) 22–30
The non-sentinel surveillance is a passive system, using
patient samples for laboratory confirmation of a variety
of sources which are not necessarily from patients show-
ing symptoms of an influenza infection (European Centre
for Disease Prevention and Control, 2018).
Public Health England (PHE) monitors influenza cases
with different surveillance programmes. The data are
based on diagnoses from hospitals as well as from GPs.
They are separated into influenza-like illnesses (ILI) and
acute respiratory infections (ARI) (Public Health Eng-
land, 2017).
Both peaks seen for the influenza season 2015/2016
and 2016/2017 correspond to the data collected by the
ECDC. The comparison to the non-sentinel data shows an
earlier peak of the ePCR data in the 2016/2017 flu season
(Figure 3).
PHE recorded a peak of ILI consultations in week 1,
2017; ARI consultations peaked in week 52, 2016. This
correlates temporally with the peaks seen in the daily
summed data (week 1, 2017) and the weekly summed
data (week 51, 2016), indicating that the seasonal influ-
enza outbreak progresses similarly in both datasets and
therefore allowing a direct comparison.
The different mean-CR
d
depending on
window sizes
To establish the effect of different choices of d, the as-
cending area of pyrexia cases peak in 2016/2017 was
used to calculate a sliding CR
d
with varying d for the as-
cending slope where pyrexia cases increased.
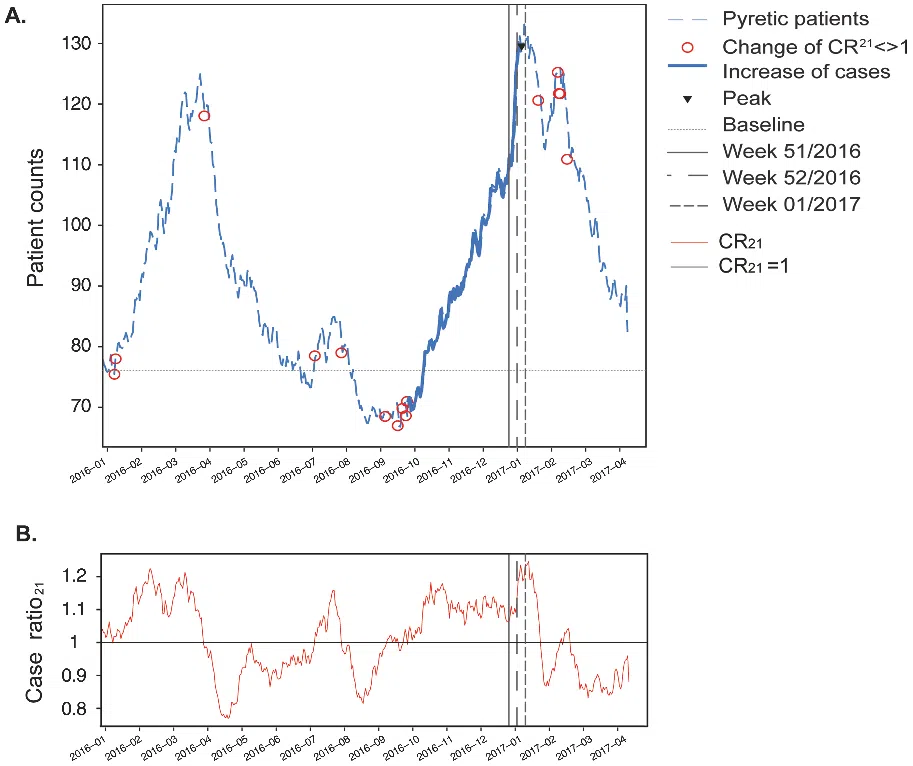
CR
21
was chosen here as its values for the ascending
slope were greater than 1, thus fitting the assumption
ePCR records
375,740
1 January 2015
to
30 April 2017
Extracted records
368,621
98.2%
Missing
postcodes
Faulty
formatting
Between
32 and 42°C
Imported records
346,169
93.9%
Exclusion of
hypothermia and
hyperpyrexia
346,063
92.1%
Patients from
saturation date
5 January 2016
to
30 April 2017
74.64%
Pyretic Patients
44,472
15.86%
Figure 1. Summary of electronic patient care records
available for analysis, including reasons for exclusion.
Note: ePCR = electronic patient care record.
Figure 2. Age distribution for the general population in Devon and Cornwall in comparison to the patients attended by
ambulance crews.
Note: SWASFT = South Western Ambulance Service NHS Foundation Trust.

26 British Paramedic Journal 4(2)
Reich, T and Budka, M, British Paramedic Journal 2019, vol. 4(2) 22–30
make the approach comparable between daily and weekly
counts, the same window is used for both sampling rates,
meaning a window of 21 days or 3 weeks for the daily
and weekly counts, respectively (Figure 4).
that the slope represents an increase in case numbers. Al-
though it included more outliers than CR
14
, it caused less
delay than CR
28
, therefore it was chosen as a trade-off
between timely detection and reduction of noise. To
Figure 3. Normalised weekly pyrexia recorded in electronic patient care records compared to u
cases in England as reported by the European Centre for Disease Prevention and Control.
Note: ECDC = European Centre for Disease Prevention and Control; SWASFT = South Western Ambulance
Service NHS Foundation Trust. The vertical lines indicate the detection of the peaks by Public Health England
for the following syndromes: inuenza-like illness in week 1, 2017; acute respiratory illness in week 52, 2016.
Case ratio
Different choices of timesteps (d)
Figure 4. Comparison of different case ratios calculated with different time steps (d).