
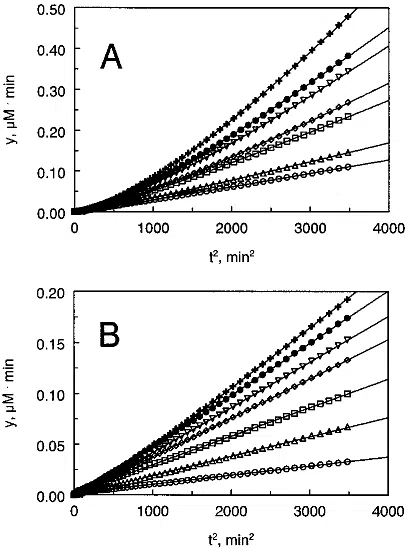
FIGURE 4: Release ofp-nitroaniline after cleavage of the chromogenic plasmin substrate S-2251 in the reaction medium with tPA and Pg presented in the transformed coordinatesy versust2 (see eqs 3 and 6). Solid lines show the best fit according to eq 6 and model 2. (A) The dependence was obtained for bovine tPA. The symbols O, 4, 0, ), 3, b, and + correspond to the Pg concentrations 0.084, 0.19, 0.30, 0.41, 0.52, 0.63, and 0.84µM, respectively. (B) The dependence was obtained for human tPA. The symbolsO, 4, 0, ), 3, b, and + correspond to the Pg concentrations 0.084, 0.19, 0.30, 0.41, 0.52, 0.63, and 0.73µM, respectively.
...read more