
All figures (18)

Figure 10: Mean velocity for the 10 normal subjects in CCA, 
Figure 8: Vmax at the peak systolic time point according to 
Figure 6: Spatiotemporal velocity pro le evolution in the CCA diameter (3.3 cm before bifurcation, l=128 according to Figure 
Figure 12: Velocity di erence between Vpixel located at the three key sites in CCA, ECA and ICA and VMRImax over the 
Table 6 
Table 7 
Table 5 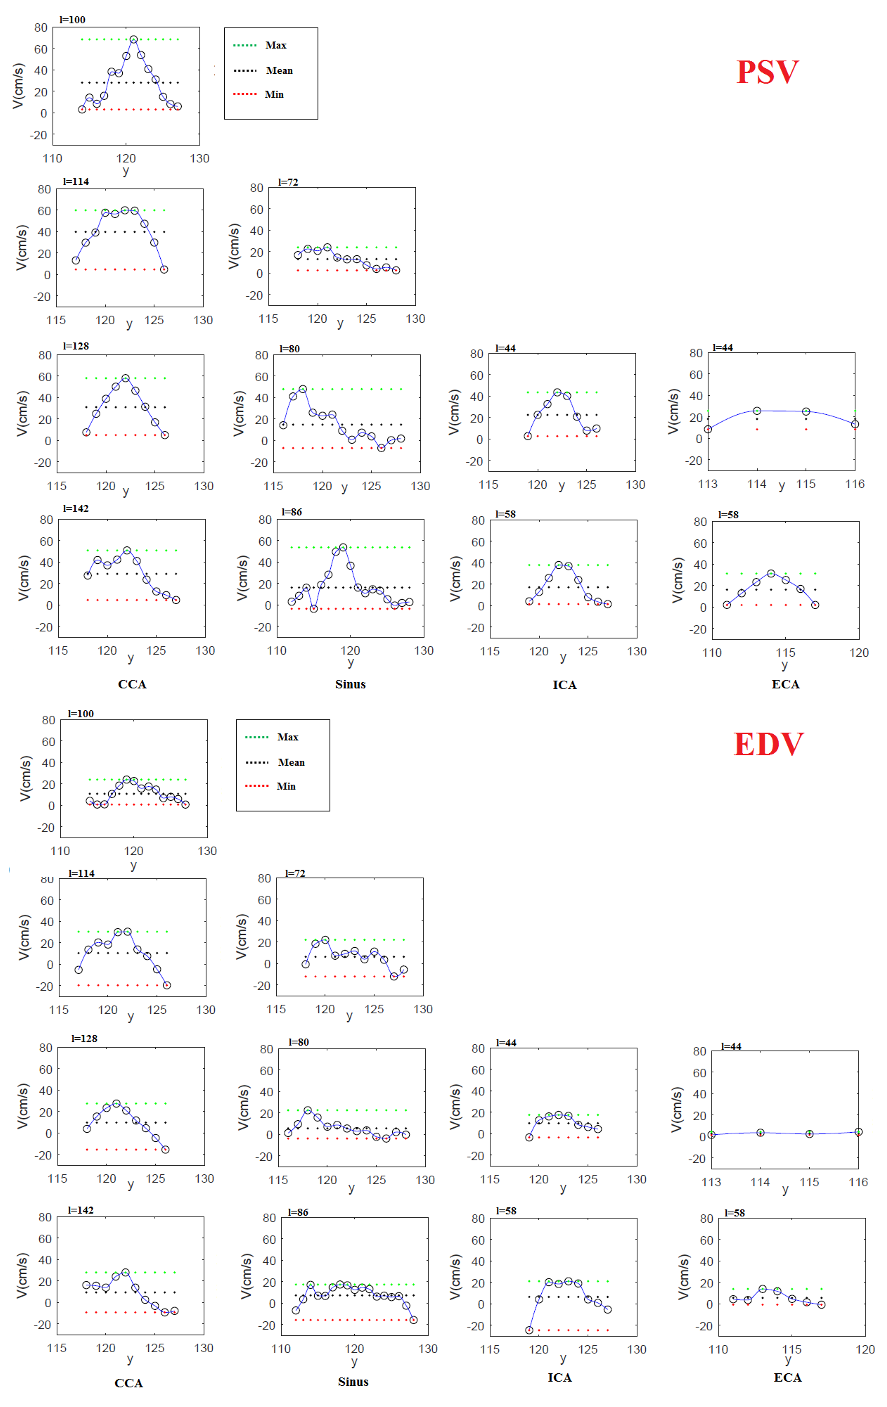
Figure 7: PSV and EDV pro les at several levels (see Figure 5) of the bifurcation carotid artery according to PC-MRI data for 
Table 4 
Table 2 
Table 3 
Figure 1: Medical imaging modalities to study the blood ow in the carotid artery for one of the ten subjects. Left: MRI 
Figure 2: Reconstructed patient-speci c carotid artery models 
Table 1 
Figure 9: Measured and numerical velocity waveforms of CCA, 
Figure 4: CCA velocity waveform extracted from MRI data 
Figure 11: Bland-Altman plots of PSV and EDV comparing simulation and measurements for CCA, ECA and ICA. Left: PC-MRI 
Figure 5: Localization of extracted velocity pro les along the


