A Spatiotemporal exploration and 3D modeling of blood flow in healthy carotid artery bifurcation from two modalities: Ultrasound-Doppler and phase contrast MRI.
TL;DR: The measured velocities showed that blood flow keeps a parabolic sectional profile distal from CCA, ECA and ICA, while being quite disturbed in the carotid sinus with a significant decrease in magnitude making this site very prone to atherosclerosis.
About: This article is published in Computers in Biology and Medicine.The article was published on 2020-03-01 and is currently open access. It has received 4 citations till now.
Summary (3 min read)
Jump to: [1. Introduction] – [2. Material and Methods] – [2.1.1. PC-MR imaging] – [2.1.2. US-Doppler imaging] – [2.2. PC-MRI Velocity profile extraction] – [2.3. Arterial model reconstruction and computational mesh generation] – [2.4. Boundary conditions] – [2.5. Simulated velocity profiles] – [3. Results] – [3.1. Analysis of PC-MRI velocities] – [3.2. Analysis of PC-MRI and US velocity measurements] – [3.3. Analysis of simulated velocity waveforms] – [4. Discussion] and [5. Conclusion]
1. Introduction
- Vascular maladies may be caused by thrombi and can lead to stroke [18].
- Blood flow analysis can confirm the presence of a local vessel anomaly, its impact on the blood flow pattern and its possible evolution [7, 26, 25, 10].
- Few studies compared velocity measurements in the carotid artery between US-Doppler and PC-MRI [15, 16, 38, 28].
- Section 2 describes the imaging data sets and the analysis methodology.
2. Material and Methods
- The arterial geometrical model was extracted from MR anatomical images and the hemodynamic modeling was performed from the obtained models.
- The velocity waveforms from both PC-MRI and US-Doppler were extracted at three locations: the right CCA, ECA and ICA.
2.1.1. PC-MR imaging
- The PC-MR images were acquired with a clinical 1.5 T Philips system (Ingenia, Philips medical systems, Best, the Netherlands) using 20 channels phased array head neck spine coil.
- Fifty 2D anatomical images were acquired in axial orientation to cover cervical region Arij Debbich et al.: Preprint submitted to Elsevier Page 2 of 16 Figure 3: Growing carotid scanning windows size.
- Key points are located in: CCA at 1.5 cm from the bifurcation, ECA and ICA: at 1 cm from the bifurcation.
- The ideal velocity encoding (VENC) should be high enough to avoid aliasing and as low as possible to reduce velocity noise [47].
- The total scan time for an exam was approximately 7 minutes.
2.1.2. US-Doppler imaging
- All US-Doppler exams were conducted by a radiologist (B.H) with 10 years’ experience in cardiovascular imaging.
- Clinical General Electric ultrasound systems (LOGIQ E9, GE Healthcare, Milwaukee, WI, USA) with 9 MHz linear probe were used.
- US-Doppler images were matrices of dimension 720x960.
- To extract the velocity waveform, the authors chose a profile of one cardiac cycle , fixed the two profile axes and selected 14 feature points on these profiles including PSV and EDV.
- The USDoppler profile point digitization was performed using the Engauge Digitizer software [29].
2.2. PC-MRI Velocity profile extraction
- Three velocity waveforms were extracted from PC-MRI at locations CCA, ECA, and ICA during a cardiac cycle which was divided into 14 time points.
- The following values were deduced from the interpolated waveforms: - Velocity variation at a given pixel VMRIpixel .
- - Maximum velocity at a given pixel within its eight neighbors VMRImax.-.
- As the MRI and the US-Doppler examinations were not acquired at the same time, there might be some physiological variations [16].
2.3. Arterial model reconstruction and computational mesh generation
- The geometrical characteristics of all the vessel segments for the ten subjects are given in Table1.
- The carotid lumen was separated from the rest of the structures by applying an intensity threshold.
- The model was further re-meshed using an Octree surface refinement based on prismatic wall [20].
- Some studies adopted the rheological Newtonian behavior for the carotid artery (stationary viscosity) because it is simpler than the hemodynamic modeling with a non Newtonian behavior and arguing it has aminor impact on the results [33].
2.4. Boundary conditions
- One of their objectives was to investigate the impact of the inlet boundary conditions on the simulation results.
- These inlets were pulsed over time and were composed of the two usual physiological phases during a cardiac cycle: systole and diastole.
- Velocity profile for every subject was matched to VMRImax inthe CCA, 3.3 cm from the carotid bifurcation to conform to the CCA dimension in the geometrical model.
- (5) where ℎt is the maximal parabolic magnitude matching the VMRImax or VUS at time t. (xc , yc) and R are respectively thecenter coordinates and the radius of the CCA inlet section.
- All meshes brought velocity profiles close to each other.
2.5. Simulated velocity profiles
- Simulated velocity profiles Vsim were extracted at threelocations of the carotid bifurcation: 1.5 cm from the bifurcation in the CCA and 1 cm up the bifurcation in ECA and ICA.
- The values were extracted using CFD-POST from ANSYS software.
3. Results
- Velocity waveforms were extracted from PC-MRI (VMRImax, VMRIpixel and VMRImean) and Doppler-US (VUS)imaging data for ten volunteers at the three localizations of the carotid artery.
- The first one, called VSIM_MRI, is based on PC-MRI data VMRImaxprofile used as inlet boundary condition.
- The authors did not integrate the pixel-based PC-MRI velocity VMRIpixel in the tables since its values werebetween those of VMRImax and VMRImean and were noisier.
3.1. Analysis of PC-MRI velocities
- Typical measured velocity waveforms from PC-MRI are presented in Figure 4. ECA and ICA relative to V MRImax for PC-MRI (up) and V US for US-Doppler (down).
- The authors noted that a velocity profile over the CCA diameter at a given location was almost parabolic for all time points . and end diastolic (ED) time points every centimeter from the CCA to the carotid sinus, ICA and ECA .
- There were significant variations de- tected in the carotid sinus site: a progressive decrease of the maximum velocity and a disruption of the profile shape.
3.2. Analysis of PC-MRI and US velocity measurements
- Unlike the difference observed by Harloff et al.[15] for ICA, PSV of PC-MRI was on average less than US-Doppler by about 17.6%.
- The same tendency was observed in CCA PSV (mean difference of 21.8 cm/s), to a much lower extent for CCA EDV .
- Diastolic velocity profiles are less dissimilar except in ICA for the two modalities.
- The mean velocity waveforms of the ten volunteers relative to PC-MRI and US-Doppler in CCA, ECA and ICA are plotted in Figure 10.
3.3. Analysis of simulated velocity waveforms
- Overall, the numerical velocity waveforms were closer to the PC-MRI ones independent of the arterial input function considered (US or MRI).
- The numerical velocities were compared to in vivo measurements through the global and the local indicators defined in section 3 .
- The mean difference between measurements and simulation for PSV and EDV was greater.
- From Tables 2, 3 and 4, it can be noted that the mean PSV of the ten subjects from VSIM_MRImax is lower than that from VSIM_US.
4. Discussion
- The PC-MRI velocity behavior in the carotid bifurcation was investigated in time and space.
- It was observed that the velocity estimation increased with the window size up to maximum .
- This can be difficult to achieve when dealing with a PC-MRI and US-Doppler comparative study like ours for two reasons related to US measurements: i) lack of convenient accessibility for radiologists.
- The arterial wall pulsatility has not been considered as it would have brought many additional issues with less mastered modeling methods (Fluid Structure Interaction).
- Locally, the mean difference between VSIM_MRImax and VMRImax varied from 22% to 32% according to the local dif-ference metric at peak systole PSV and from 29% to 37%according to the local difference metric at end diastole EDV.
5. Conclusion
- The authors investigated blood velocity quantification over the carotid artery bifurcation from PC-MRI and US-Doppler, and 3D velocity modeling from these modalities.
- PC-MRI data analysis showed velocity across the section of the artery follows a parabolic profile except in the sinus region.
- Overall, the authors found numerical velocities based on PC-MRI velocity inlet closer to measurements than those based on Doppler-US velocity inlet.
- Therefore, from their experiments, the PC-MRI-based hemodynamic modeling approach could be reasonably more realistic.
Did you find this useful? Give us your feedback
Figures (18)

Figure 10: Mean velocity for the 10 normal subjects in CCA, 
Figure 8: Vmax at the peak systolic time point according to 
Figure 6: Spatiotemporal velocity pro le evolution in the CCA diameter (3.3 cm before bifurcation, l=128 according to Figure 
Figure 12: Velocity di erence between Vpixel located at the three key sites in CCA, ECA and ICA and VMRImax over the 
Table 6 
Table 7 
Table 5 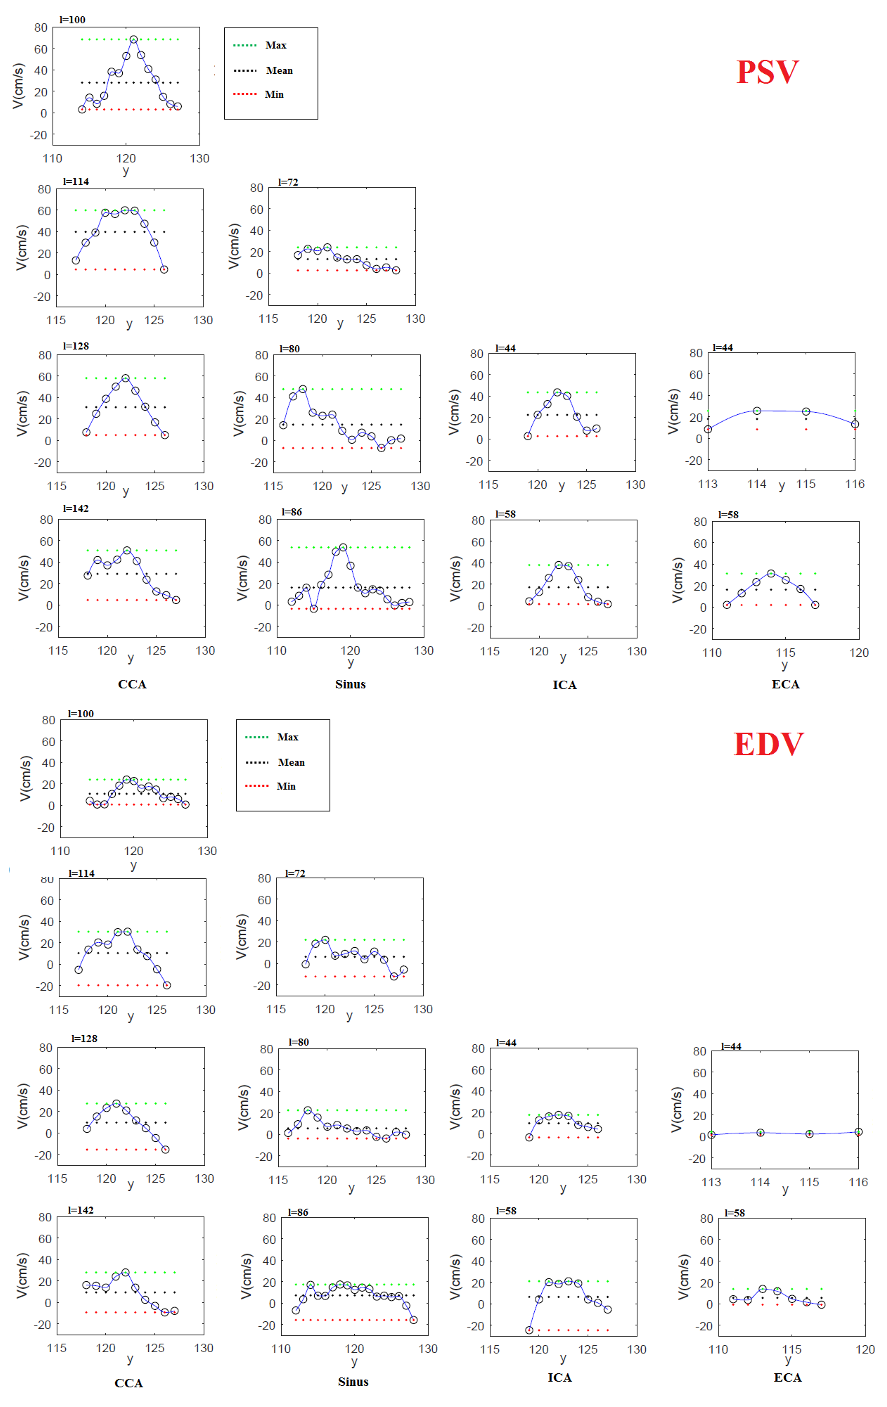
Figure 7: PSV and EDV pro les at several levels (see Figure 5) of the bifurcation carotid artery according to PC-MRI data for 
Table 4 
Table 2 
Table 3 
Figure 1: Medical imaging modalities to study the blood ow in the carotid artery for one of the ten subjects. Left: MRI 
Figure 2: Reconstructed patient-speci c carotid artery models 
Table 1 
Figure 9: Measured and numerical velocity waveforms of CCA, 
Figure 4: CCA velocity waveform extracted from MRI data 
Figure 11: Bland-Altman plots of PSV and EDV comparing simulation and measurements for CCA, ECA and ICA. Left: PC-MRI 
Figure 5: Localization of extracted velocity pro les along the


Citations
More filters
TL;DR: In this paper, a wavy-walled arterial structure is simulated by applying a vorticity-stream function formulation approach. And the transformed dimensionless equations are further discretized using the finite difference method by developing the Peaceman-Rachford alternating direction implicit (P-R ADI) scheme.
4 citations
TL;DR: In this article, the authors proposed a largeeddy simulation (LES) approach to carry out the hemodynamics and medication dispersion and deposition studies inside the descending aorta. And the analysis reveals that the flow separation causes a preferential deposition and build-up of low-density lipoproteins (LDL) on the arterial surface.
Abstract: The hemodynamics plays a key role in the transport processes, in the blood stream, and thus, on the accumulation and deposition of lipids and medication on the vessel’s wall. Therefore, understanding the hemodynamics of the arterial veins can advance the understanding of transport phenomena and prediction of deposition and buildup of the low-density lipoproteins (LDL) and particulate medication, on the arterial surfaces. Previous studies have showed that for pulsatile flow, laminar-turbulent flow transition may occur, particularly during intense exercises. Experimental and computational studies, of hemodynamics and transport phenomena, pose significant challenges due to the complex aorta’s geometry and arterial fluid dynamics. In the present study, we propose a large-eddy simulation (LES), computational approach, to carry out the hemodynamics and medication dispersion and deposition studies, inside the descending aorta. The analysis reveals that the flow separation causes a preferential deposition and build-up of low-density lipoproteins (LDL) on the arterial surface. Our study also shows that the flow boundary-layer separation is associated with an increase in deposition of the low-density lipoproteins. The analysis reveals the presence of Dean vortices, inside the aorta branches, which contribute to the reduction of the deposition and build-up of low-density lipoproteins on the arterial surfaces. The analysis of medication dispersion and deposition, inside the descending aorta, shows that the total medication deposition increases with the increase of particle size and density. Particles of fiber-like shape are more prone to deposition, and this is due to the fact that fiber-like particles align perfectly with the flow streamlines. Thus, the interaction of complex turbulent eddies with vessel’s wall causes medication deposition. The research shows that LES is a promising tool in the analysis of hemodynamics and medication transport and therefore, it may assist medical planning by providing surgeons with the elements of the blood flow such as, pressure, velocity, vorticity, wall-shear stresses, which cannot be measured in vivo and obtained with imaging techniques.
3 citations
TL;DR: In this paper , simultaneous effects of tDCS on cerebral blood flow (CBF), venous blood oxygenation (Yv) and cerebral metabolic rate of oxygen (CMRO2) using simultaneous MRI in healthy adults to provide a reference frame for its neurobiological mechanisms.
1 citations
TL;DR: The MRI‐based techniques that were used in the current study for measuring arterial flow in pediatric and adolescent patients demonstrated acceptable test‐retest reliability both at rest and immediately post‐exercise.
Abstract: Magnetic Resonance Imaging (MRI) is well‐suited for imaging peripheral blood flow due to its non‐invasive nature and excellent spatial resolution. Although MRI is routinely used in adults to assess physiological changes in chronic diseases, there are currently no MRI‐based data quantifying arterial flow in pediatric or adolescent populations during exercise. Therefore the current research sought to document femoral arterial blood flow at rest and following exercise in a pediatric‐adolescent population using phase contrast MRI, and to present test‐retest reliability data for this method. Ten healthy children and adolescents (4 male; mean age 14.8 ± 2.4 years) completed bloodwork and resting and exercise MRI. Baseline images consisted of PC‐MRI of the femoral artery at rest and following a 5 × 30 s of in‐magnet exercise. To evaluate test‐retest reliability, five participants returned for repeat testing. All participants successfully completed exercise testing in the MRI. Baseline flow demonstrated excellent reliability (ICC = 0.93, p = 0.006), and peak exercise and delta rest‐peak flow demonstrated good reliability (peak exercise ICC = 0.89, p = 0.002, delta rest‐peak ICC = 0.87, p = 0.003) between‐visits. All three flow measurements demonstrated excellent reliability when assessed with coefficients of variance (CV’s) (rest: CV = 6.2%; peak exercise: CV = 7.3%; delta rest‐peak: CV = 7.1%). The mean bias was small for femoral arterial flow. There was no significant mean bias between femoral artery flow visits 1 and 2 at peak exercise. There were no correlations between age or height and any of the flow measurements. There were no significant differences between male and female participants for any of the flow measurements. The current study determined that peripheral arterial blood flow in children and adolescents can be evaluated using non‐invasive phase contrast MRI. The MRI‐based techniques that were used in the current study for measuring arterial flow in pediatric and adolescent patients demonstrated acceptable test‐retest reliability both at rest and immediately post‐exercise.
1 citations
References
More filters
[...]
188 citations
"A Spatiotemporal exploration and 3D..." refers background in this paper
...5 million people died of stroke in 2016) [42]....
[...]
TL;DR: It is concluded that given a sufficient entrance length of realistic geometry, simplification to fully developed axial flow may be made without penalty, and effort be given to more accurate and detailed geometric reconstructions, as being of primary influence on physiologically significant indicators.
Abstract: Background: Computational fluid dynamics tools are useful for their ability to model patient specific data relevant to the genesis and progression of atherosclerosis, but unavailable to measurement tools. The sensitivity of the physiologically relevant parameters of wall shear stress (WSS) and the oscillatory shear index (OSI) to secondary flow in the inlet velocity profiles was investigated in three realistic models of the carotid bifurcation. Method of Approach: Secondary flow profiles were generated using sufficiently long entrance lengths, to which curvature and helical pitch were added. The differences observed were contextualized with respect to effect of the uncertainty of the models' geometry on the same parameters. Results: The effects of secondary velocities in the inlet profile on WSS and OSI break down within a few diameters of the inlet. Overall, the effect of secondary inlet flow on these models was on average more than 3.5 times smaller than the effect of geometric variability, with 13% and 48% WSS variability induced by inlet secondary flow and geometric differences, respectively. Conclusions: The degree of variation is demonstrated to be within the range of the other computational assumptions, and we conclude that given a sufficient entrance length of realistic geometry, simplification to fully developed axial (i.e., Womersley) flow may be made without penalty. Thus, given a choice between measuring three components of inlet velocity or a greater geometric extent, we recommend effort be given to more accurate and detailed geometric reconstructions, as being of primary influence on physiologically significant indicators.
140 citations
"A Spatiotemporal exploration and 3D..." refers background in this paper
...Several studies have pointed the importance of having an accurate carotid geometry [7, 34]....
[...]
TL;DR: This method can be used to characterize blood flow patterns in healthy and diseased arteries and may eventually help physicians to supplement imaging-based diagnosis and predict and evaluate the outcome of interventional procedures.
140 citations
"A Spatiotemporal exploration and 3D..." refers result in this paper
...The three PC-MRI velocity waveforms exhibit a standard behavior, comparable with other PC-MRImeasurements reported in [8, 31]....
[...]
TL;DR: The results demonstrate the feasibility of flow‐sensitive 4D MRI for the quantification and 3D visualization of physiological and pathological flow patterns in the carotid artery bifurcation.
Abstract: To determine three-dimensional (3D) blood flow patterns in the carotid bifurcation, 10 healthy volunteers and nine patients with internal carotid artery (ICA) stenosis ≥50% were examined by flow-sensitive 4D MRI at 3T. Absolute and mean blood velocities, pulsatility index (PI), and resistance index (RI) were measured in the common carotid arteries (CCAs) by duplex sonography (DS) and compared with flow-sensitive 4D MRI. Furthermore, 3D MRI blood flow patterns in the carotid bifurcation of volunteers and patients before and after recanalization were graded by two independent readers. Blood flow velocities measured by MRI were 31–39% lower than in DS. However, PI and RI differed by only 13–16%. Rating of 3D flow characteristics in the ICA revealed consistent patterns for filling and helical flow in volunteers. In patients with ICA stenosis, 3D blood flow visualization was successfully employed to detect markedly altered filling and helical flow patterns (forward-moving spiral flow) in the ICA bulb and to evaluate the effect of revascularization, which restored filling and helical flow. Our results demonstrate the feasibility of flow-sensitive 4D MRI for the quantification and 3D visualization of physiological and pathological flow patterns in the carotid artery bifurcation. Magn Reson Med 61:65–74, 2009. © 2008 Wiley-Liss, Inc.
137 citations
TL;DR: In this article, a method for the generation of hybrid prismatic/tetrahedral grids is described for complex three-dimensional geometries, including multibody domains, and employed for viscous flows around an aircraft.
Abstract: A method for the generation of hybrid prismatic/tetrahedral grids is described for complex three-dimensional geometries, including multibody domains, and employed for viscous flows around an aircraft. The prisms cover the region close to each body's surface, while tetrahedra are created elsewhere. A special method is presented that allows the generation of single-block, nonoverlapping prismatic meshes even in complex geometries that contain narrow gaps and cavities. Examples of cases treated by this method include wing-engine configurations as well as multi-element wings. The second development is a combined octree/advancing front method for the generation of the tetrahedra of the hybrid mesh. The main feature of this octree-based tetrahedra generator is that it does not require the creation of a background mesh by the user for the determination of the grid-spacing and stretching parameters. These are determined via an automatically generated octree. The hybrid grid generator is robust, geometry independent, and requires no user intervention. The suitability of hybrid meshes for capturing viscous flow phenomena is demonstrated by simulation of viscous flows around a high-speed civil transport type of aircraft configuration. Reduction in computer resources has been substantial, allowing flow simulations to be performed on workstations rather than supercomputers.
133 citations
"A Spatiotemporal exploration and 3D..." refers methods in this paper
...The model was further re-meshed using an Octree surface refinement based on prismatic wall [20]....
[...]