scispace - formally typeset
Search or ask a question
Journal ArticleDOI

A Unified Approach to Multisource Data Analyses

01 Jan 2018-Fundamenta Informaticae (IOS Press)-Vol. 162, Iss: 4, pp 311-359
TL;DR: A conceptual modeling solution, named Unified Cube, which blends together multidimensional data from DWs and LOD datasets without materializing them in a stationary repository and an analysis processing process which queries different sources in a transparent way to decision-makers is proposed.
Abstract: Classically, Data Warehouses (DWs) supports business analyses on data coming from the inside of an organization. Nevertheless, Lined Open Data (LOD) might sensibly complete these business analyses by providing complementary perspectives during a decision-making pro-cess. In this paper, we propose a conceptual modeling solution, named Unified Cube, which blends together multidimensional data from DWs and LOD datasets without materializing them in a stationary repository. We complete the conceptual modeling with an implementation frame-work which manages the relations between a Unified Cube and multiple data sources at both schema and instance levels. We also propose an analysis processing process which queries different sources in a transparent way to decision-makers. The practical value of our proposal is illustrated through real-world data and benchmarks.

Summary (4 min read)

1. Introduction

  • Well-informed and effective decision-making relies on appropriate data for business analyses.
  • An analysis subject should include all related numeric indicators from different sources, even though these indicators cannot be aggregated according to the same analytical granularities.
  • The authors describe a generic modeling solution, named Unified Cube, which provides a business-oriented view unifying both warehoused data and LOD.
  • Section 3 describes the conceptual modeling and graphical notation of Unified Cubes.

3.1. Analysis subject: fact

  • Classically, a fact models an analysis subject.
  • To support real-time analyses, the Unified Cube modeling extends the concept of measure by allowing on-the-fly extraction of measure values.
  • Table 1 shows the algebraic form of commonly used SPARQL queries.
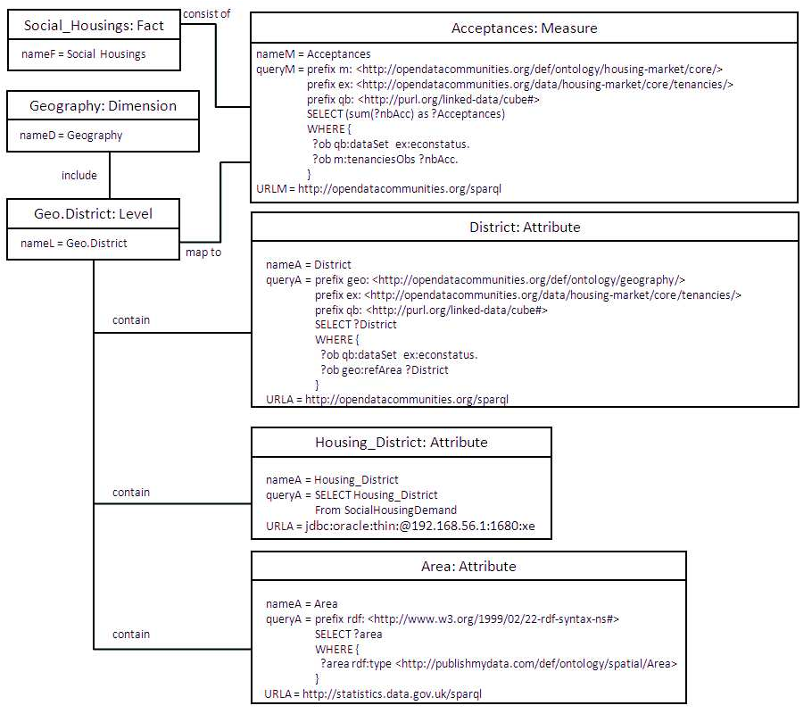
  • The fact named Social Housings contains two measures, namely mAcceptances and mApplications.
  • The extraction formula of the measure mAcceptances is defined upon SPARQL algebra, such as:.

3.2. Analysis axis: dimension

  • The concept of dimension in a Unified Cube follows the classical definition.
  • If several analytical granularities are defined, the authors can find one or several aggregation paths (also known as hierarchies).
  • Without this constraint, a dimension may start at any level.
  • Definition 3.3. District named Geography- District with LDGeography\lGeo.District ={lGeo. 11 ∃=1 represents the unique existential quantification meaning ”there exists only one”.

3.3. Analytical granularity: level

  • Classically, a level indicates a distinct analytical granularity described by a set of attributes from the same data source.
  • In the context of Unified Cubes, the classical definition of level needs to be extended to group together attributes from different sources.
  • Status associates the instances of the attribute aStatus with its equivalent instances of the attribute aApplicant Status, such as: C lEconomic.
  • In order to simplify the notation, the level-measure mapping is drawn between a measure and its lowest summarizable levels within corresponding dimensions.
  • By including business-oriented concepts and a graphical notation, a Unified Cube can support analyses on multiple data sources in a user-friendly way without requiring specialized knowledge on logical or physical data modeling.

4.1. Schema module

  • The schema module manages the multidimensional representation of a Unified Cube.
  • It is worth noticing that extraction formulae of measures and attributes are translated into executable queries (i.e., queryM and queryA).
  • Binary relations within a dimension are used to instantiate the association between a child level instance and a parent level instance (cf. lines 13 - 15).
  • The instantiated metamodel contains (i) one instance of Fact (ii) two instances of Measure, (iii) two instances of Algorithm 1: Metamodel Instantiation input : A Unified Cube = {F; D ; LM} output:.
  • In the snapshot, the Geography dimension includes the level Geo.District.

4.2. Instance module

  • In a Unified Cube, equivalent attribute instances from different sources are associated together by correlative mappings (cf. section 3.3).
  • Classically, problems of matching instances from sources of different types are handled in a simplistic way by transforming heterogeneous sources into a common format and then following a matching process designed for homogeneous sources.
  • Matching based on string similarity measures is often reinforced by some auxiliary techniques.
  • By referring to the links between LOD datasets, 243 pairs of districts from the LOD1 dataset and the LOD2 dataset are associated together with a perfect confidence score (i.e. score = 1); Housing District’s instances from the DW share similar description with instances of Area from the LOD1 dataset.
  • The authors first describe how queries are automatically generated for an analysis (cf. section 5.1).

5.1. Queries generation

  • To facilitate decision-makers tasks, the authors propose a process whose goal is to extract data related to an analysis from multiple sources (cf. algorithm 2).
  • During the execution, the algorithm picks out attributes linked to a chosen measure (i.e. AM in lines 1 and 23).
  • The third analysis calculates a measure according to an attribute from a different source.
  • The second query is generated by referring to the extraction formulae of mAcceptances, aStatus and aDistrict (cf. lines 15 and 18).

5.2. Analysis result generation

  • After the execution of generated queries, several query results are returned from different sources.
  • In the following, the authors provide more details about how multiple query results are fused together to form one analysis result at the output of the algorithm.
  • Note that the abstract notation in algorithm 3 follows the conceptual Unified Cube modeling presented in sections 3, while the operations correspond to those in the metamodel described in section 4.1.
  • Then, attribute instances from Rtemp are grouped with those from R2 ).
  • Second, their proposed decision-support process facilitates decision-makers analysis tasks.

5.3. Multisource analysis framework

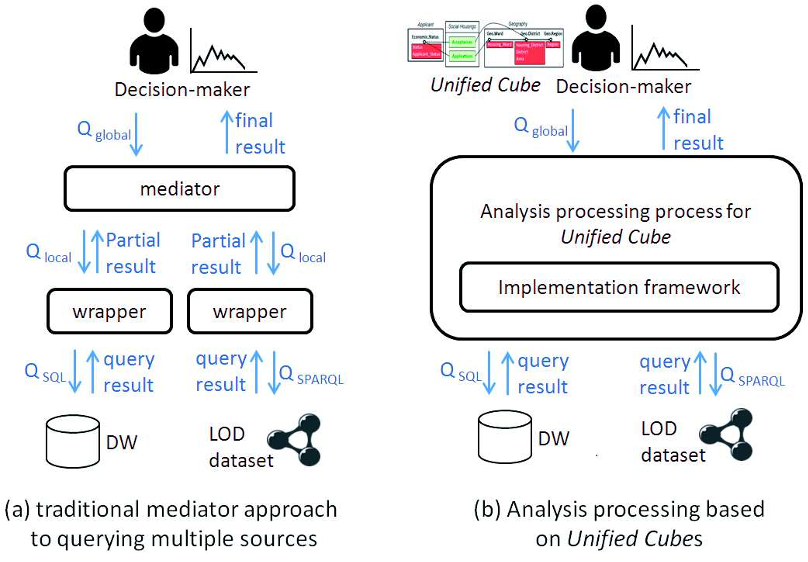
  • To enable analyses on multiple sources in a user-friendly manner, the authors develop a multisource analysis framework which present only business-oriented concepts to decision-makers during analyses.
  • The instance manager deals with correlative attribute instances from different sources.
  • Both Java programs are included in the analysis processing manager.
  • The proposed analysis framework supports a user-friendly decision-making process in their analysis framework.
  • After queries execution, the analysis processing manager receives data extracted from different sources (cf. arrows 5).

6. Experimental assessments

  • To enable analyses on data from multiple sources, one key step consists of unifying data extracted from different sources together to form one unique analysis result.
  • This unification is based on the table of correspondences which is populated through an instance matching process .
  • To study the feasibility and efficiency of their proposed matching process, the authors carry out some experimental assessments.
  • Second, the authors present the results of their experimental assessments.
  • Third, based on the experimental results, the authors propose some generic guidelines for efficient use of string similarity measures to match correlative instances in a Unified Cube (cf. section 6.3).

6.1. Input

  • During their experimental assessments, the authors use two collections of real-world data.
  • Most CLG datasets contain a geographic dimension composed of one level named District.
  • Two different implementations of the bibliographic data are managed by the European Network of Excellence ReSIST17 and the L3S Research Center18.
  • The average string length is about 290 characters including data type descriptors and name spaces.

6.2.1. Protocol

  • The objective of the experimental assessments is to find out if string similarity measures can be used to match correlative attribute instances.
  • The matching candidates are formed according to four combinations of matching setups, namely Concatenated&Unprocessed, Concatenated&Optimized, Separated&Unprocessed, and Separated& Optimized (cf. section 4.2).
  • The efficiency of each string similarity measure is evaluated through the F-measure and the runtime.
  • The precision is the ratio of the number of true positives to the retrieved mappings, while the recall is the ratio of the number of true positives to the actual mappings expected.
  • The hardware configuration of the multi-threads execution environment is as follows: CPU of two AMD Opteron 6262HE with 16 cores, RAM of 128 GB and SAS 10K disk.

6.2.2. Observations and discussions

  • The first tests consist of comparing the F-measure of string similarity measures according to different influence factors.
  • Conclusion Based on the previous observations, the authors can conclude string similarity measures in the same group produce almost the same F-measure when the same matching setup is used.
  • To do so, the authors first choose the top five similarity measures producing the highest F-measure according to four matching setups when being applied to seven datasets (cf. table 5).
  • For bibliographic data, the authors notice even if data volume increases by 225% from DBLP0 to DBLP50, the runtime of all similarity measures augments only from 5.2% to 16.9% with an average of 8% (owing to parallel computation).
  • Independently of similarity measures, the fastest matching setup is Separated&Optimized, which produces the shortest matching candidates among all matching setups.

6.3. Guidelines

  • Based on the results of their experimental assessments, the authors describe some generic guidelines to make full use of similarity measures.
  • First, Soundex, Jaro, Overlap Coefficient, and Euclidean Distance are only suited for specific needs of matching [16, 11, 13], e.g. using Soundex to match homophones in English.
  • In the context of Unified Cubes, the quality of the correlative mappings based on these similarity measures cannot be guaranteed due to their poor performance in matching instances from some generic sources.
  • Therefore, they are not considered in the guidelines.
  • Third, in the case where attribute instances contain relatively short strings (about 200 characters or less), N Grams Distance, Levenshtein, Smith Waterman, Smith Waterman Gotoh, Monge Elkan, Needleman Wunch, and Jaro Winkler are possible choices of similarity measures which can produce a high F-measure.

6.4. Validation

  • To validate their proposed guidelines, the authors use the benchmark of the instance matching track in the Ontology Alignment Evaluation Initiative campaigns 201620 and 201721.
  • Due to the large number of highly similar music works, the authors have to firstly write queries to extract corresponding descriptions of music work, for instance title versus title, compositors versus compositors, etc.
  • It leaves us four choices of similarity measures which are possibly appropriate for the matching in the benchmark: Jaro Winkler, Levenshtein, N Grams Distance, and Smith Waterman.
  • As no semantic-based technique is used to improve the matching result, the authors expect some low similarity score between instances.
  • After the execution, the authors obtain some surprisingly good results.

7. Conclusion

  • To this end, the authors have defined a generic conceptual multidimensional model, named Unified Cube, which blends data from multiple sources together.
  • The authors have proposed an implementation framework which manages interactions between a Unified Cube and multiple data sources at both the schema and the instance levels.
  • Based on their proposed implementation framework, the authors have designed an analysis processing process which enables analyses on multisource data in a user-friendly way.
  • The results of their experimental assessments have been integrated into some generic guidelines allowing identifying the most appropriate string similarity measures according to matching setup, string length, and requirement on runtime.
  • With regards to the maintenance of the table of correspondences, several update alternatives would be included in the process, such as periodically executing their proposed matching process , triggering an update after each evolution detected in sources [23, 14], or triggering an update in an on-demand manner to support right-time business analyses [41].

Did you find this useful? Give us your feedback

Figures (25)

Content maybe subject to copyright    Report

Any correspondence concerning this service should be sent
to the repository administrator: tech-oatao@listes-diff.inp-toulouse.fr
This is an author’s version published in:
http://oatao.univ-toulouse.fr/22413
T
o cite this version: Ravat, Franck and Song, Jiefu A
Unified Approach to Multisource Data Analyses. (2018)
Fundamenta Informaticae, 162 (4). 311-359. ISSN 1875-8681
Official URL
DOI : https://doi.org/10.3233/FI-2018-1727
Open
Archive
Toulouse
Archive
Ouverte
OATAO is an open access repository that collects the work of Toulouse
researchers and makes it freely available over the web where possible

DOI 10.3233/FI-2018-1700
A Unified
Approach to Multisource Data Analyses
Franck Ravat Jiefu Song
IRIT - Universit´e Toulouse I Capitole
2 Rue du Doyen Gabriel Marty F-31042 Toulouse Cedex 09,
France ravat@irit.fr, song@irit.fr
Abstract. Classically, Data Warehouses (DWs) supports business analyses on data coming from the inside of
an organization. Nevertheless, Lined Open Data (LOD) might sensibly complete these business analyses by
providing complementary perspectives during a decision-making pro-cess. In this paper, we propose a
conceptual modeling solution, named Unified Cube, which blends together multidimensional data from DWs
and LOD datasets without materializing them
in a stationary repository. We complete the conceptual modeling
with an implementation frame-work which manages the relations between a Unified Cube and multiple data
sources at both schema and instance levels. We also propose an analysis processing process which queries dif-
ferent sources in a transparent way to decision-makers. The practical value of our proposal is illustrated
through real-world data and benchmarks.
Keywords: Data Warehouse, Linked Open Data, Conceptual Modeling, Multisource analyses,
Experimental Assessments
1. Introduction
Well-informed and effective decision-making relies on appropriate data for business analyses. Data
are considered appropriate if they include enough information to provide an overall perspective to
decision-makers. To obtain as many appropriate data as possible, decision-makers must have access
to the company’s business data at any time. Since the 1990s, Business Intelligence (BI) has been
Address for correspondence: IRIT - Universit
´
e
Toulouse I Capitole, 2 Rue du Doyen Gabriel Marty F-31042 Toulouse
Cedex 09, France

providing methods, techniques and tools to collect, extract and analyze business data stored in a Data
Warehouse (DW) [9]. However, an overall perspective during decision-making requires not only busi-
ness data from inside a company but also other data from outside a company. In today’s constantly
evolving business context, one promising approach consists of blending web data with warehoused
data [32]. The concept of BI 2.0 is introduced to envision a new generation of BI enhanced by web-
based content [39].
Among various web-based content, Linked Open Data (LOD)
1
provide a set of inter-connected
and machine-readable data to enhance business analyses on a web scale [45]. Since data are produced
and updated at a high speed nowadays, materializing all data (e.g., warehoused data and LOD) related
to analyses in one stationary repository can hardly be synchronized with changes in data sources. It is
necessary to unify data from various sources without integrating all data into a stationary repository.
To support up-to-date decision-making, business dashboards must be created in an on-demand manner.
Such dashboards should include all appropriate data required by decision-makers.
Case Study. In a government organization managing social housings, internal data are periodi-
cally extracted, transformed and loaded in a DW. As shown in figure 1(a), the DW describes number of
applications (i.e. Applications) according to two analysis axes: one about the geographical location of
social housings (i.e. Housing
Ward and Housing District) and the other related to applicant’s profile
(i.e. Applicant
Status). This DW only gives a partial view on the demand for social housings. To
support effective decision-making, additional information should be included in analyses. Therefore,
a decision-maker browses in a second dataset, named LOD1, to obtain complementary views on so-
cial housing allocation. Published by the UK Department for Communities and Local Government
2
,
LOD1 describes the accepted applications for social housing (i.e. acceptance) according to district
Figure 1: An extract of data in a DW and two LOD datasets
1
http://linkeddata.org
2
http://opendatacommunities.org/data/housingmarket/core/tenancies/econstatus

and status (cf. figure 1(b)). LOD1 follows a multidimensional structure expressed in RDF Data Cube
Vocabulary (QB)
3
. The QB format only allows including one granularity in each analysis axis. The
decision-maker needs new analysis possibilities to aggregate data based on multiple granularities. To
discover more geographical granularities, the decision-maker looks into another dataset named LOD2.
This dataset is managed by the Office for National Statistics of the UK
4
; it associates several areas
(including districts) with one corresponding region (cf. figure 1(c)). Both LOD1 and LOD2 are real-
world LOD which can be accessed through querying endpoints
56
.
The above-mentioned warehoused data and LOD share some similar multidimensional features, as
they are organized according to analysis subjects and analysis axes. However, analyzing data scattered
in several sources is difficult without a unified data representation. During analyses, decision-makers
must search for useful information in several sources. The efficiency of such analyses is low, since
different sources may follow different schemas and contain different data instances. Facing these
issues, the decision-maker needs a business-oriented view unifying data from both the DW and the
LOD datasets. She/he makes the following requests regarding the view:
An analysis subject should include all related numeric indicators from different sources, even
though these indicators cannot be aggregated according to the same analytical granularities. To
support real-time analyses, numeric indicators (e.g. Applications from the DW, Acceptances
from the LOD1 dataset) and their descriptive attributes (e.g. Housing
Ward, Housing District
and Applicant
Status from the DW, District and Status from the LOD1 dataset) at different
analytical granularities should be queried on-the-fly from sources;
Analytical granularities related to the same analysis axis should be grouped together. For in-
stance, the Housing
Ward and Housing District granularities from the DW, the District granu-
larity from the LOD1 dataset, the Area and Region granularities from the LOD2 dataset should
be merged into one analysis axis;
Attributes describing the same analytical granularity should be grouped together. The correl-
ative relationships between instances of these attributes should be managed. For instance, the
attribute Housing
District from the DW, the attribute District from the LOD1 dataset and the
attribute Area from the LOD2 dataset should be all included in one analytical granularity related
to districts. Correlative instances Birmingham from the DW, Birmingham E08000025 from
the LOD1 dataset and Birmingham xsd:string from the LOD2 dataset should be associated
together, since they both refer to the same district;
Summarizable analytical granularities should be indicated for each numeric indicator. For in-
stance, only the measure Applications from the DW can be aggregated according the Ward
analytical granularity. The other measure Acceptances from the LOD1 dataset is only summa-
rizable starting from the district analytical granularity on the geographical analysis axis.
3
http://www.w3.org/TR/vocab-data-cube
4
https://www.ons.gov.uk/
5
http://opendatacommunities.org/sparql
6
http://statistics.data.gov.uk/sparql

Contribution. Our aim is to make full use of as much information as possible to support effective
and well-informed decisions. To this end, we propose a unified view of data from both DWs and
LOD datasets. At the schema level, the unified view should include in a single schema all information
about an analysis subject described by all available analysis axes as well as all granularities (coming
from multiple sources). At the instance level, the unified view should not materialize data that can
be directly queried from the source. Nevertheless, it should manage the correlation relations between
related attribute instances referring to the same real-world entity. With the help of the unified view, a
decision-maker can easily obtain an overall perspective of an analysis subject. In the previous example,
a unified view would enable decision-makers to analyze on-the-fly the number of applications and
acceptances according to applicant’s status and district as well as region (cf. figure 1(d)).
In this paper, we describe a generic modeling solution, named Unified Cube, which provides
a business-oriented view unifying both warehoused data and LOD. Section 2 presents different ap-
proaches to unifying data from DWs and LOD datasets. Section 3 describes the conceptual modeling
and graphical notation of Unified Cubes. Section 4 presents an implementation framework for Unified
Cubes. Section 5 shows how analyses are carried out on a Unified Cube in a user-friendly manner.
Section 6 illustrates the feasibility and the efficiency of our proposal through some experimental as-
sessments.
2. Related work
Disparate data silos from different sources make decision-making difficult and tedious [43]. To pro-
vide decision-makers with an overall perspective during business analyses, an effective data integration
strategy is needed. In accordance with our research context, we focus on work related to the integra-
tion of multidimensional data from DWs and LOD datasets. We classify existing researches into three
categories.
The first category is named ETL-based. With the arrival of LOD, the BI community intuitively
treated LOD as external data sources that should be integrated in a DW through ETL processes [15, 29,
36]. The obtained multidimensional DW is used as a centralized repository of LOD [38, 6]. Decision-
makers can use classical DW analysis tools to analyze LOD stored in such DWs. However, the existing
ETL techniques are inclined to populate a DW with LOD rather than updating existing LOD in a
DW. No effective technique is proposed to guarantee the freshness of warehoused LOD presented to
decision-makers during analyses. One promising avenue is to extend on-demand ETL processes [4]
to fit for the integration of LOD in a DW at right time during business analyses. Otherwise, current
ETL-based approaches are not suitable in today’s highly dynamic context where large amounts of data
are constantly published and updated; they collide with the distributed nature and the high volatility
of LOD [24, 17].
The second category is named semantic web modeling. Since multidimensional models have been
proven successful in supporting complex business analyses [35], the LOD community introduces new
modeling vocabularies to semantically describe the multidimensionality of LOD through RDF triples.
Among the proposed modeling vocabularies, the RDF Data Cube Vocabulary
7
(QB) is the current W3C
7
http://www.w3.org/TR/vocab-data-cube

Citations
More filters
Book ChapterDOI
08 Sep 2019
TL;DR: A metadata conceptual schema which considers different types (structured, semi-structured and unstructured) of raw or processed data is presented and is implemented in two DBMSs to validate the proposal.
Abstract: To prevent data lakes from being invisible and inaccessible to users, an efficient metadata management system is necessary. In this paper, we propose a such system based on a generic and extensible classification of metadata. A metadata conceptual schema which considers different types (structured, semi-structured and unstructured) of raw or processed data is presented. This schema is implemented in two DBMSs (relational and graph) to validate our proposal.

25 citations

Journal ArticleDOI
TL;DR: In this paper, a music retrieval system based on the knowledge of music was proposed, and the feature extraction algorithm was analyzed. But the detailed design of the system was not discussed.
Abstract: This paper firstly introduces the basic knowledge of music, proposes the detailed design of a music retrieval system based on the knowledge of music, and analyzes the feature extraction algorithm a...

1 citations

Journal ArticleDOI
TL;DR: In this paper, the authors propose an original data cube metamodel defined in UML, based on concepts like common dimension levels and metadimensions, which can instantiate constellations of heterogeneous data cubes allowing SOLAP to perform multiscale, multi-territory and time analysis.
Abstract: Due to their multiple sources and structures, big spatial data require adapted tools to be efficiently collected, summarized and analyzed. For this purpose, data are archived in data warehouses and explored by spatial online analytical processing (SOLAP) through dynamic maps, charts and tables. Data are thus converted in data cubes characterized by a multidimensional structure on which exploration is based. However, multiple sources often lead to several data cubes defined by heterogeneous dimensions. In particular, dimensions definition can change depending on analyzed scale, territory and time. In order to consider these three issues specific to geographic analysis, this research proposes an original data cube metamodel defined in unified modeling language (UML). Based on concepts like common dimension levels and metadimensions, the metamodel can instantiate constellations of heterogeneous data cubes allowing SOLAP to perform multiscale, multi-territory and time analysis. Afterwards, the metamodel is implemented in a relational data warehouse and validated by an operational tool designed for a social economy case study. This tool, called “Racines”, gathers and compares multidimensional data about social economy business in Belgium and France through interactive cross-border maps, charts and reports. Thanks to the metamodel, users remain independent from IT specialists regarding data exploration and integration.

1 citations

Journal ArticleDOI
01 Jun 2022-Sensors
TL;DR: A unified data modeling method is proposed to solve the consistent and comprehensive expression problem of ILS data and different systems in the equipment ILS process can share a set of data models and provide ILS designers with relevant data through different views.
Abstract: Integrated logistics support (ILS) is of great significance for maintaining equipment operational capability in the whole lifecycle. Numerous segments and complex product objects exist in the process of equipment ILS, which gives ILS data multi-source, heterogeneous, and multidimensional characteristics. The present ILS data cannot satisfy the demand for efficient utilization. Therefore, the unified modeling of ILS data is extremely urgent and significant. In this paper, a unified data modeling method is proposed to solve the consistent and comprehensive expression problem of ILS data. Firstly, a four-tier unified data modeling framework is constructed based on the analysis of ILS data characteristics. Secondly, the Core unified data model, Domain unified data model, and Instantiated unified data model are built successively. Then, the expressions of ILS data in the three dimensions of time, product, and activity are analyzed. Thirdly, the Lifecycle ILS unified data model is constructed, and the multidimensional information retrieval methods are discussed. Based on these, different systems in the equipment ILS process can share a set of data models and provide ILS designers with relevant data through different views. Finally, the practical ILS data models are constructed based on the developed unified data modeling software prototype, which verifies the feasibility of the proposed method.
References
More filters
Journal ArticleDOI
01 Feb 2013
TL;DR: This paper presents the PRISM/PRISM++ system and the novel technology that made it possible, and focuses on the difficult and previously unsolved problem of supporting legacy queries and updates under schema and integrity constraints evolution.
Abstract: Supporting database schema evolution represents a long-standing challenge of practical and theoretical importance for modern information systems. In this paper, we describe techniques and systems for automating the critical tasks of migrating the database and rewriting the legacy applications. In addition to labor saving, the benefits delivered by these advances are many and include reliable prediction of outcome, minimization of downtime, system-produced documentation, and support for archiving, historical queries, and provenance. The PRISM/PRISM++ system delivers these benefits, by solving the difficult problem of automating the migration of databases and the rewriting of queries and updates. In this paper, we present the PRISM/PRISM++ system and the novel technology that made it possible. In particular, we focus on the difficult and previously unsolved problem of supporting legacy queries and updates under schema and integrity constraints evolution. The PRISM/PRISM++ approach consists in providing the users with a set of SQL-based Schema Modification Operators (SMOs), which describe how the tables in the old schema are modified into those in the new schema. In order to support updates, SMOs are extended with integrity constraints modification operators. By using recent results on schema mapping, the paper (i) characterizes the impact on integrity constraints of structural schema changes, (ii) devises representations that enable the rewriting of updates, and (iii) develop a unified approach for query and update rewriting under constraints. We complement the system with two novel tools: the first automatically collects and provides statistics on schema evolution histories, whereas the second derives equivalent sequences of SMOs from the migration scripts that were used for schema upgrades. These tools were used to produce an extensive testbed containing 15 evolution histories of scientific databases and web information systems, providing over 100 years of aggregate evolution histories and almost 2,000 schema evolution steps.

113 citations


"A Unified Approach to Multisource D..." refers background in this paper

  • ...figure 5), triggering an update after each evolution detected in sources [23, 14], or triggering an update in an on-demand manner to support right-time business analyses [41]....

    [...]

01 Jan 2007
TL;DR: This paper focuses on a component of the architecture which is a tool, called DB2OWL, that automatically generates ontologies from database schemas as well as mappings that relate the ontologies to the information sources.
Abstract: In order to achieve efficient interoperability of information systems, ontologies play an important role in resolving semantic heterogeneity. We propose a general interoperability architecture that uses ontologies for explicit description of the semantics of information sources, and web services to facilitate the communication between the different components of the architecture. It consists of 1) data provider services for mapping information sources to local source ontologies, 2) a knowledge base for representing reference domain ontology, and 3) several web services for encapsulating the different functionalities of the architecture. In this paper, we focus on a component of the architecture which is a tool, called DB2OWL, that automatically generates ontologies from database schemas as well as mappings that relate the ontologies to the information sources. The mapping process starts by detecting particular cases for conceptual elements in the database and accordingly converts database components to the corresponding ontology components. A prototype of DB2OWL tool is implemented to create OWL ontology from relational database.

91 citations


"A Unified Approach to Multisource D..." refers background in this paper

  • ...An intermediate ontology is generally used to provide additional semantics of warehoused data [20]....

    [...]

01 Jan 2010
TL;DR: In this paper, a query algebra for multidimensional analyses is presented, which supports complex analyses through advanced operators and binary operators, and a graphical language, based on this algebra, is also provided to ease the specification of multi-dimensional queries.
Abstract: This article deals with multidimensional analyses. Analyzed data are designed according to a conceptual model as a constellation of facts and dimensions, which are composed of multi-hierarchies. This model supports a query algebra defining a minimal core of operators, which produce multidimensional tables for displaying analyzed data. This user-oriented algebra supports complex analyses through advanced operators and binary operators. A graphical language, based on this algebra, is also provided to ease the specification of multidimensional queries. These graphical manipulations are expressed from a constellation schema and they produce multidimensional tables.

91 citations

Book ChapterDOI
TL;DR: TheSemantic Data Warehouse is proposed to be a repository of ontologies and semantically annotated data resources and an ontology-driven framework to design multidimensional analysis models for Semantic Data Warehouses is proposed.
Abstract: The Semantic Web enables organizations to attach semantic annotations taken from domain and application ontologies to the information they generate. The concepts in these ontologies could describe the facts, dimensions and categories implied in the analysis subjects of a data warehouse. In this paper we propose the Semantic Data Warehouse to be a repository of ontologies and semantically annotated data resources. We also propose an ontology-driven framework to design multidimensional analysis models for Semantic Data Warehouses. This framework provides means for building a Multidimensional Integrated Ontology (MIO) including the classes, relationships and instances that represent interesting analysis dimensions, and it can be also used to check the properties required by current multidimensional databases (e.g., dimension orthogonality, category satisfiability, etc.) In this paper we also sketch how the instance data of a MIO can be translated into OLAP cubes for analysis purposes. Finally, some implementation issues of the overall framework are discussed.

82 citations


"A Unified Approach to Multisource D..." refers background in this paper

  • ...With the arrival of LOD, the BI community intuitively treated LOD as external data sources that should be integrated in a DW through ETL processes [15, 29, 36]....

    [...]

Book ChapterDOI
27 May 2012
TL;DR: This work investigates the problem of executing OLAP queries via SPARQL on an RDF store and defines projection, slice, dice and roll-up operations on single data cubes published as Linked Data reusing the RDF Data Cube vocabulary and shows how a nested set of operations lead to an OLAP query.
Abstract: Online Analytical Processing (OLAP) promises an interface to analyse Linked Data containing statistics going beyond other interaction paradigms such as follow-your-nose browsers, faceted-search interfaces and query builders. Transforming statistical Linked Data into a star schema to populate a relational database and applying a common OLAP engine do not allow to optimise OLAP queries on RDF or to directly propagate changes of Linked Data sources to clients. Therefore, as a new way to interact with statistics published as Linked Data, we investigate the problem of executing OLAP queries via SPARQL on an RDF store. First, we define projection, slice, dice and roll-up operations on single data cubes published as Linked Data reusing the RDF Data Cube vocabulary and show how a nested set of operations lead to an OLAP query. Second, we show how to transform an OLAP query to a SPARQL query which generates all required tuples from the data cube. In a small experiment, we show the applicability of our OLAP-to-SPARQL mapping in answering a business question in the financial domain.

81 citations


"A Unified Approach to Multisource D..." refers background in this paper

  • ...The authors of [26] carry out multidimensional analyses over QB datasets....

    [...]

  • ...Moreover, the work [26, 37] deals only with one LOD dataset....

    [...]