scispace - formally typeset
Search or ask a question
Proceedings ArticleDOI

Appearance-based segmentation of indoors/outdoors sequences of spherical views

TL;DR: This work aims at detecting the changes in the structural properties of the scene during navigation by using a change-point detection algorithm based on a statistical Neyman-Pearson test to find optimal transitions between topological places.
Abstract: Navigating in large scale, complex and dynamic environments requires reliable representations able to capture metric, topological and semantic aspects of the scene for supporting path planing and real time motion control. In a previous work [11], we addressed metric and topological representations thanks to a multi-cameras system which allows building of dense visual maps of large scale 3D environments. The map is a set of locally accurate spherical panoramas related by 6d of poses graph. The work presented here is a further step toward a semantic representation. We aim at detecting the changes in the structural properties of the scene during navigation. Structural properties are estimated online using a global descriptor relying on spherical harmonics which are particularly well-fitted to capture properties in spherical views. A change-point detection algorithm based on a statistical Neyman-Pearson test allows us to find optimal transitions between topological places. Results are presented and discussed both for indoors and outdoors experiments.

Summary (2 min read)

Introduction

  • I. I NTRODUCTION Navigating in large scale, complex and dynamic environments is a challenging task for autonomous mobile robots.
  • Semantic representation consists in adding information about the places represented by nodes in the graph used at the topological level.
  • Aplace, in this work, is therefore associated to a segment of the robot trajectory where the scene is sufficiently self similar,i.e. has the same structural properties extracted from the spherical views.
  • The authors propose a novel representation relying on spherical harmonics which are particularly well-fitted to capture the structural properties in spherical views.
  • Experimental results for indoor and outdoor environments are provided in section 4.

A. Definition

  • The authors only detail the application of spherical harmonics to their problem.
  • Fig. 3. The first five spherical harmonics bands are presented as unsigned spherical functions from the origin and by color on the unit sphere.
  • Green corresponds to positive values and red to negative values.
  • Due to the integral,fml coefficients exact computation can be very time consuming.
  • This method is widely used in computer graphics for realtime lighting rendering.

B. Spherical harmonics as environment structure description

  • Assuming that environment structure information is contained in the spherical image frequencies, pixel intensitie can be chosen as the samplesf(xi) values of the function f .
  • The spectrum coefficientsfml are stacked into a vector which constitutes the global structure descriptor.
  • In the case of the 2D discrete Fourier transform, the spectrum size is constrained by the image size.
  • In the case of the spherical harmonics, nothing constraints the required number of bands.
  • In [5], precise localization is achieved using only the first five bands.

A. Hypotheses and assumptions

  • According to their place definition as a set of positions from which environment structure is similar, the authors aim to detect the significant changes in the global descriptor value along the sequence of spherical views.
  • Changepoint detection is based on hypothesis testing: Null hypothesisH0 is the normal situation in which the observed parameters stick to the previous model.
  • Let us assume thatf0 is the probability density function under hypothesisH0 and f1 underH1.
  • The computation time is very low for a small t but increases rapidly with the number of observations.
  • Density function estimation requires identically and independently distributed samples (i.i.d).

B. Online application

  • As explained previously, the algorithm rapidly becomes time consuming and only one change-point detection is possible for a complete set of input observations.
  • Considering the density function estimation constraints aforementioned, the sliding window has to be sufficiently large for a correct estimation.
  • Spherical harmonics spectrum computation requires 290ms using the implementation described above (the sphere is sampled with 62500 samples uniformly distributed).
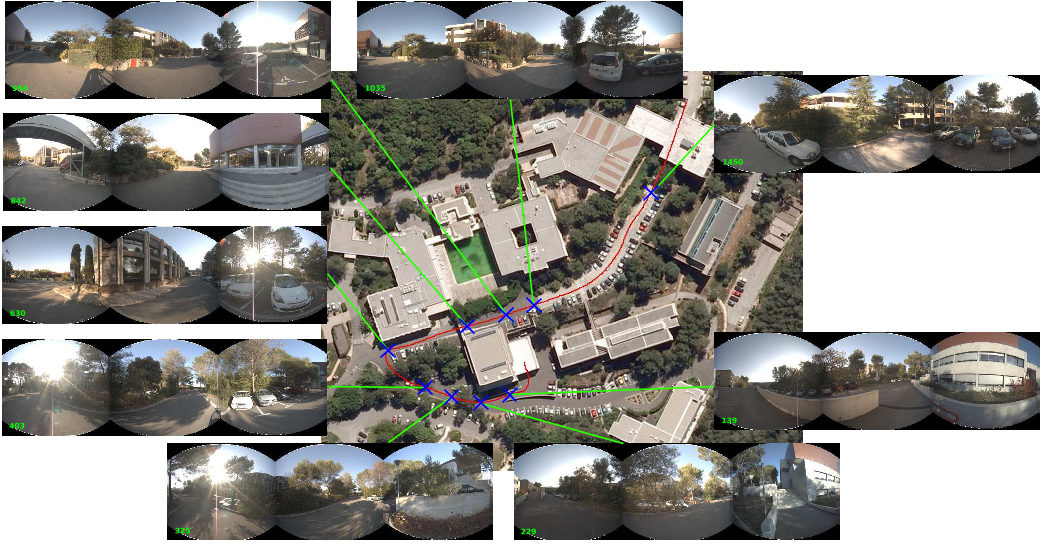
  • A. Indoor experiment analysis Figure 6 presents the robot trajectory and the detected change-points.
  • It is first interesting to notice that all changepoints correspond to important structure variations such as oorsteps or room volume variation (i.e. passing from a nook to a more open space).

B. Outdoor experiment analysis

  • The algorithm presents a certain robustnessto rotation due to the sliding window reducing the environment sensed, but the spherical harmonics spectrum is not independent to any rotation.
  • In a longer term, the segmentation algorithm could be coupled with a loop closure detection algorithm in order to improve change-point localization stability and with a semantic level by adding place classification and labelling.
  • InIEEE/RSJ International Conf. on Intelligent Robots and Systems (IROS), 2011. [13].
  • Localization in urban environments using a panoramic gist descriptor.

Did you find this useful? Give us your feedback

Content maybe subject to copyright    Report

HAL Id: hal-00845450
https://hal.inria.fr/hal-00845450
Submitted on 17 Jul 2013
HAL is a multi-disciplinary open access
archive for the deposit and dissemination of sci-
entic research documents, whether they are pub-
lished or not. The documents may come from
teaching and research institutions in France or
abroad, or from public or private research centers.
L’archive ouverte pluridisciplinaire HAL, est
destinée au dépôt et à la diusion de documents
scientiques de niveau recherche, publiés ou non,
émanant des établissements d’enseignement et de
recherche français ou étrangers, des laboratoires
publics ou privés.
Appearance-based segmentation of indoors/outdoors
sequences of spherical views
Alexandre Chapoulie, Patrick Rives, David Filliat
To cite this version:
Alexandre Chapoulie, Patrick Rives, David Filliat. Appearance-based segmentation of in-
doors/outdoors sequences of spherical views. IEEE/RSJ Int. Conf. on Intelligent Robots and Systems,
IROS’2013, Nov 2013, Tokyo, Japan. pp.1946-1951. �hal-00845450�

Appearance-based segmentation of indoors/outdoors sequences of
spherical views
Alexandre Chapoulie
1
, Patrick Rives
1
and David Filliat
2
AbstractNavigating in large scale, complex and dynamic
environments requires reliable representations able to capture
metric, topological and semantic aspects of the scene for sup-
porting path planing and real time motion control. In a previous
work [11], we addressed metric and topological representations
thanks to a multi-cameras system which allows building of
dense visual maps of large scale 3D environments. The map
is a set of locally accurate spherical panoramas related by 6dof
poses graph. The work presented here is a further step toward a
semantic representation. We aim at detecting the changes in the
structural properties of the scene during navigation. Structural
properties are estimated online using a global descriptor relying
on spherical harmonics which are particularly well-fitted to
capture properties in spherical views. A change-point detection
algorithm based on a statistical Neyman-Pearson test allows us
to find optimal transitions between topological places. Results
are presented and discussed both for indoors and outdoors
experiments.
I. INTRODUCTION
Navigating in large scale, complex and dynamic environ-
ments is a challenging task for autonomous mobile robots.
Reliable representations able to capture metric, topological
and semantic aspects of the scene have to be built for sup-
porting path planing and real time motion control algorithms
[14]. It is usual to define three levels of representation as
illustrated in fig. 1. Metric representation is used at the
control level in the design of trajectory tracking algorithms
[4]. Topological representation captures the environment
accessibility properties in a graph structure and provides a
first level of abstraction allowing complex navigation tasks
in large scale environments [21]. Semantic representation
consists in adding information about the places represented
by nodes in the graph used at the topological level. The
semantic information can be basically the name of a place
[16] or its main characteristic such as office or corridor [24].
The added information can also refer to objects presence or
other kind of information linked to the place. This level, with
a higher degree of abstraction, allows us to specify context-
based navigation tasks in terms of queries [7].
In [11], we addressed metric and topological representa-
tion levels thanks to a multi-cameras system onboard a man-
driven car which allows building of dense visual maps of
large scale 3D environments. As in Google Street View [23],
the map is composed of a set of locally accurate spherical
panoramas (fig. 2) built online along the car trajectory. The
1
INRIA Sophia Antipolis - M
´
editerran
´
ee, 2004 route
des Lucioles - BP 93, 06902 Sophia Antipolis, France
firstname.lastname@inria.fr
2
ENSTA ParisTech, 32 Boulevard Victor, 75739 Paris, France
david.filliat@ensta-paristech.fr
1234567
895AB567
C3DDE
F3DD
96B29
12345678
9ABACAD784C
E26F78
Fig. 1. Navigation-based representation
spherical views are related by 6dof poses graph estimated
using a direct multi-views registration technique [12].
Fig. 2. Example of spherical view (Inria Campus Dataset).
The work presented here is a further step toward a
semantic representation of the scene. We aim at detecting
changes in the scene structural properties (such as textures,
appearance, frequency and orientation of the straight lines,
curvatures, repeated patterns) during navigation. A place, in
this work, is therefore associated to a segment of the robot
trajectory where the scene is sufficiently self similar, i.e. has

the same structural properties extracted from the spherical
views. The main advantage of this definition is that it fits
both to indoor and outdoor environments in order to partition
the topological graph in terms of meaningful places. Such
partition also provides advantages such as increasing loop
closure algorithms efficiency [10] and can be viewed as a
first step to environment semantic labeling.
In [3], we presented preliminary results where the struc-
tural properties were estimated using a global descriptor
called GIST specially modified to deal with spherical images.
Given our place definition, GIST appears more adapted than
local descriptors like SIFT used in [17] and [25]. Without
additional constraints, local descriptors have difficulty to
represent the environment global consistency. Since it has
been introduced [15], GIST has been used multiple time in
image-based learning algorithms and in robotics for place
recognition and loop closure detection [13] or for indoor re-
gion classification [18]. Despite these good properties, GIST
is not well adapted to encompass the spherical representation
richness because sphere spatial periodicity is partially lost.
In this paper, we propose a novel representation relying
on spherical harmonics which are particularly well-fitted to
capture the structural properties in spherical views.
In the following, section 2 presents the representation
based on spherical harmonics. Section 3 is devoted to the
detection of statistical changes in the scene structural prop-
erties. Experimental results for indoor and outdoor environ-
ments are provided in section 4. The proposed method is
discussed in section 5.
II. SPHERICAL HARMONICS
Spherical harmonics are similar to the 2D Fourier trans-
form but defined on the sphere surface and take complete
advantage of the spherical representation. Noticeably, the
complete spatial periodicity of the sphere is integrated into
the spherical harmonics computation. They have already
shown their usefulness in the domain of robotics for local-
ization [5] and for visual odometry [9]. Spherical harmonics
will be used here to define a new scene structure descriptor.
A. Definition
In this paper, we only detail the application of spherical
harmonics to our problem. Further mathematical details
about spherical harmonics can be found in [2], [1], [8].
The unit sphere S
2
included in R
3
is parametrized using
spherical coordinates. An element η of S
2
is written:
η =
cos(θ)sin(φ), sin(θ)sin(φ), cos(φ)
T
(1)
The spherical harmonics are defined by:
Y
m
l
(η) =
s
2l + 1
4π
(l m)!
(l + m)!
P
|m|
l
(cos (φ)) e
j
(2)
with l N and |m| l where l is the band number
corresponding to a frequency and m is an orientation param-
eter. P
m
l
corresponds to the associated Legendre polynomials
with x [1, 1] such that:
P
m
l
(x) =
(1)
m
(1 x
2
)
m/2
2
l
l!
d
l+m
dx
l+m
(x
2
1)
l
(3)
Every function defined on the sphere surface can be
decomposed in a sum of spherical harmonics as follows:
f =
X
lN
X
|m|≤l
f
m
l
Y
m
l
(4)
The f
m
l
coefficients are obtained from a function f by:
f
m
l
=
Z
η S
2
f(η)
Y
m
l
(η) (5)
If f
m
l
= 0 for all l > L, f is said to be band limited
with a bandwidth L. The coefficients set f
m
l
is called the
spherical Fourier transform or the spectrum of f. The first
ve spherical harmonics bands are displayed in fig. 3.
Fig. 3. The first five spherical harmonics bands are presented as unsigned
spherical functions from the origin and by color on the unit sphere. Green
corresponds to positive values and red to negative values. (From [8])
Due to the integral, f
m
l
coefficients exact computation can
be very time consuming. While it exists the fast Fourier trans-
form, there exists a fast method to compute those coefficients,
based on the Monte Carlo integration, precomputed tables
and the properties of the associated Legendre polynomials.
This method is widely used in computer graphics for real-
time lighting rendering. Further details can be found in [8].
B. Spherical harmonics as environment structure description
Assuming that environment structure information is con-
tained in the spherical image frequencies, pixel intensities
can be chosen as the samples f(x
i
) values of the function
f. Spherical harmonics being a frequency description of the
spherical image, we propose to directly use the spectrum as
a structure descriptor. Frequency information corresponds to
band number l and orientation information to parameter m
(the higher l is, the higher the frequency is, see fig. 3). The
spectrum coefficients f
m
l
are stacked into a vector which
constitutes the global structure descriptor.
The number of bands used is an important parameter. In
the case of the 2D discrete Fourier transform, the spectrum
size is constrained by the image size. In the case of the spher-
ical harmonics, nothing constraints the required number of
bands. The number of coefficients follows a square function

of the number of bands. The descriptor size is S
d
= l
2
. In
fig.3, l = 5 and we have l
2
= 25 coefficients.
In computer graphics, only three bands are used due to an
exponential attenuation in bands of higher frequencies [8].
For our study, there is no such attenuation and it is hard
to determine the required number of bands. In [5], precise
localization is achieved using only the first five bands. While
we seek a global description of the environment, the first five
bands should guarantee a sufficient information.
III. CHANGE-POINT DETECTION ALGORITHM
A. Hypotheses and assumptions
According to our place definition as a set of positions
from which environment structure is similar, we aim to
detect the significant changes in the global descriptor value
along the sequence of spherical views. This can be viewed
as novelty detection as used in [19] or [20] for vehicle
safeguarding or as change-point detection as used in [17]
and [16] for landmark detection and place labelling. Change-
point detection is based on hypothesis testing:
Null hypothesis H
0
is the normal situation in which the
observed parameters stick to the previous model.
Alternate hypothesis H
1
is the alternate situation where
parameters vary from the previous model.
Change-point detection algorithm evaluates the monitored
parameters and determines when a switch occurs from hy-
pothesis H
0
to hypothesis H
1
.
Let us assume a set of independent input observations:
X
1
, X
2
, ..., X
τ1
, X
τ
, ..., X
t
(6)
Assume that the input observations X
1
, ..., X
τ1
are inde-
pendent random variables with a probability density function
f
0
(X
j
), while the observations X
τ
, ... are independent ran-
dom variables with a probability density function f
1
(X
j
).
Let us assume that f
0
is the probability density function
under hypothesis H
0
and f
1
under H
1
. Suppose we have
X
1
, ..., X
t
observations up to an instance t and we test the
above hypotheses for these observations. The likelihood ratio
(eq. 7) indicates whether the value X
j
mostly belongs to f
1
or f
0
.
s
j
= ln
f
1
(X
j
)
f
0
(X
j
)
(7)
The Neyman-Pearson lemma conducting a simple hypothesis
test, as used in [22], defines the uniformly most powerful test
as the one rejecting the null hypothesis H
0
whenever:
S
t
τ
=
t
X
j=τ
ln
f
1
(X
j
)
f
0
(X
j
)
=
t
X
j=τ
s
j
> ν (8)
The above equation yields to the simple hypothesis test:
t
c
= min{t : arg max
0τt
t
X
j=τ
ln
f
1
(X
j
)
f
0
(X
j
)
> ν} (9)
where ν is the threshold controlling the detection sensitivity.
arg max
0τt
P
t
j=τ
ln
f
1
(X
j
)
f
0
(X
j
)
> ν returns the instant τ giving the
maximum of dissimilarity between f
0
and f
1
. t being the
current instant, t
c
will be either t leading to no change-point
detection or τ which is the exact change-point instant.
This algorithm gives the exact change-point instants
whereas it needs a delay to evaluate the probability density
function f
1
. The computation time is very low for a small
t but increases rapidly with the number of observations.
No assertions are done concerning H
0
and the probability
density functions f
0
and f
1
always need to be estimated for
all the change-points τ tested over all observations.
Let’s assume the density functions under each hypothesis,
i.e. f
0
and f
1
, follow a multivariate normal distribution:
f
0
N (µ
0
, Σ
0
f
1
N (µ
1
, Σ
1
) (10)
As each hypothesis is characteristic of one topological
place, density functions characterize the structural parameters
of topological places. The mean vector represents the most
probable structural parameters set. The covariance matrix
represents the parameters distribution tolerance inside a topo-
logical place. Two matters arise concerning the distributions
parameters estimation:
Sufficient number of samples are necessary to insure
well conditioned density function estimation and in par-
ticular the covariance matrix semi-definite positiveness
property.
Density function estimation requires identically and
independently distributed samples (i.i.d). Independence
is assumed due to independent input observations as-
sumption from Neyman-Pearson lemma. Approximate
constant distance interval gathering (constant time gath-
ering with minimal distance between samples condition)
allows approximate identical distribution. This simple
method avoids accumulation at low or null speed.
B. Online application
As explained previously, the algorithm rapidly becomes
time consuming and only one change-point detection is
possible for a complete set of input observations. In order to
alleviate those limitations, we introduce a fixed size sliding
window over the signal made up of the input observations
(fig. 4). First half of the sliding window corresponds to
normal hypothesis H
0
while second half corresponds to
alternate hypothesis H
1
. Change-point hypothesis is then
tested only at the sliding window center. Each time the robot
acquires a new observation, the signal is expanded with a new
input. The sliding window always encompasses the N last
input observations. Older observations, already analysed, are
forgotten. We finally obtain an approximation (due to non
complete signal observation) of the exact change-point.
This simple trick brings many advantages. The most
obvious ones are constant time change-point detection and
dynamic signal analysis leading to an inline algorithm.
Moreover, one of the most important is multiple hypothesis
testing. This last one allows to have many change-points
over the signal contrarily to the original Neyman-Pearson
algorithm formulation.

Fig. 4. Sliding window used in the estimation process.
Considering hypotheses about the density functions and
the sliding window trick, the Neyman-Pearson final equation
results in:
S
t
τ
=
N
4
ln
|Σ
0
|
|Σ
1
|
+
N
4
µ
T
0
Σ
1
0
µ
0
+ µ
T
1
Σ
1
1
µ
1
2µ
T
0
Σ
1
0
µ
1
+
1
2
t
X
j=tN/2
X
T
j
Σ
1
0
Σ
1
1
X
j
(11)
The equation contains three terms:
First term is linked to distribution spreads. The term is
canceled for equal spreads.
Second term approximately corresponds (because of im-
possible factorization) to the squared difference between
distribution means.
Last term is the sum of the squared observations
weighted by the spread difference between the density
functions. The term is canceled for equal spreads.
As stated before, we can observe that the equation com-
putes a value linked to the difference between two distribu-
tions. The greater the difference is, the higher the value is.
In our case, this leads to change-point detection indicating a
change in the structural parameters, which corresponds to a
transition between two topological places.
An example of signal obtained with equation 11, made up
of the change-point values, is displayed in fig. 5. The signal
is filtered in the time domain with a simple Gaussian filter
(parameters: µ = 0, σ = N/10) in order to reduce the signal
noise. Peak detection mechanism relies on peak magnitude
relatively to the minima flanking the peak. Threshold (ν =
0.4) is then used on the peak amplitude and not on the
peak maximum value. This results in a peak detection less
sensitive to noise.
Considering the density function estimation constraints
aforementioned, the sliding window has to be sufficiently
large for a correct estimation. For the experiments, the size
is of 80 observations. As the minimal distance between two
samples is 0.015m, the sliding window spatial size is 1.2m.
Each density function is then estimated over a distance of
0.6m. These values satisfy the requisites for density estima-
tion but has consequences on the experiment as two change-
points cannot be closer than 0.6m for detection. This distance
Fig. 5. Sample signal obtained with the change-point detection algorithm
combined with spherical harmonics approach for structural parameters
description. Detected peaks are marked with red dots.
is a reasonable trade-off between minimal environment size
for structural parameters extraction and minimal detectable
topological place. For environments changing slowly, the
window can be larger.
IV. EXPERIMENTAL RESULTS
This section presents experimental results for topological
segmentation in indoor and outdoor environments. Testing
different kind of environment aims to show the method is
generic and robust to context change. Using various kind of
camera for spherical view acquisition furthermore highlights
the generic spherical concept. The indoor experiment was
realized in the Robotic Hall at INRIA Sophia Antipolis using
a Neobotix MP-500 platform equipped with a paracatadiop-
tric camera. In the outdoor experiment, a man-driven vehicle
equipped with the multi-cameras system described in [11]
was used. The trajectory was about 600 meters across the
INRIA Sophia Antipolis research center.
The whole code is written in Matlab without being specif-
ically optimized. Spherical harmonics spectrum computation
requires 290ms using the implementation described above
(the sphere is sampled with 62500 samples uniformly dis-
tributed). The change-point detection algorithm runs in 10ms.
The complete algorithm then runs inline in about 300ms
(acquisition up to 3.3Hz). However, the spherical harmonics
spectrum code is highly parallelizable and might take great
advantage of a C/C++ parallel implementation.
A. Indoor experiment analysis
Figure 6 presents the robot trajectory and the detected
change-points. It is first interesting to notice that all change-
points correspond to important structure variations such as
doorsteps or room volume variation (i.e. passing from a nook
to a more open space). The trajectory in the wide space is
very little segmented.
The easiest way to validate a topological place segmen-
tation algorithm is to consider the doorsteps case. This case
is illustrated by images 2680, 3480, 5328, 10455, 11954
and 12322 where change-points are precisely localized at
doorsteps. The examples illustrated by images 996, 1401 and
2044 correspond to room volume variations. Image 996 and
1401 show when the robot comes from a narrow space to
a wider space. Image 2044 shows the opposite case when
the robot leaves a wide environment to enter a quite narrow
place similar to a corridor. Images 6376 and 6624 correspond
to the detection of changes in the objects present in the

Citations
More filters
Journal ArticleDOI
TL;DR: A survey of the visual place recognition research landscape is presented, introducing the concepts behind place recognition, how a “place” is defined in a robotics context, and the major components of a place recognition system.
Abstract: Visual place recognition is a challenging problem due to the vast range of ways in which the appearance of real-world places can vary. In recent years, improvements in visual sensing capabilities, an ever-increasing focus on long-term mobile robot autonomy, and the ability to draw on state-of-the-art research in other disciplines—particularly recognition in computer vision and animal navigation in neuroscience—have all contributed to significant advances in visual place recognition systems. This paper presents a survey of the visual place recognition research landscape. We start by introducing the concepts behind place recognition—the role of place recognition in the animal kingdom, how a “place” is defined in a robotics context, and the major components of a place recognition system. Long-term robot operations have revealed that changing appearance can be a significant factor in visual place recognition failure; therefore, we discuss how place recognition solutions can implicitly or explicitly account for appearance change within the environment. Finally, we close with a discussion on the future of visual place recognition, in particular with respect to the rapid advances being made in the related fields of deep learning, semantic scene understanding, and video description.

933 citations


Cites methods from "Appearance-based segmentation of in..."

  • ...[54] combined Kalman filtering with the Neyman–Pearson Lemma....

    [...]

Journal ArticleDOI
TL;DR: This paper reviews the main solutions presented in the last fifteen years of topological mapping and localization methods, and classify them in accordance to the kind of image descriptor employed, including global, local, BoW and combinations.

179 citations

Proceedings ArticleDOI
06 Nov 2014
TL;DR: This work proposes a robust and efficient algorithm that relies on MTS-map structure and semantic description of sub-maps to relocate very fast and combines the discriminative power of semantics with the robustness of an interpretation tree to compare the graphsvery fast and outperform state-of-the-art-techniques.
Abstract: Navigation in large scale environments is challeng- ing because it requires accurate local map and global relocation ability. We present a new hybrid metric-topological-semantic map structure, called MTS-map, that allows a fine metric-based navigation and fast coarse query-based localisation. It consists of local sub-maps connected through two topological layers at metric and semantic levels. Semantic information is used to build concise local graph-based descriptions of sub-maps. We propose a robust and efficient algorithm that relies on MTS-map structure and semantic description of sub-maps to relocate very fast. We combine the discriminative power of semantics with the robustness of an interpretation tree to compare the graphs very fast and outperform state-of-the-art-techniques. The proposed approach is tested on a challenging dataset composed of more than 13000 real world images where we demonstrate the ability to relocate within 0.12ms.

14 citations

Dissertation
05 Jun 2015
TL;DR: An approach to map-based representation has been proposed by considering the following issues : how to robustly apply visual odometry by making the most of both photometric and geometric information available from the augmented spherical database.
Abstract: Our aim is concentrated around building ego-centric topometric maps represented as a graph of keyframe nodes which can be efficiently used by autonomous agents. The keyframe nodes which combines a spherical image and a depth map (augmented visual sphere) synthesises information collected in a local area of space by an embedded acquisition system. The representation of the global environment consists of a collection of augmented visual spheres that provide the necessary coverage of an operational area. A "pose" graph that links these spheres together in six degrees of freedom, also defines the domain potentially exploitable for navigation tasks in real time. As part of this research, an approach to map-based representation has been proposed by considering the following issues : how to robustly apply visual odometry by making the most of both photometric and ; geometric information available from our augmented spherical database ; how to determine the quantity and optimal placement of these augmented spheres to cover an environment completely ; how tomodel sensor uncertainties and update the dense infomation of the augmented spheres ; how to compactly represent the information contained in the augmented sphere to ensure robustness, accuracy and stability along an explored trajectory by making use of saliency maps.

7 citations


Cites background from "Appearance-based segmentation of in..."

  • ...1: Typical layers of a mapping system, courtesy of [Chapoulie et al. 2013]...

    [...]

  • ...2012][Chapoulie et al. 2013], provide a topological segmentation based on change detection in the structural properties (textures, appearance frequency, orientation of straight lines, curvatures, repeated patterns) of the scene during navigation....

    [...]

01 Jan 2018
TL;DR: This dissertation first provides a description of assistive indoor localization problem with its detailed connotations as well as overall methodology, and the framework of omnidirectional-vision-based indoor assistive localization is introduced.
Abstract: Vision-based Assistive Indoor Localization by Feng HU Advisor: Professor Zhigang Zhu An indoor localization system is of significant importance to the visually impaired in their daily lives by helping them localize themselves and further navigate an indoor environment. In this thesis, a vision-based indoor localization solution is proposed and studied with algorithms and their implementations by maximizing the usage of the visual information surrounding the users for an optimal localization from multiple stages. The contributions of the work include the following: (1) Novel combinations of a daily-used smart phone with a low-cost lens (GoPano) are used to provide an economic, portable, and robust indoor localization service for visually impaired people. (2) New omnidirectional features (omni-features) extracted from 360 degrees field-of-view images are proposed to represent visual landmarks of indoor positions, and then used as on-line query keys when a user asks for localization services. (3) A scalable and light-weight computation and storage solution is implemented by transferring big database storage and computational heavy querying procedure to the cloud. (4) Real-time query performance of 14 fps is achieved with a Wi-Fi connection by identifying and implementing both data and task parallelism using many-core NVIDIA GPUs. (5) Refine localization via 2D-to-3D and 3D-to-3D geometric matching and automatic path planning for efficient environmental modeling by utilizing architecture AutoCAD floor plans. This dissertation first provides a description of assistive indoor localization problem with its detailed connotations as well as overall methodology. Then related work in indoor localization and automatic path planing for environmental modeling is surveyed. After that, the framework of omnidirectional-vision-based indoor assistive localization is introduced. This is followed by multiple refine localization strategies such as 2D-to-3D and 3D-to-3D geometric iv matching approaches. Finally, conclusions and a few promising future research directions are provided.

2 citations


Cites background from "Appearance-based segmentation of in..."

  • ...Environment mapping or model building is the process of constructing a one-to-one or many-to-one relationships between the 3D points in the real physical space and points in the digital space [11][36][35]....

    [...]

References
More filters
Journal ArticleDOI
TL;DR: The performance of the spatial envelope model shows that specific information about object shape or identity is not a requirement for scene categorization and that modeling a holistic representation of the scene informs about its probable semantic category.
Abstract: In this paper, we propose a computational model of the recognition of real world scenes that bypasses the segmentation and the processing of individual objects or regions. The procedure is based on a very low dimensional representation of the scene, that we term the Spatial Envelope. We propose a set of perceptual dimensions (naturalness, openness, roughness, expansion, ruggedness) that represent the dominant spatial structure of a scene. Then, we show that these dimensions may be reliably estimated using spectral and coarsely localized information. The model generates a multidimensional space in which scenes sharing membership in semantic categories (e.g., streets, highways, coasts) are projected closed together. The performance of the spatial envelope model shows that specific information about object shape or identity is not a requirement for scene categorization and that modeling a holistic representation of the scene informs about its probable semantic category.

6,882 citations


"Appearance-based segmentation of in..." refers methods in this paper

  • ...Since it has been introduced [15], GIST has been used multiple time in image-based learning algorithms and in robotics for place recognition and loop closure detection [13] or for indoor region classification [18]....

    [...]

Journal ArticleDOI
TL;DR: This paper defines a specific type of semantic maps, which integrates hierarchical spatial information and semantic knowledge, and describes how these semantic maps can improve task planning in two ways: extending the capabilities of the planner by reasoning about semantic information, and improving the planning efficiency in large domains.

285 citations


"Appearance-based segmentation of in..." refers background in this paper

  • ...This level, with a higher degree of abstraction, allows us to specify contextbased navigation tasks in terms of queries [7]....

    [...]

01 Jan 2003
TL;DR: Spherical Harmonic lighting is a technique for calculating the lighting on 3D models from area light sources that allows for global illumination style images in real time and is a toolbox of interrelated techniques that the games community can use to good effect.
Abstract: Spherical Harmonic lighting (SH lighting) is a technique for calculating the lighting on 3D models from area light sources that allows us to capture, relight and display global illumination style images in real time. It was introduced in a paper at Siggraph 2002 by Sloan, Kautz and Snyder as a technique for ultra realistic lighting of models. Looking a little closer at it’s derivation we can show that it is in fact a toolbox of interrelated techniques that the games community can use to good effect.

221 citations


"Appearance-based segmentation of in..." refers background in this paper

  • ...In computer graphics, only three bands are used due to an exponential attenuation in bands of higher frequencies [8]....

    [...]

  • ...Further mathematical details about spherical harmonics can be found in [2], [1], [8]....

    [...]

Journal ArticleDOI
TL;DR: The metric and topological paradigms are integrated in a hybrid system for both localization and map building, allowing a compact environment model, which does not require global metric consistency and permits both precision and robustness.

192 citations


"Appearance-based segmentation of in..." refers background in this paper

  • ...Topological representation captures the environment accessibility properties in a graph structure and provides a first level of abstraction allowing complex navigation tasks in large scale environments [21]....

    [...]

Journal ArticleDOI
TL;DR: A body of work aimed at extending the reach of mobile navigation and mapping is described, showing how running topological and metric mapping and pose estimation processes concurrently, using vision and laser ranging, has produced a full six-degree-of-freedom outdoor navigation system.
Abstract: In this paper we describe a body of work aimed at extending the reach of mobile navigation and mapping. We describe how running topological and metric mapping and pose estimation processes concurrently, using vision and laser ranging, has produced a full six-degree-of-freedom outdoor navigation system. It is capable of producing intricate three-dimensional maps over many kilometers and in real time. We consider issues concerning the intrinsic quality of the built maps and describe our progress towards adding semantic labels to maps via scene de-construction and labeling. We show how our choices of representation, inference methods and use of both topological and metric techniques naturally allow us to fuse maps built from multiple sessions with no need for manual frame alignment or data association.

154 citations


"Appearance-based segmentation of in..." refers background in this paper

  • ...Reliable representations able to capture metric, topological and semantic aspects of the scene have to be built for supporting path planing and real time motion control algorithms [14]....

    [...]

Frequently Asked Questions (12)
Q1. What contributions have the authors mentioned in the paper "Appearance-based segmentation of indoors/outdoors sequences of spherical views" ?

In a previous work [ 11 ], the authors addressed metric and topological representations thanks to a multi-cameras system which allows building of dense visual maps of large scale 3D environments. The authors aim at detecting the changes in the structural properties of the scene during navigation. The work presented here is a further step toward a semantic representation. 

For future work, the authors plan to improve their algorithm robustness to illumination condition following [ 6 ] and its rotation independence. De-rotation mechanism can be applied as rotations can be estimated from spectra. 

The segmentation algorithm relies on an efficient change-point detection based on multi-hypothesis testing and allowing constant time computation. 

In a longer term, the segmentation algorithm could be coupled with a loop closure detection algorithm in orderto improve change-point localization stability and with a semantic level by adding place classification and labelling. 

Pml corresponds to the associated Legendre polynomials with x ∈ [−1, 1] such that:Pml (x) = (−1)m(1− x2)m/22ll!dl+mdxl+m (x2 − 1)l (3)Every function defined on the sphere surface can be decomposed in a sum of spherical harmonics as follows:f = ∑l∈N∑|m|≤lfml Y m l (4)The fml coefficients are obtained from a function f by:fml =∫η∈S2 f(η)Y ml (η)dη (5)If fml = 0 for all l > L, f is said to be band limited with a bandwidth L. The coefficients set fml is called the spherical Fourier transform or the spectrum of f . 

As descriptors are based on appearance frequencies, when the robot approaches walls, frequencies become lower and a new topological place is defined. 

the spherical harmonics spectrum code is highly parallelizable and might take great advantage of a C/C++ parallel implementation. 

Considering the density function estimation constraints aforementioned, the sliding window has to be sufficiently large for a correct estimation. 

Let’s assume the density functions under each hypothesis, i.e. f0 and f1, follow a multivariate normal distribution:f0 ∼ N (µ0,Σ0 f1 ∼ N (µ1,Σ1) (10)As each hypothesis is characteristic of one topological place, density functions characterize the structural parameters of topological places. 

Spherical harmonics being a frequency description of the spherical image, the authors propose to directly use the spectrum as a structure descriptor. 

Spherical harmonics spectrum computation requires 290ms using the implementation described above (the sphere is sampled with 62500 samples uniformly distributed). 

Frequency information corresponds to band number l and orientation information to parameter m (the higher l is, the higher the frequency is, see fig.