scispace - formally typeset
Search or ask a question
Proceedings ArticleDOI

Arterial blood pressure analysis based on scattering transform II

TL;DR: This article presents a new method for analyzing arterial blood pressure waves based on the scattering transform which is analogous to the Fourier transform where the solitons play the role of sinus and cosinus components.
Abstract: This article presents a new method for analyzing arterial blood pressure waves. The technique is based on the scattering transform and consists in solving the spectral problem associated to a one-dimensional Schrodinger operator with a potential depending linearly upon the pressure. This potential is then expressed with the discrete spectrum which includes negative eigenvalues and corresponds to the interacting components of an N-soliton. The approach is analogous to the Fourier transform where the solitons play the role of sinus and cosinus components. The proposed method seems to have interesting clinical applications. It can be used for example to separate the fast and slow parts of the blood pressure that correspond to the systolic (pulse transit time) and diastolic phases (low velocity flow) respectively.

Summary (1 min read)

Introduction

  • The cardiovascular system, composed of the heart and a complex vascular network, provides oxygen and nutrients to all the body.
  • A standard description of the blood pressure and flow waves uses the linear Fourier analysis where the waves are decomposed into sinus and cosinus components.
  • Many studies were carried out in order to separate.
  • The decomposition of the ABP into a nonlinear superposition of solitons introduced in this article is based on an elegant mathematical transform : the scattering transform for a one-dimensional Schrödinger equation [1], [5], [6].
  • This Scattering-Based Signal Analysis (SBSA) method was introduced in [10].

II. A SCATTERING-BASED SIGNAL ANALYSIS METHOD

  • The authors introduce an original method for reconstructing signals based on the scattering transform.
  • The authors start by briefly recalling the basis of the Direct and Inverse Scattering Transforms (DST & IST) and then present the main idea in the SBSA technique.

B. SBSA principle

  • The authors now present the SBSA technique which is essentially inspired from the results established in the case of a reflectionless potential that have been recalled in the previous subsection.
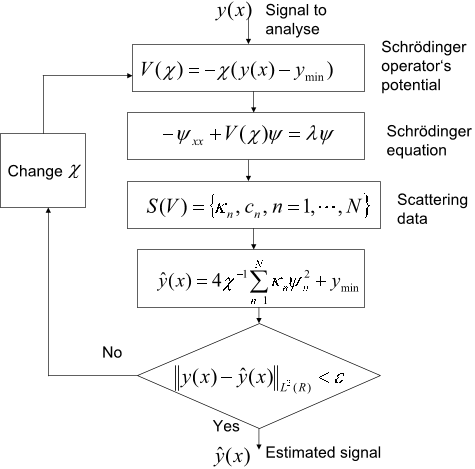
  • Determining the parameter χ determines the number N(χ) of negative eigenvalues and hence the number of solitons components required for a satisfying approximation of the signal y. Fig. 1 summarizes the SBSA method.

III. A SOLITON-BASED DECOMPOSITION OF THE ABP

  • The SBSA method is applied to the ABP signal.
  • An interesting application is also presented which consists in separating systolic and diastolic phases.

A. Reconstruction of the ABP

  • The Schrödinger operator potential V depends linearly upon the ABP signal V (t) = −χP(t).
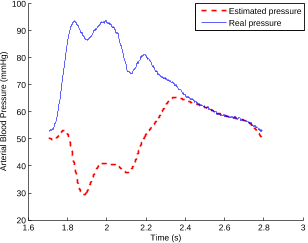
  • Fig. 2 and Fig. 3 compare measured and estimated pressures at the aorta and at the finger levels for different values of the number N(χ) of the solitons’ components.
  • In Fig. 4, several beats of measured and reconstructed pressures are considered.

IV. CONCLUSIONS

  • This article presents a new method for analyzing ABP waves.
  • This approach is based on the scattering transform and deals with the solution of the spectral problem of a perturbed Schrödinger operator for a given potential.
  • The latter is then expressed in a new base which components are solitons.
  • It seems through the satisfactory results obtained that this method can lead to interesting clinical applications, for instance the separation of the ABP into its systolic and diastolic phases.
  • Promising results are presented in their second article [11].

Did you find this useful? Give us your feedback

Content maybe subject to copyright    Report

HAL Id: inria-00139527
https://hal.inria.fr/inria-00139527v2
Submitted on 20 Jun 2007
HAL is a multi-disciplinary open access
archive for the deposit and dissemination of sci-
entic research documents, whether they are pub-
lished or not. The documents may come from
teaching and research institutions in France or
abroad, or from public or private research centers.
L’archive ouverte pluridisciplinaire HAL, est
destinée au dépôt et à la diusion de documents
scientiques de niveau recherche, publiés ou non,
émanant des établissements d’enseignement et de
recherche français ou étrangers, des laboratoires
publics ou privés.
Arterial blood pressure analysis based on scattering
transform I
Taous-Meriem Laleg, Emmanuelle Crépeau, Yves Papelier, Michel Sorine
To cite this version:
Taous-Meriem Laleg, Emmanuelle Crépeau, Yves Papelier, Michel Sorine. Arterial blood pressure
analysis based on scattering transform I. EMBC Sciences and Technologies for Health, Aug 2007,
Lyon, France. �inria-00139527v2�

Arterial blood pressure analysis based on scattering transform I
Taous-Meriem Laleg, Emmanuelle Crépeau, Yves Papelier and Michel Sorine
Abstract This article presents a new method for analyzing
arterial blood pressure waves. The technique is based on
the scattering transform and consists in solving the spectral
problem associated to a one-dimensional Schrödinger operator
with a potential depending linearly upon the pressure. This
potential is then expressed with the discrete spectrum which
includes negative eigenvalues and corresponds to the interacting
components of an N-soliton. The approach is analogous to the
Fourier transform where the solitons play the role of sinus
and cosinus components. The proposed method seems to have
interesting clinical applications. It can be used for example to
separate the fast and slow parts of the blood pressure that
correspond to the systolic (pulse transit time) and diastolic
phases (low velocity flow) respectively.
I. INTRODUCTION
The cardiovascular system, composed of the heart and a
complex vascular network, provides oxygen and nutrients to
all the body. Pressure and flow waves are created by the
beating heart and propagate through the aorta and the major
arteries to the periphery. The analysis of the Arterial Blood
Pressure (ABP) in daily clinical practice is often restricted
to the maximal and the minimal values of the pressure wave
called systolic and diastolic pressures respectively. However,
in this case, none information about the instantaneous varia-
bility of the pressure is provided. Many studies were devoted
to model and analyse the ABP waveform and many models
were proposed from the well-known windkessel model [22]
to the more complex three dimensional models [13].
A standard description of the blood pressure and flow
waves uses the linear Fourier analysis where the waves
are decomposed into sinus and cosinus components. The
Fourier decomposition is applicable if two assumptions are
satisfied. First, the arterial system is supposed to be linear so
that the superposition principle applies. Then, the pressure
and flow must be measured in steady state conditions at
constant heart rate [21]. About 12 to 15 harmonics are needed
for a good reconstruction of the ABP waves. To explain
the waves contour and interpret the changes in the pulse
pressure when it propagates along the arterial tree like the
increase in the amplitude and the decrease in the width
called "Peaking" and "Steepening" phenomena respectively,
this approach supposes the existence of backward waves.
Each harmonic consists then of an incident wave propagating
away from the heart and a reflected wave travelling towards
the heart. Many studies were carried out in order to separate
The authors are with INRIA-Rocquencourt, B.P. 105, 78153 Le Chesnay
cedex, France, taous-meriem.laleg@inria.fr
emmanuelle.crepeau@inria.fr,
yves.papelier@inria.fr,
michel.sorine@inria.fr.
the ABP into its forward and backward components as in the
pioneering work of Westerhof et al [23] followed by many
others [16], [17], [18].
Instead of the usual decomposition of the ABP into a linear
superposition of sinus and cosinus, in this article, we propose
to use a nonlinear superposition of solitary waves or solitons.
The concept of soliton refers in fact to a solitary wave
emerging unchanged in shape and speed from the collision
with other solitary waves [19]. They fascinate the scientists
with their very interesting coherent-structure characteristics
and are used in many fields and to model natural phenomena.
Solitons are solutions of nonlinear dispersive equations like
the Korteweg-de Vries (KdV) equation arising in a variety
of physical problems, for example to describe wave motion
in shallow water canals. This third order nonlinear partial
derivative equation (NPDE) includes both nonlinear and
dispersive effects and solitons result here from a stable
equilibrium between these effects [20], [25].
The use of solitons to describe the ABP was already
introduced in [24] and in [15] where a KdV equation and a
Boussinesq equation were respectively proposed as a blood
flow model. Recently, in [2], [9] an interesting reduced model
of the ABP was introduced. The latter consists of a sum of
a 2 or 3-solitons, solution of a KdV equation, describing
fast phenomena during the systolic phase and a 2-element
windkessel model describing slow phenomena during the
diastolic phase. We recall that the systolic phase corresponds
to the contraction of the heart, driving blood out of the left
ventricle while the diastolic phase corresponds to the period
of relaxation of the heart. We point out that the introduction
of solitons in the ABP model explains the peaking and the
steepening phenomena [9].
The decomposition of the ABP into a nonlinear super-
position of solitons introduced in this article is based on
an elegant mathematical transform : the scattering transform
for a one-dimensional Schrödinger equation [1], [5], [6].
This Scattering-Based Signal Analysis (SBSA) method was
introduced in [10]. The main idea in the SBSA consists in
solving the spectral problem of a one-dimensional Schrödin-
ger operator with a potential depending linearly upon the
pressure wave. This potential is then expressed with the
discrete spectrum which includes negative eigenvalues and
corresponds to the interacting components of an N-soliton.
In the next section, we recall the basis of the SBSA method
that is used to reconstruct and analyse the ABP waves.
Section III illustrates a good agreement between real and
reconstructed pressures using the SBSA. We also present an
interesting clinical application which consists in separating
the fast and slow components of the ABP which are related

to the systolic and diastolic phases respectively. Finally a
conclusion summarizes the different results.
II. A SCATTERING-BASED SIGNAL ANALYSIS
METHOD
In this section, we introduce an original method for
reconstructing signals based on the scattering transform. We
start by briefly recalling the basis of the Direct and Inverse
Scattering Transforms (DST & IST) and then present the
main idea in the SBSA technique.
A. Scattering transform for a Schrödinger equation
The stationary one-dimensional Schrödinger equation is
given by :
2
ψ
x
2
+V
ψ
=
λ ψ
, < x < +. (1)
where x is the space variable,
λ
and
ψ
are respectively
the eigenvalues and the associated eigenfunctions. V is the
potential of the Schrödinger operator L(V ) =
2
x
2
+V.
In this study we suppose that the function V belongs to
the Schwartz space S (R) of regular and rapidly decreasing
functions on R.
The DST of the potential V is the solution of the spectral
problem for L(V ). The spectrum of this operator has two
components : a continuous spectrum including positive ei-
genvalues and a discrete spectrum with negative eigenvalues
[1], [4], [5], [6], [12]. Denoting the positive eigenvalues
by
λ
= k
2
, the continuous spectrum is characterized by
the following asymptotic boundary conditions where T (k)
and R(k) are respectively the transmission and the reflection
coefficients associated to V :
ψ
(x, k) T (k)exp (ikx), x , (2)
ψ
(x, k) exp(ikx)+R(k)exp(ikx), x +. (3)
Conservation of energy leads to |T (k)|
2
+ |R(k)|
2
= 1.
We note the negative eigenvalues
λ
n
=
κ
2
n
, n = 1, · ·· , N
with N their number. The discrete eigenfunctions
ψ
n
are L
2
-
normalized such that :
Z
+
ψ
n
(x)
2
dx = 1. (4)
and behave as
ψ
n
(x) c
n
exp(
κ
n
x) in the limit of large x
where the coefficients c
n
are defined by :
c
n
= lim
x+
exp(
κ
n
x)
ψ
n
(x), n = 1, ·· · , N. (5)
So, the DST S of V is the collection of data S(V ) called
scattering data and defined by :
S(V ) = (R,
κ
n
, c
n
, n = 1, ·· · , N). (6)
The inverse problem or IST consists in reconstructing the
Schrödinger operator’s potential from its spectral data. The
IST is based on the Gel’fand-Levitan-Marchenko (GLM)
integral equation [1], [5]. In this study we are only interested
in a special situation which corresponds to a reflectionless
potential.
A reflectionless potential is a potential for which the
reflection coefficient R(k) is zero. This means that there is
no contribution from the continuous spectrum. This situation
leads to an interesting representation of the potential with
the discrete spectrum only [6] as it is given in the following
theorem :
Theorem : If V is a reflectionless potential of the Schrö-
dinger equation (1) then :
V (x) = 4
N
n=1
κ
n
ψ
2
n
(x), x R. (7)
An interesting relation between solitons, solutions of a
KdV equation and the discret spectrum of the Schrödinger
operator was introduced in [6]. Indeed, from a reflectionless
potential of (1) that evolves, in time and space, according
to a KdV equation, there emerge, for t +, N solitons,
each one characterized by a pair (
κ
n
, c
n
) such that 4
κ
2
n
gives
the speed of the soliton and c
n
its position. Therefore each
component 4
κ
n
ψ
2
n
of the previous sum refers to a single
soliton.
B. SBSA principle
We now present the SBSA technique which is essentially
inspired from the results established in the case of a re-
flectionless potential that have been recalled in the previous
subsection.
We note y the signal that we want to reconstruct and ana-
lyse and we suppose that the potential V of the Schrödinger
operator L depends linearly upon y :
V (y) =
χ
(y y
min
), (8)
where y
min
is a constant such that y y
min
> 0 and
χ
a
positive parameter to determine.
The main idea is then to find the parameter
χ
such that
the signal y is well approximated by the reflectionless part of
the potential which can be written then using equation (7) :
ˆy = 4
χ
1
N
n=1
κ
n
ψ
2
n
+ y
min
, (9)
where
κ
2
n
and
ψ
n
, n = 1, · ·· , N are respectively the N
negative eigenvalues and the corresponding L
2
-normalized
eigenfunctions for the potential V , determined by the DST.
This situation corresponds in fact to the decomposition of
the signal y into a nonlinear superposition of solitons [10].
It is important to recall the role of the parameter
χ
and
its influence on the number of negative eigenvalues. The
potential V is a well of variable depth which is determined
by
χ
. The number of the negative eigenvalues N(
χ
) is a
nondecreasing function of
χ
and there is an infinite unboun-
ded sequence of values of
χ
at which N(
χ
) is incremented
by one, the new eigenvalue being born from the continuous
spectrum [7], [10], [14].
Determining the parameter
χ
determines the number N(
χ
)
of negative eigenvalues and hence the number of solitons
components required for a satisfying approximation of the
signal y. Fig. 1 summarizes the SBSA method.

Fig. 1. Signals analysis with the SBSA method
III. A SOLITON-BASED DECOMPOSITION OF THE
ABP
In this section, the SBSA method is applied to the ABP
signal. An interesting application is also presented which
consists in separating systolic and diastolic phases. For a
convenient use, we solve the SBSA by replacing the space
variable x by the time variable t.
A. Reconstruction of the ABP
Let P(t) be the ABP signal. The Schrödinger operator
potential V depends linearly upon the ABP signal V (t) =
χ
P(t).
Fig. 2 and Fig. 3 compare measured and estimated pres-
sures at the aorta and at the finger levels for different
values of the number N(
χ
) of the solitons’ components.
We notice that only 5 to 10 components are sufficient for
a good approximation of the ABP. In Fig. 4, several beats of
measured and reconstructed pressures are considered.
B. Separation of the systolic and diastolic phases
Now we exploit the SBSA to separate the pressure into
its fast and slow parts which correspond respectively to the
systolic and diastolic phases. We suppose that the N
f
= 2 or
3 largest
κ
2
n
describe fast phenomena and the N
s
= N N
f
smallest
κ
2
n
describe slow phenomena. Then, the following
ˆ
P
f
(t) = 4
χ
1
N
f
n=1
κ
n
ψ
2
n
, (10)
ˆ
P
s
(t) = 4
χ
1
N
n=N
f
+1
κ
n
ψ
2
n
, (11)
are good candidates to represent respectively the fast and
slow phenomena in the ABP. This is confirmed by the
1.6 1.8 2 2.2 2.4 2.6 2.8 3
50
55
60
65
70
75
80
85
90
95
Time (s)
Arterial Blood Pressure (mmHg)
Estimated pressure
Real pressure
1.6 1.8 2 2.2 2.4 2.6 2.8 3
50
55
60
65
70
75
80
85
90
95
Time (s)
Arterial Blood Pressure (mmHg)
Estimated pressure
Real pressure
1.6 1.8 2 2.2 2.4 2.6 2.8 3
50
55
60
65
70
75
80
85
90
95
Time (s)
Arterial Blood Pressure (mmHg)
Estimated pressure
Real pressure
1.6 1.8 2 2.2 2.4 2.6 2.8 3
50
55
60
65
70
75
80
85
90
95
Time (s)
Arterial Blood Pressure (mmHg)
Estimated pressure
Real pressure
Fig. 2. Measured and reconstructed pressures at the aorta with N solitons.
From left to right : N = 3, N = 5 (Up). N = 7, N = 9 (Down)
1.6 1.8 2 2.2 2.4 2.6 2.8 3
50
60
70
80
90
100
110
120
130
140
Time (s)
Arterial Blood Pressure (mmHg)
Estimated pressure
Real pressure
1.6 1.8 2 2.2 2.4 2.6 2.8 3
50
60
70
80
90
100
110
120
130
140
Time (s)
Arterial Blood Pressure (mmHg)
Estimated pressure
Real pressure
1.6 1.8 2 2.2 2.4 2.6 2.8 3
50
60
70
80
90
100
110
120
130
140
Time (s)
Arterial Blood Pressure (mmHg)
Estimated pressure
Real pressure
1.6 1.8 2 2.2 2.4 2.6 2.8 3
50
60
70
80
90
100
110
120
130
140
Estimated pressure
Real pressure
Fig. 3. Measured and reconstructed pressures at the finger with N solitons.
From left to right : N = 3, N = 5 (Up). N = 7, N = 9 (Down)
experimental results. For N
f
= 2 and N = 9, Fig. 5 and Fig. 6
show that
ˆ
P
f
and
ˆ
P
s
are respectively localized during the
systole and the diastole, as expected.
This decomposition of the ABP into fast and slow parts
completes the results obtained in [2], [3], [8], [9].
IV. CONCLUSIONS
This article presents a new method for analyzing ABP
waves. This approach is based on the scattering transform
and deals with the solution of the spectral problem of a
perturbed Schrödinger operator for a given potential. The
latter is then expressed in a new base which components are
solitons. It seems through the satisfactory results obtained
that this method can lead to interesting clinical applications,
for instance the separation of the ABP into its systolic and
diastolic phases. Moreover, the SBSA provides interesting
ABP indices that can be analyzed in various clinical and
physiological conditions. Promising results are presented in

0 2 4 6 8 10 12 14
50
55
60
65
70
75
80
85
90
95
100
Time (s)
Arterial Blood Pressure (mmHg)
Estimated pressure
Real pressure
0 2 4 6 8 10 12 14
50
60
70
80
90
100
110
120
130
140
Time (s)
Arterial Blood Pressure (mmHg)
Estimated pressure
Real pressure
Fig. 4. Multi-beat measures and estimates : Aorta (up) and Finger (down)
1.6 1.8 2 2.2 2.4 2.6 2.8 3
0
10
20
30
40
50
60
70
80
90
100
Time (s)
Arterial Blood Pressure (mmHg)
Estimated pressure
Real pressure
Fig. 5.
ˆ
P
f
and fast systolic phenomena
our second article [11].
REFERENCES
[1] F. Calogero and A. Degasperis, Spectral Transform and Solitons,
J. Lions, G. Papanicolaou, R. Rockafellar, and H. Fujita, Eds. North
Holland, 1982.
[2] E. Crépeau and M. Sorine, “Identifiability of a reduced model of
pulsatile flow in an arterial compartment, in Proc. IEEE CDC and
ECC, December 2005.
[3] E. Crépeau and M. Sorine, A reduced model of pulsatile flow in an
arterial compartment, Chaos Solitons & Fractals, vol. 34, pp. 594–
605, 2007.
[4] P. A. Deift and E. Trubowitz, “Inverse scattering on the line, Commu-
nications on Pure and Applied Mathematics, vol. XXXII, pp. 121–251,
1979.
[5] W. Eckhaus and A. Vanharten, The Inverse Scattering Transformation
and the Theory of Solitons. North-Holland, 1983.
[6] C. S. Gardner, J. M. Greene, M. D. Kruskal, and R. M. Miura,
“Korteweg-de vries equation and generalizations VI. Methods for
exact solution, in Communications on pure and applied mathematics.
J.Wiley & sons, 1974, vol. XXVII, pp. 97–133.
1.6 1.8 2 2.2 2.4 2.6 2.8 3
20
30
40
50
60
70
80
90
100
Time (s)
Arterial Blood Pressure (mmHg)
Estimated pressure
Real pressure
Fig. 6.
ˆ
P
s
and slow diastolic phenomena
[7] T. Kato, Perturbation Theory for Linear Operators, 2nd ed. Springer-
Verlag Berlin Heidelberg New York, 1976.
[8] T. M. Laleg, E. Crépeau, and M. Sorine, Arterial pressure modelling
by an integrable approximation of navier-stokes equations, in Proc.
5
th
Mathmod Vienna Proceedings, vol. 1, no. 30. ARGESIM Report,
February 2006, p. 337.
[9] ——, “Separation of arterial pressure into solitary waves and wind-
kessel flow, in Proc. 6
th
IFAC Symposium on Modelling and Control
in Biomedical Systems, Reims (France), September 2006.
[10] ——, “Travelling-wave analysis and identification. A scattering theory
framework, in Proc. European Control Conference ECC, Kos, Greece,
July 2007.
[11] T. M. Laleg, E. Médigue, F. Cottin, and M. Sorine, Arterial blood
pressure analysis based on scattering transform II, in Proc. EMBC,
Sciences and technologies for health, Lyon, France, August 2007.
[12] L. D. Landau and E. M. Lifshitz, Quantum Mechanics : Non-
Relativistic Theory. Pergamon Press, 1958, vol. 3.
[13] D. A. McDonald, Blood flow in arteries, 2
nd
ed. Edward Arnold,
1974.
[14] P. D. Miller and S. R. Clarke, An exactly solvable model for the
interaction of linear waves with korteweg-de vries solitons, SIAM J.
MATH. ANAL., vol. 33, no. 2, pp. 261–285, 2001.
[15] J. F. Paquerot and M. Remoissenet, “Dynamics of nonlinear blood
pressure waves in large arteries, Physics Letters A, pp. 77–82, October
1994.
[16] K. H. Parker and J. H. Jones, “Forward and backward running waves
in arteries : analysis using the method of characteristics, ASME J.
Biomech. Eng., no. 112, pp. 322–326, 1990.
[17] F. Pythoud, N. Stergiopulos, and J. J. Meister, “Forward and backward
waves in the arterial system : nonlinear separation using riemann
invariants, Technology and Health Care, vol. 3, pp. 201–207, 1995.
[18] ——, “Separation of arterial pressure waves into their forward and ba-
ckward running components, Journal of Biomechanical Engineering,
vol. 118, pp. 295–301, 1996.
[19] M. Remoissenet, Waves called solitons, concepts and experiments,
3
rd
ed. Springer, 1999.
[20] A. C. Scott, F. Y. F. Chu, and D. W. McLaughlin, “The soliton : A
new concept in applied science, Proceedings of the IEEE, vol. 61,
no. 10, pp. 1443–1483, October 1973.
[21] P. Segers and P. Verdonck, Principles of Vascular Physiology. Pan-
vascular Medecine. Integrated Clinical Managements. Springer Verlag,
2002, ch. 6, pp. 116–137.
[22] N. Stergiopulos, P. Segers, and N. Westerhof, “Use of pulse pressure
method for estimating total arterial compliance in vivo, The American
Physiological Society, no. 276, pp. 424–428, 1999.
[23] N. Westerhof, P. Sipkema, G. C. V. D. Bos, and G. Elzinga, “Forward
and backward waves in the arterial system, Cardiovascular Research,
vol. 6, pp. 648–656, 1972.
[24] S. Yomosa, “Solitary waves in large vessels, Journal of the Physical
Society of Japan, vol. 50, no. 2, pp. 506–520, February 1987.
[25] N. J. Zabusky and M. D. Kruskal, “Interation of soliton’ in a
collisionless plasma and the recurrence of initial states, Physical
Review Letters, vol. 15, no. 6, pp. 240–243, 1965.
Citations
More filters
Journal ArticleDOI
TL;DR: An approach for prescribing lumped parameter outflow boundary conditions that accommodate transient phenomena is presented and applied to compute haemodynamic quantities in different physiologically relevant cardiovascular models to study non-periodic flow phenomena often observed in normal subjects and in patients with acquired or congenital cardiovascular disease.
Abstract: The simulation of blood flow and pressure in arteries requires outflow boundary conditions that incorporate models of downstream domains. We previously described a coupled multidomain method to couple analytical models of the downstream domains with 3D numerical models of the upstream vasculature. This prior work either included pure resistance boundary conditions or impedance boundary conditions based on assumed periodicity of the solution. However, flow and pressure in arteries are not necessarily periodic in time due to heart rate variability, respiration, complex transitional flow or acute physiological changes. We present herein an approach for prescribing lumped parameter outflow boundary conditions that accommodate transient phenomena. We have applied this method to compute haemodynamic quantities in different physiologically relevant cardiovascular models, including patient-specific examples, to study non-periodic flow phenomena often observed in normal subjects and in patients with acquired or congenital cardiovascular disease. The relevance of using boundary conditions that accommodate transient phenomena compared with boundary conditions that assume periodicity of the solution is discussed.

275 citations


Cites background from "Arterial blood pressure analysis ba..."

  • ...Flow and pressure in the carotid artery are naturally aperiodic due to heart rate variability, breathing and other physiological factors (Holdsworth et al. 1999; Laleg et al. 2007)....

    [...]

Journal ArticleDOI
TL;DR: A reduced-order model algorithm, called ALP, is proposed to solve nonlinear evolution partial differential equations, based on approximations of generalized Lax pairs, which is well-suited to solving problems with progressive front or wave propagation.

66 citations

Journal ArticleDOI
TL;DR: In this paper, a semi-classical approach based on the potential of a Schrodinger operator was proposed for signal analysis of arterial blood pressure waveforms, and the first results obtained with this method on the analysis of the waveform were presented.
Abstract: This study introduces a new signal analysis method, based on a semi-classical approach. The main idea in this method is to interpret a pulse-shaped signal as a potential of a Schrodinger operator and then to use the discrete spectrum of this operator for the analysis of the signal. We present some numerical examples and the first results obtained with this method on the analysis of arterial blood pressure waveforms.

46 citations

Journal ArticleDOI
TL;DR: This work presents an approach for prescribing lumped parameter outflow boundary conditions that accommodate transient phenomena and has applied this method to compute hemodynamic quantities in different physiologically relevant cardiovascular models to study non-periodic flow phenomena often observed in normal subjects and in patients with acquired or congenital cardiovascular disease.

34 citations

Journal ArticleDOI
TL;DR: A Semi-Classical Signal Analysis method for stroke volume (SV) variations assessment from arterial blood pressure measurements and one of the SCSA parameters, the first systolic invariant (INVS1), has been shown to be linearly related to SV.
Abstract: This study proposes a Semi-Classical Signal Analysis (SCSA) method for stroke volume (SV) variations assessment from arterial blood pressure measurements One of the SCSA parameters, the first systolic invariant (INVS1), has been shown to be linearly related to SV To technically validate this approach, the comparison between INVS1 and SV measured with the currently used PiCCO technique was performed during a 15-min recording in 20 mechanically ventilated patients in intensive care A strong correlation was estimated by linear regression and cross-correlation analysis (mean coefficient = 090 ± 001 SEM at the two tests)

31 citations

References
More filters
Journal ArticleDOI
TL;DR: In this article, a soliton theory for a simplified and an idealized model-system of the blood motion in large blood vessels is proposed, which is performed for an infinitely long, straight, circular, homogeneous thin-walled elastic tube filled with an ideal fluid.
Abstract: In order to elucidate the dynamical features of the pulsatile blood flow in large arteries, we propose a soliton theory for a simplified and an idealized model-system of the blood motion in large blood vessels. The theory is performed for an infinitely long, straight, circular, homogeneous thin-walled elastic tube filled with an ideal fluid. It is shown the pulse waves of pressure and flow propagating through the arteries can be described as solitary waves excited by cardiac ejections of blood and the features of the pulse wave such as “peaking” and “steepening” are interpreted in the viewpoint of soliton. The clinical importance of the “lowest blood pressure” and the “pulse-pressure”, which corresponds to the amplitude of pressure pule-wave, is physically explained by the formula obtained from our theory.

193 citations


"Arterial blood pressure analysis ba..." refers methods in this paper

  • ...The use of solitons to describe the ABP was already introduced in [24] and in [15] where a KdV equation and a Boussinesq equation were respectively proposed as a blood flow model....

    [...]

Journal ArticleDOI
TL;DR: It is concluded that 60% of total arterial compliance resides in the proximal aorta, and when the inverse relationship between pressure and compliance is taken into account, the contribution of the proxies to the total arterials compliance is even more significant.
Abstract: We determined total arterial compliance from pressure and flow in the ascending aorta of seven anesthetized dogs using the pulse pressure method (PPM) and the decay time method (DTM). Compliance was determined under control and during occlusion of the aorta at four different locations (iliac, renal, diaphragm, and proximal descending thoracic aorta). Compliance of PPM gave consistently lower values (0.893 +/- 0.015) compared with the compliance of DTM (means +/- SE; r = 0.989). The lower compliance estimates by the PPM can be attributed to the difference in mean pressures at which compliance is determined (mean pressure, 81.0 +/- 3.6 mmHg; mean diastolic pressure, over which the DTM applies, 67.0 +/- 3.6 mmHg). Total arterial compliance under control conditions was 0.169 +/- 0. 007 ml/mmHg. Compliance of the proximal aorta, obtained during occlusion of the proximal descending aorta, was 0.100 +/- 0.007 ml/mmHg. Mean aortic pressure was 80.4 +/- 3.6 mmHg during control and 102 +/- 7.7 mmHg during proximal descending aortic occlusion. From these results and assuming that upper limbs and the head contribute as little as the lower limbs, we conclude that 60% of total arterial compliance resides in the proximal aorta. When we take into account the inverse relationship between pressure and compliance, the contribution of the proximal aorta to the total arterial compliance is even more significant.

190 citations

Journal ArticleDOI
TL;DR: Abruptly intensified physical training results in an altered autonomic cardiovascular activity towards parasympathetic inhibition and sympathetic activation that can be monitored by means of HRV and BRS analyses and might provide useful markers to avoid the overtraining syndrome.
Abstract: Objective: To assess the effects of abruptly intensified physical training on cardiovascular control. Design: Retrospective longitudinal study. Setting: Research laboratory. Participants: Ten healthy athletes (5 men and 5 women) from track and field as well as triathlon. Interventions: A 2-week training camp, including daily stepwise increasing cycling tests, running of 40 minutes, and additional cycling of 60 minutes. Main Outcome Measurements: Time and frequency domain parameters of resting heart rate and blood pressure variability (HRV and BPV) and baroreflex sensitivity (BRS), before, during, and after the training camp. Results: We found significantly reduced HRV during the training camp (mean beat-to-beat interval: 1042 [937 to 1194] ms vs. 933 [832 to 1103] ms vs. 1055 [947 to 1183] ms, P , 0.01; root-meansquare of beat-to-beat interval differences: 68 [52 to 95] ms vs. 52 [38 to 71] ms vs. 61 [48 to 78] ms, P , 0.05). Further, BRS was significantly reduced: 25.2 (20.4 to 40.4) ms/mmHg vs. 17.0 (12.9 to 25.7) ms/mmHg vs. 25.7 (18.8 to 29.1) ms/mmHg, P , 0.05. These effects disappeared at a large degree after 3 to 4 days of recovery. Conclusion: Abruptly intensified physical training results in an altered autonomic cardiovascular activity towards parasympathetic inhibition and sympathetic activation that can be monitored by means of HRVand BRS analyses and might provide useful markers to avoid the overtraining syndrome.

148 citations


"Arterial blood pressure analysis ba..." refers background or methods in this paper

  • ...squared differences between adjacent beat-to-beat intervals in overtraining subjects was described in RR but not in the ABP [ 1 ]....

    [...]

  • ...The analysis of mean values and beat-to-beat variability of cardiovascular (CV) time series has been widely used as a non invasive approach to study the control of the autonomic nervous system (ANS) on the CV function [ 1 ], [8]....

    [...]

  • ...The aim of this kind of studies is to assess the quality of training, to avoid overtraining and to improve CV adjustment to exercise [ 1 ], [12]....

    [...]

Journal ArticleDOI
TL;DR: It is concluded that heavy training could increase cardiac sympathetic modulation during supine rest and attenuated biphasic baroreflex-mediated response appearing just after shifting to an upright position as compared to the normal training state.
Abstract: We investigated heavy training- and overtraining-induced changes in heart rate and blood pressure variability during supine rest and in response to head-up tilt in female endurance athletes. Nine young female experimental athletes (ETG) increased their training volume at the intensity of 70-90% of maximal oxygen uptake (VO2max) by 125% and training volume at the intensity of < 70% of VO2max by 100% during 6-9 weeks. The corresponding increases in 6 female control athletes were 5% and 10%. The VO2max of the ETG and the control athletes did not change, but it decreased from 53.0 +/- 2.2 ml x kg(-1) x min(-1) to 50.2 +/- 2.3 ml x kg(-1) x min(-1) (mean+/-SEM, p < 0.01) in five overtrained experimental athletes. In the ETG, low-frequency power of R-R interval (RRI) variability during supine rest increased from 6 +/- 1 ms2 x 10(2) to 9 +/- 2 ms2 x 10(2) (p < 0.05). The 30/15 index (= RRI(max 30)/RRI(min 15), where RRI(max 30) denotes the longest RRI close to the 30th RRI and RRI(min 15) denotes the shortest RRI close to the 15th RRI after assuming upright position in the head-up tilt test), decreased as a result of training (analysis of variance, p = 0.05). In the ETG, changes in VO2max were related to the changes in total power of RRI variability during standing (r = 0.74, p < 0.05). Heart rate response to prolonged standing after head-up tilt was either accentuated or attenuated in the overtrained athletes as compared to the normal training state. We conclude that heavy training could increase cardiac sympathetic modulation during supine rest and attenuated biphasic baroreflex-mediated response appearing just after shifting to an upright position. Heavy-training-/overtraining-induced decrease in maximal aerobic power was related to decreased heart rate variability during standing. Physiological responses to overtraining were individual.

142 citations


"Arterial blood pressure analysis ba..." refers methods in this paper

  • ...For a convenient use, we solve the SBSA by replacing the space variable x by the time variable t....

    [...]

Book
01 Jan 1981

71 citations


"Arterial blood pressure analysis ba..." refers background or methods in this paper

  • ...The spectrum of this operator has two components : a continuous spectrum including positive eigenvalues and a discrete spectrum with negative eigenvalues [1], [4], [5], [6], [12]....

    [...]

  • ...The IST is based on the Gel’fand-Levitan-Marchenko (GLM) integral equation [1], [5]....

    [...]

  • ...The decomposition of the ABP into a nonlinear superposition of solitons introduced in this article is based on an elegant mathematical transform : the scattering transform for a one-dimensional Schrödinger equation [1], [5], [6]....

    [...]

Frequently Asked Questions (7)
Q1. What have the authors contributed in "Arterial blood pressure analysis based on scattering transform i" ?

This article presents a new method for analyzing arterial blood pressure waves. The technique is based on the scattering transform and consists in solving the spectral problem associated to a one-dimensional Schrödinger operator with a potential depending linearly upon the pressure. This potential is then expressed with the discrete spectrum which includes negative eigenvalues and corresponds to the interacting components of an N-soliton. 

The spectrum of this operator has two components : a continuous spectrum including positive eigenvalues and a discrete spectrum with negative eigenvalues [1], [4], [5], [6], [12]. 

The main idea is then to find the parameter χ such that the signal y is well approximated by the reflectionless part of the potential which can be written then using equation (7) :ŷ = 4χ−1 N∑ n=1 κnψ2n + ymin, (9)where −κ2n and ψn, n = 1, · · · ,N are respectively the N negative eigenvalues and the corresponding L2-normalized eigenfunctions for the potential V , determined by the DST. 

Denoting the positive eigenvalues by λ = k2, the continuous spectrum is characterized by the following asymptotic boundary conditions where T (k) and R(k) are respectively the transmission and the reflection coefficients associated to V :ψ(x,k)→ T (k)exp(−ikx), x→−∞, (2) ψ(x,k)→ exp(−ikx)+R(k)exp(ikx), x→+∞. (3)Conservation of energy leads to |T (k)|2 + |R(k)|2 = 1. 

Determining the parameter χ determines the number N(χ) of negative eigenvalues and hence the number of solitons components required for a satisfying approximation of the signal y. Fig. 1 summarizes the SBSA method. 

In this study the authors suppose that the function V belongs to the Schwartz space S (R) of regular and rapidly decreasing functions on R.The DST of the potential V is the solution of the spectral problem for L(V ). 

This approach is based on the scattering transform and deals with the solution of the spectral problem of a perturbed Schrödinger operator for a given potential.