
All figures (12)
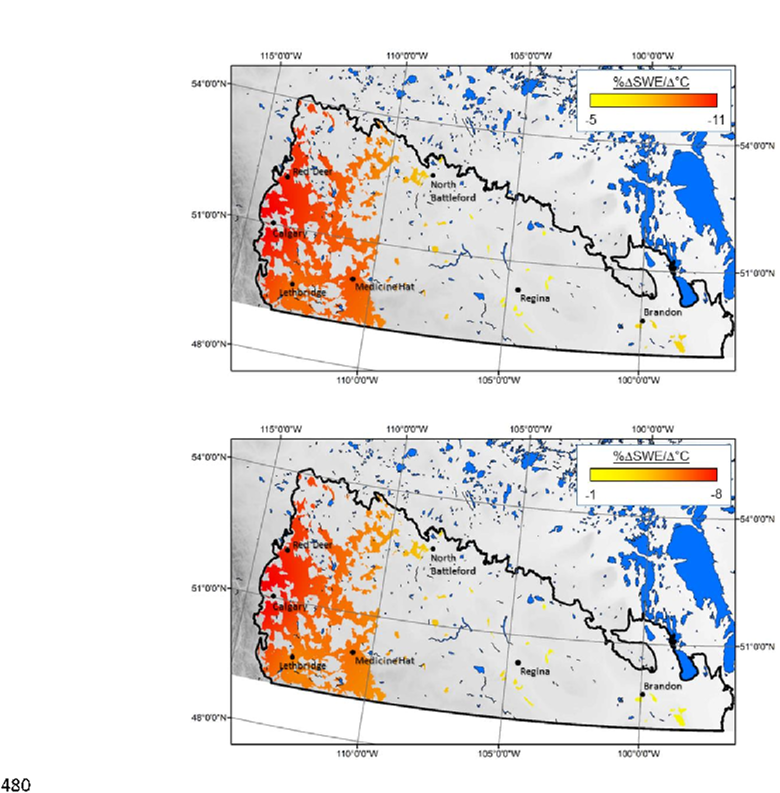
Figure 9: Sensitivity of annual maximum snow water equivalent (SWE) in the grassland HRU to warming, assuming no change in precipitation (top), and a 30% increase in mean annual precipitation (bottom). 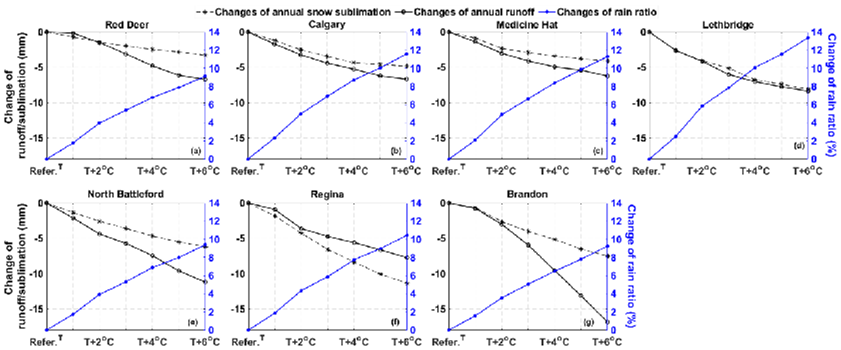
Figure 10: Change in runoff (mm), annual blowing snow sublimation (mm) and change in the 500 ratio of rain in annual precipitation (%) for each climate (annual blowing snow sublimation and ratio of rain as in Figure 8). 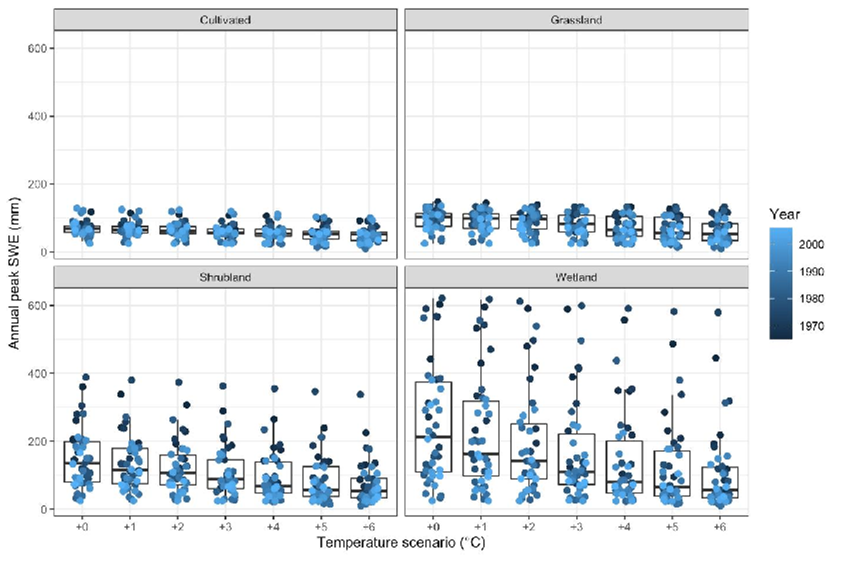
Figure 6: Peak virtual model simulated annual snow accumulation (SWE) for cultivated, grassland, shrubland, and wetland HRUs for Medicine Hat climate under baseline conditions 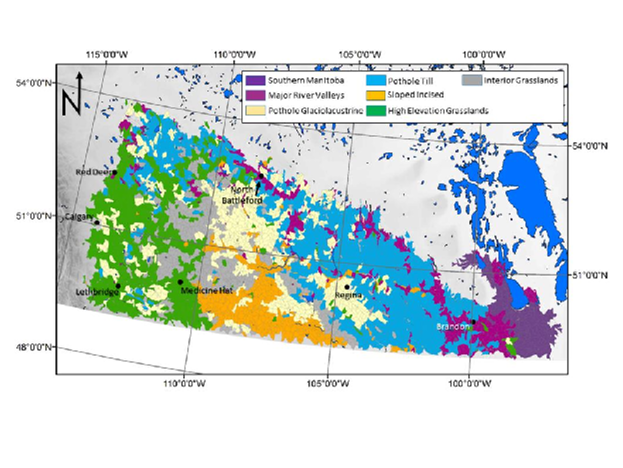
Figure 2: Basin classification map for the Prairie ecozone in western Canada. Colours represent the seven basin classes and excluded areas (lakes and urban areas) are shown in white. The 
Table 4: Simulated annual peak SWE and runoff under different climate scenarios (temperature 
Figure 3: Illustration of HRU distribution in the virtual model of a typical High Elevation Grasslands basin. The illustration depicts two catenas, one with a wetland complex and one 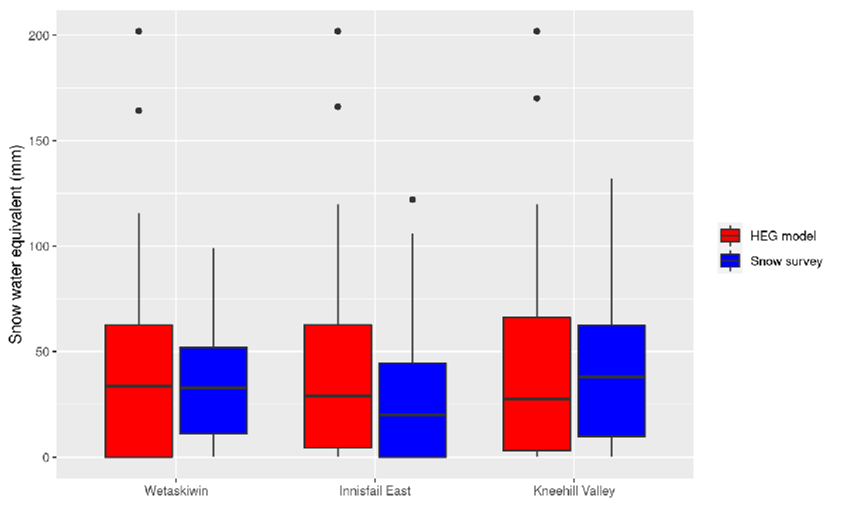
Figure 4: Comparison of 1987–2006 simulated SWE using the Red Deer climate forcings and SWE observed at the three Alberta Environment and Parks (AEP) snow courses near Red Deer. 
Figure 7: Change in peak annual snow water equivalent date at the wetland HRU under warming and changes in precipitation for simulations using the perturbed 30 year climate data. Negative signs in peak SWE date plot represent advance in time and positive signs denote delay in date of peak SWE accumulation. 
Figure 5: Simulated (CRHM) monthly simulated discharge depths (red) using forcing from four of the climate locations compared with those from WSC gauged streams (blue). The horizontal 
Figure 11: Sensitivity of annual runoff from HEG basins to warming assuming no change in 505 precipitation (top), and a 30% increase in mean annual precipitation (bottom). Note that the black bar on the legend for the bottom panel denotes the colour at which there is no change. 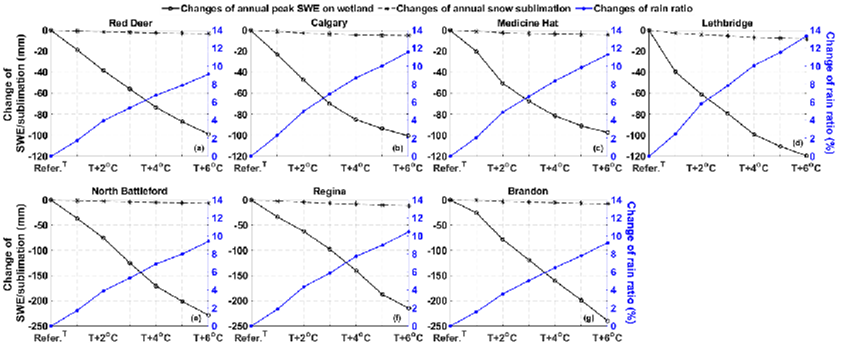
Figure 8: Changes in mean annual peak snow water equivalent (mm) in a wetland HRU, annual 465 blowing snow sublimation (mm) and the change in the mean ratio of rain in annual precipitation (%). Change of rain ratio was calculated by rain ratio of scenario (%) minus the rain ratio of 
Figure 1: Components of the classification-based virtual basin modeling platform.


