scispace - formally typeset
Search or ask a question
Journal ArticleDOI

Bias correction of daily precipitation simulated by a regional climate model: a comparison of methods

01 May 2013-International Journal of Climatology (John Wiley & Sons, Ltd)-Vol. 33, Iss: 6, pp 1367-1381
TL;DR: The authors compared the performance of four published techniques used to reduce the bias in a regional climate model precipitation output: (1) linear, (2) nonlinear, (3) γ-based quantile mapping and (4) empirical quantile mappings.
Abstract: Quantifying the effects of future changes in the frequency of precipitation extremes is a key challenge in assessing the vulnerability of hydrological systems to climate change but is difficult as climate models do not always accurately simulate daily precipitation. This article compares the performance of four published techniques used to reduce the bias in a regional climate model precipitation output: (1) linear, (2) nonlinear, (3) γ -based quantile mapping and (4) empirical quantile mapping. Overall performance and sensitivity to the choice of calibration period were tested by calculating the errors in the first four statistical moments of generated daily precipitation time series and using a cross-validation technique. The study compared the 1961–2005 precipitation time series from the regional climate model HadRM3.0-PPE-UK (unperturbed version) with gridded daily precipitation time series derived from rain gauges for seven catchments spread throughout Great Britain. We found that while the first and second moments of the precipitation frequency distribution can be corrected robustly, correction of the third and fourth moments of the distribution is much more sensitive to the choice of bias correction procedure and to the selection of a particular calibration period. Overall, our results demonstrate that, if both precipitation data sets can be approximated by a γ -distribution, the γ -based quantilemapping technique offers the best combination of accuracy and robustness. In circumstances where precipitation data sets cannot adequately be approximated using a γ -distribution, the nonlinear method is more effective at reducing the bias, but the linear method is least sensitive to the choice of calibration period. The empirical quantile mapping method can be highly accurate, but results were very sensitive to the choice of calibration time period. However, it should be borne in mind that bias correction introduces additional uncertainties, which are greater for higher order moments.

Summary (6 min read)

1. Introduction

  • The impact of climate change on the hydrological cycle is of great interest to environmental and water resource managers (Arnell, 2001 , Bates et al., 2008) .
  • This approach does not change any of the temporal structure of the time series.
  • The bias in GCM and RCM daily precipitation simulations may not be limited to monthly means, but may also affect precipitation variability and other derived measures that are of hydrological importance (Arnell et al., 2003 , Diaz-Nieto and Wilby, 2005 , Fowler et al., 2007) .
  • This paper discusses the accuracy of the four techniques in detail when applied to the Exe-Culm river basin in south-west England.
  • The first part describes the bias-correction methods that form the subject of this study.

2.1. Linear correction method

  • When using the linear correction method, RCM daily precipitation amounts, P, are transformed into such that , using a scaling factor, ̅ ̅ ⁄ , wherein ̅ and ̅ are the monthly mean observed and RCM precipitation for that 1 km grid point, respectively.
  • Here, the monthly scaling factor is applied to each uncorrected daily observation of that month, generating the corrected daily time series.
  • The linear correction method belongs to the same family as the 'factor of change' or 'delta change' method (Hay et al., 2000) .
  • This method has the advantage of simplicity and modest data requirements: only monthly climatological information is required in order to calculate monthly correction factors.
  • Correcting only the monthly mean precipitation can distort the relative variability of the inter-monthly precipitation distribution, and may adversely affect other moments of the probability distribution of daily precipitations (Arnell et al., 2003, Diaz-Nieto and Wilby, 2005) .

2.2. Non-linear correction method

  • Noting that a linear scaling factor adjusts the mean but not the standard deviation of monthly precipitation, Shabalova et al. (2003) and Leander and Buishand (2007) advocate the use of a power-law correction such that P* = aP b , where is a scaling exponent.
  • The constants and are calculated in two stages: (i) the scaling exponent, , is calculated iteratively so that, for each grid box in each month, the coefficient of variation of the RCM daily precipitation time series matches that of the observed precipitation time series.
  • Finally, monthly constants and are applied to each uncorrected daily observations corresponding to that month in order to generate the corrected daily time series.
  • This approach results in the mean and the standard deviation of the daily precipitation distribution becoming equal to those of the observed distribution.
  • Biases in higher order moments are not removed by the non-linear method; however these will be affected to a certain degree by the correction procedure.

2.3. Gamma distribution correction method

  • The gamma distribution-based correction method assumes that the probability distributions of both observed and RCM daily precipitation datasets can be approximated using a gamma distribution, for example: EQUATION ] where >.
  • 0 and are the form and scaling parameters of a gamma distribution, respectively, and where P represents RCM daily precipitation.
  • Here, parameters and were estimated for each grid box for each month, using the method of moments: [7] where ̅ and are the sample mean and standard deviation of , respectively.
  • This quantile was then used to generate a bias-corrected precipitation time series by replacing the RCM precipitation amount P by its value resampled from the gamma distribution fitted to the observations and associated with the same quantile.
  • This method is designed to remove biases in the first two statistical moments and similar methods were found to perform well when used on GCM outputs at global and European scales (Vidal and Wade, 2008a, b, Piani et al., 2010) .

2.4. Empirical distribution correction method

  • The correction method based on empirical distributions follows the same approach as the gamma distribution method, with the RCM distribution transformed to match the observed distribution through a transfer function.
  • Unlike the gamma distribution method, the empirical method does not make any a priori assumptions about the precipitation distribution .
  • To implement the empirical distribution correction method, the ranked observed precipitation distribution is divided into a number of discrete quantiles.
  • The number of quantile divisions controls the accuracy of the method: using fewer quantiles might smooth out the information contained within the observed record, while using too many quantiles might result in over-fitting of the model to the data.
  • A method of the same family has been shown to perform well in the correction of RCM precipitation forecasts for use as variables of interest for hydrologic simulations and climate change studies (Wood et al., 2002 , Wood et al., 2004 , Themeßl et al., 2010) .

3. Evaluation methodology

  • RCM and corrected datasets, the quantification of robustness is more complex.
  • Here, a cross-validation technique similar to the jack-knife (Bissell and Ferguson, 1975) is used, where measures of performance are evaluated using a sample which was not included in the calibration of the correction procedure.
  • The authors also calculated the frequency of error reduction, defined as the proportion of bias-corrected time series where ARD was smaller than that calculated from the 1 km RCM-driven data before bias correction.
  • A similar procedure has been used to evaluate the robustness of a gamma-based quantile mapping technique in Northern Eurasia (Li et al., 2010) .

4.1. Study regions

  • It is important that daily precipitation bias-correction methods are capable of correcting over the full extent of the spatial area of interest.
  • Great Britain has a wide range of annual average precipitation and topography; hence, a method which successfully corrects biases in one region may not necessarily be as effective in another.
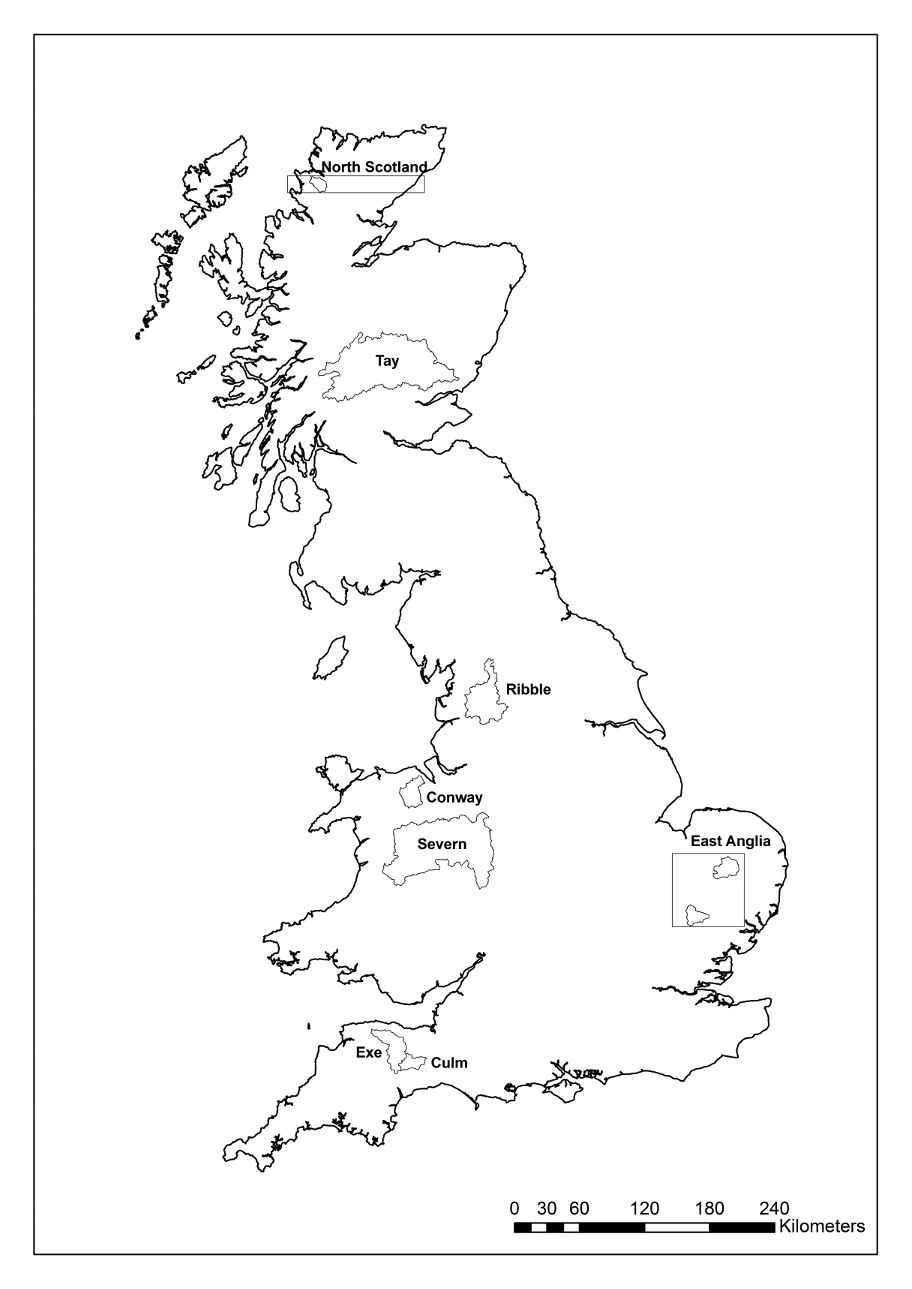
  • To explore this question more comprehensively, the four biascorrection methods were each applied to seven test regions.
  • The seven regions were chosen by comparing river catchments from the National River Flow Archive (NRFA) Hydrometric Register (Marsh and Hannaford, 2008) .
  • Box-bound regions or multiple catchments are used where single catchment areas are too small to be worth comparing or not large enough to investigate spatial pattern of the results (i.e. East Anglia, North Scotland and Exe-Culm).

4.2. Observed data

  • The authors observed precipitation dataset is the 1 km daily precipitation data associated with the Continuous Estimation of River Flows (CERF) model (Keller et al., 2006) .
  • It was generated from rain-gauge observations from the UK Met Office using the triangular planes method followed by a normalisation based on average annual precipitation (Jones, 1983) .
  • The dataset extends over England, Scotland and Wales and covers the period 1961-2008, however only data for the period 1961-2000 were used in this study.
  • In total, data from 17,812 rain-gauges were used to derive the CERF dataset.

4.3. RCM data

  • Daily precipitation outputs from the Met Office Hadley Centre Regional Model Perturbed Physics Previous studies have shown that climate models often simulate precipitation time series in which the frequency of wet days with low precipitation is higher than observed (the so-called drizzle effect, e.g., Sun et al., 2006) .
  • This means that the sequencing of wet and dry days, which is vital for the generation of hydrological extremes (both floods and droughts), is not well reproduced.
  • To reduce this issue, the RCM daily precipitation outputs were modified so that the monthly frequency of rain days matched that of the observed record.
  • The wet-day correction is regarded as essential for most hydrological applications (Weedon et al., 2011) and so it is used in association with all of the bias correction methods described here.

5. Results for the Exe-Culm catchment

  • In total, seven bias-correction methods were compared, each belonging to one of the four families of methods described earlier.
  • For the empirical distribution correction approach, four different methods were considered where the transfer functions were defined using 25, 50, 75 and 100 quantiles.
  • All methods were constructed monthly for each grid cell of the catchments.
  • Results are presented at the catchment level (i.e. average performance within a catchment) and from 1 km maps of ARD in the four first statistical moments.
  • Second, the robustness of each model is tested using a cross-validation methodology on the period 1961-2000, to evaluate how well the models perform outside their calibration period.

5.1 Overall performance

  • For each grid cell, ARD associated with the four first moments are calculated and corresponding catchment average ARD derived.
  • While, by design, the bias-corrected mean (first moment) is equal to the observed when using the linear and nonlinear methods (ARD30 equal to 0), this is not the case for the distribution-based methods.
  • The ARD30 on standard deviation is slightly reduced using the linear method, but the error remains large, suggesting that the linear method cannot entirely correct bias in precipitation variability.
  • Amongst the distributionbased methods, the gamma distribution is associated with the lowest ARD30 on standard deviation while ARD30 reduction for the empirical distribution method increases with the number of quantiles used.
  • The empirical distribution method seems to consistently induce an error peak in July.

5.2 Robustness

  • Using the cross-validation methodology presented above, the seven bias-correction methods (linear, non-linear, gamma, empirical with 25, 50, 75 and 100 quantiles) were calibrated by constructing daily artificial time series generated from the observed data by removing ten consecutive years of data in turn.
  • The robustness of each of the seven bias-correction techniques was evaluated by calculating ARD between the bias-corrected precipitation time series and the 10-year observations removed from the calibration sample.
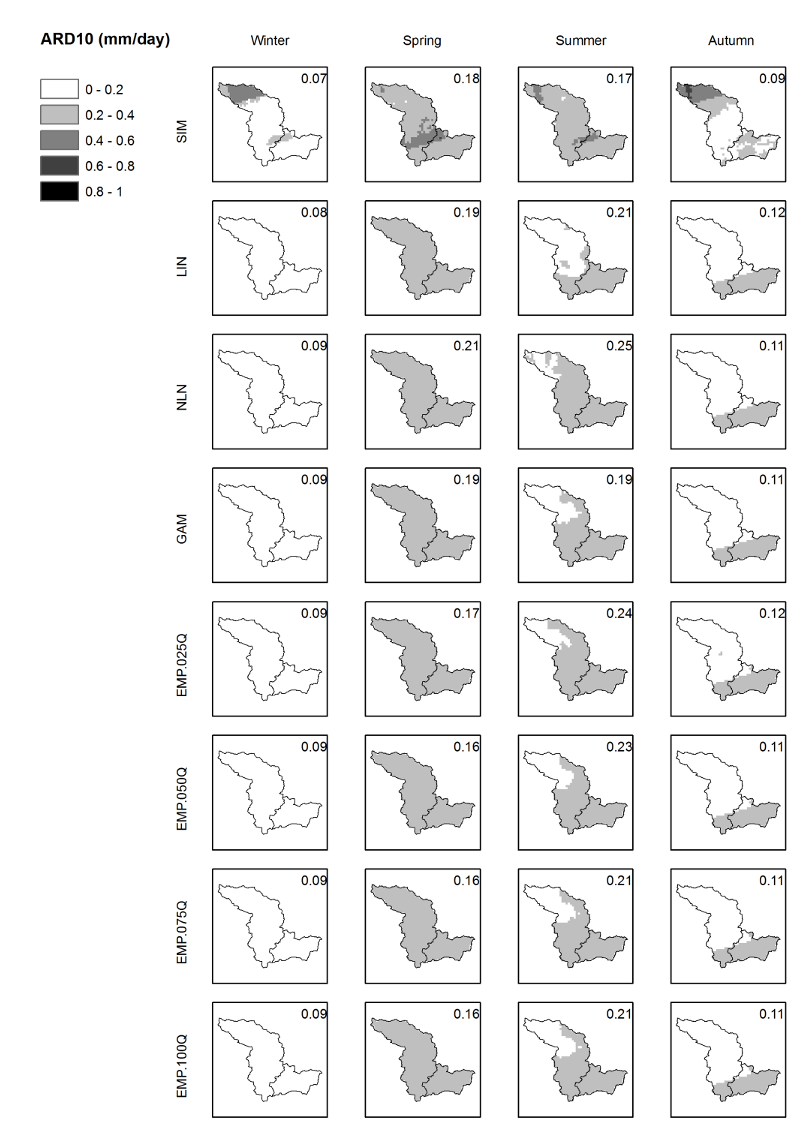
  • The resulting ARD, being calculated over a 10-year period, will be referred to as "ARD10".

5.2.1. Sample spread

  • The spread of the ARD10 partly reflects the uncertainty associated with each bias-correction method.
  • In contrast, large errors suggest that the bias-correction procedure is sensitive to the choice of calibration period.
  • Figures 5 and 6 show the seasonal and spatial patterns of mean ARD10 in the standard deviation and coefficient of variation.
  • The impact of the calibration period on the results is highest for ARD10 in the third and fourth moments where all methods show an increased catchment mean ARD10 (top-right corner of the maps).

5.2.2 Frequency of error reduction

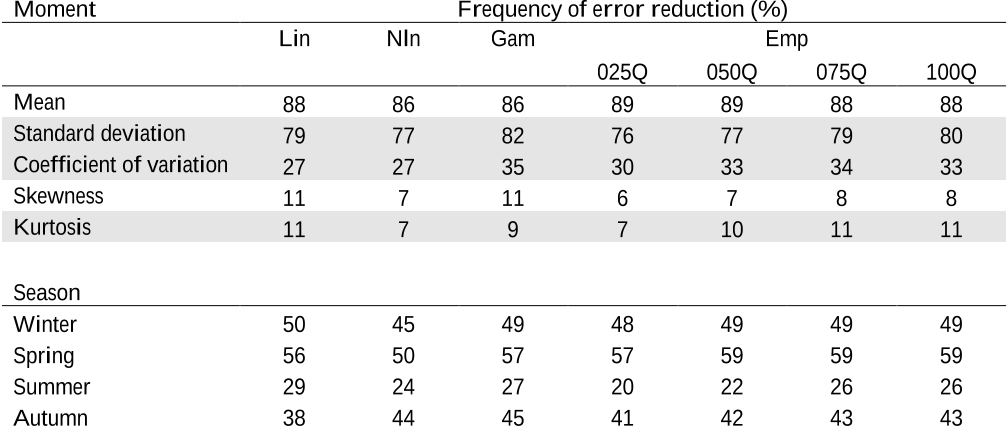
  • Table 2 provides a quantitative assessment of the frequency with which the application of each of the bias-correction procedures actually resulted in improved precipitation statistics when evaluated against data from a time-period which was different from that over which the bias-correction procedures had been calibrated.
  • For the standard deviation, the gamma distribution method achieves a reduction in ARD10 82% of the time while it is true only 76% and 77% of the time for the non-linear method and empirical distribution method with 25 and 50 quantiles.
  • Performance also varies with seasons, with an ARD10 reduced more often in spring and less often in summer.
  • The overall frequency of error reduction suggests that the choice of correction technique must be made very carefully with an awareness of the additional uncertainties that may be introduced through the use of bias-correction techniques.

6.1 Sample spread

  • The ARD, being calculated over a 10-years period, will here be referred to as "ARD10".
  • The linear method consistently improves the average but rarely improves the higher order moments.
  • This is most apparent in the East Anglian catchment where summer precipitation is dominated by convective storms.
  • The empirical approach shows the best results for the higher order moments, however its performance can be erratic and can result in high ARD10 (mean ARD10 > 1) even in the lower order moments in all catchments.
  • These high values of the transfer function occur when, for some quantiles, the simulated precipitation is significantly lower than the observed precipitation.

6.2 Frequency of error reduction

  • Table 4 provides a quantitative assessment of the frequency with which the application of each of the bias-correction procedures actually resulted in improved precipitation statistics when evaluated against data from a time-period which was different from that over which the bias-correction procedures had been calibrated.
  • For the standard deviation, the gamma distribution method achieves a reduction in ARD10 79% of the time while it is true only 58% of the time for the empirical distribution method with 25 quantiles.
  • For the CV, this frequency is 64% for the gamma distribution method and drops to 36% for the linear method.
  • Performance also varies with season, with ARD10 reduced more often in winter and less often in spring.
  • The overall frequency of error reduction is slightly higher than that over the Exe-Culm basin, although this does not change the suggestion that the choice of correction technique must be made very carefully with an awareness of the additional uncertainties that may be introduced through the use of bias-correction techniques.

7 Discussion and conclusion

  • The authors have compared four bias-correction techniques to determine which is the most effective and robust method to use when correcting daily precipitation simulated by a RCM for subsequent use in a hydrological model.
  • The linear method showed the weakest correction as it is designed to alter only the mean, while the non-linear method corrects up to the second statistical moment of the frequency distribution.
  • At the same time, the potential to over-calibrate the bias-correction procedure to a particular set of reference data increases as more and more observed data are used to calculate the correction parameters.
  • The empirical quantile mapping method with 100 quantile divisions was highly accurate but its sensitivity to the choice of time period was higher than that of methods which used fewer parameters and which were, therefore, less vulnerable to over-tuning.
  • In circumstances where precipitation datasets cannot adequately be approximated using a gamma distribution, the linear and non-linear correction methods were most effective at reducing bias across all moments tested here (Table 3 ).

Did you find this useful? Give us your feedback

Figures (12)

Content maybe subject to copyright    Report

Copyright © 2012 Royal Meteorological Society
This version available http://nora.nerc.ac.uk/19367/
NERC has developed NORA to enable users to access research outputs
wholly or partially funded by NERC. Copyright and other rights for material
on this site are retained by the rights owners. Users should read the terms
and conditions of use of this material at
http://nora.nerc.ac.uk/policies.html#access
This document is the author’s final manuscript version of the journal
article, incorporating any revisions agreed during the peer review
process. Some differences between this and the publisher’s version
remain. You are advised to consult the publisher’s version if you wish
to cite from this article.
The definitive version is available at http://onlinelibrary.wiley.com
Article (refereed) - postprint
Lafon, Thomas; Dadson, Simon; Buys, Gwen; Prudhomme, Christel. 2013.
Bias correction of daily precipitation simulated by a regional climate
model: a comparison of methods. International Journal of Climatology, 33
(6). 1367-1381. 10.1002/joc.3518
Contact CEH NORA team at
noraceh@ceh.ac.uk
The NERC and CEH trademarks and logos (‘the Trademarks’) are registered trademarks of NERC in the UK and
other countries, and may not be used without the prior written consent of the Trademark owner.

1
Bias correction of daily precipitation simulated by a Regional Climate Model: A
comparison of methods
Thomas Lafon
1,2,3
, Simon Dadson
1
, Gwen Buys
1,4
, and Christel Prudhomme
1
[1] Centre for Ecology and Hydrology, Maclean Building, Crowmarsh Gifford,
Wallingford, OX10 8BB. UK
[2] Now at Oxford Brookes University, Headington Campus, Gipsy Lane,
Oxford OX3 0BP, UK
[3] Fundación Entropika, Apartado Aéreo N˚ 20,
Leticia, Amazonas, Colombia
[4] Now at British Antarctic Survey, High Cross, Madingley Road,
Cambridge, CB3 0ET, UK
Corresponding author: tlafon@entropika.org
Thomas Lafon

2
Abstract
Quantifying the effects of future changes in the frequency of precipitation extremes is a key
challenge in assessing the vulnerability of hydrological systems to climate change, but is difficult as
climate models do not always accurately simulate daily precipitation. This paper compares the
performance of four published techniques used to reduce the bias in a Regional Climate Model
(RCM) precipitation output: (i) linear, (ii) non-linear, (iii) gamma-based quantile mapping and (iv)
empirical quantile mapping. Overall performance and sensitivity to the choice of calibration period
were tested by calculating the errors in the first four statistical moments of generated daily
precipitation time series and using a cross validation technique. The study compared the 1961-2005
precipitation time series from the Regional Climate Model HadRM3.0-PPE-UK (unperturbed
version) with gridded daily precipitation time series derived from rain gauges for seven catchments
spread throughout Great Britain. We found that whilst the first and second moments of the
precipitation frequency distribution can be corrected robustly, correction of the third and fourth
moments of the distribution is much more sensitive to the choice of bias-correction procedure and
to the selection of a particular calibration period. Overall, our results demonstrate that, if both
precipitation datasets can be approximated by a gamma distribution, the gamma-based quantile-
mapping technique offers the best combination of accuracy and robustness. In circumstances where
precipitation datasets cannot adequately be approximated using a gamma distribution, the non-linear
method is more effective at reducing the bias but the linear method is least sensitive to the choice of
calibration period. The empirical quantile mapping method can be highly accurate, but results were
very sensitive to the choice of calibration time period. However, it should be borne in mind that bias
correction introduces additional uncertainties, which are greater for higher-order moments.

3
Key words: Regional climate model, bias correction, daily precipitation, downscaling, cross-
validation, UK.
Sponsors: Natural Environment Research Council (UK); Environment Agency (UK); DEFRA
(UK), UK Water Industry Research (UKWIR).

4
1. Introduction
The impact of climate change on the hydrological cycle is of great interest to environmental and
water resource managers (Arnell, 2001, Bates et al., 2008). Quantifying the effects of future
changes in the frequency of daily precipitation extremes is a key challenge in assessing the
vulnerability of hydrological systems to climate change. Nevertheless, whilst the accuracy of Global
Climate Models (GCMs) in simulating the large-scale atmospheric circulation has improved
markedly in recent years, global models have difficulty resolving the processes that govern local
precipitation. The most common problem associated with GCM simulations of precipitation is that,
at a daily time-scale, precipitation occurs more frequently than observed, but often with a lower
intensity (e.g., Sun et al., 2006).
In order to make simulations at hydrologically-relevant spatial and temporal scales, downscaling is
necessary. Downscaling techniques that have been reviewed in the literature include statistical
downscaling, which uses empirical relations between climate model outputs and historical observed
data, and dynamical downscaling, which involves the use of a Regional Climate Model (RCM) (see
Fowler et al., 2007 for a detailed review). RCMs offer a more physically-realistic approach to GCM
downscaling than statistical downscaling because they provide an explicit representation of the
mesoscale atmospheric processes that produce heavy precipitation. When nested within a GCM,
RCMs provide regional detail that is not only consistent with the parent GCM, but which is
spatially-coherent. That is, a degree of spatial persistence of large-scale atmospheric features is
automatically ensured, because the model generates these features dynamically. This property of
RCM simulations is important in producing realistic forcing data for hydrological models because
many floods and droughts are caused by spatially- and temporally-persistent precipitation patterns.
Two major studies of the accuracy of RCM precipitation estimates used daily extreme precipitation
statistics to compare the performance of several different 50 km RCMs nested within both ECMWF
ERA-15 reanalysis data (Frei et al., 2003), and within the Hadley Centre HadAM3 GCM (Frei et
al., 2006). They found that the RCMs were capable of reproducing important mesoscale patterns of

Citations
More filters
Journal ArticleDOI
TL;DR: In this article, the authors presented the CHELSA (Climatologies at high resolution for the earth's land surface areas) data of downscaled model output temperature and precipitation estimates of the ERA-Interim climatic reanalysis to a high resolution of 30'arc'sec.
Abstract: High-resolution information on climatic conditions is essential to many applications in environmental and ecological sciences. Here we present the CHELSA (Climatologies at high resolution for the earth’s land surface areas) data of downscaled model output temperature and precipitation estimates of the ERA-Interim climatic reanalysis to a high resolution of 30 arc sec. The temperature algorithm is based on statistical downscaling of atmospheric temperatures. The precipitation algorithm incorporates orographic predictors including wind fields, valley exposition, and boundary layer height, with a subsequent bias correction. The resulting data consist of a monthly temperature and precipitation climatology for the years 1979–2013. We compare the data derived from the CHELSA algorithm with other standard gridded products and station data from the Global Historical Climate Network. We compare the performance of the new climatologies in species distribution modelling and show that we can increase the accuracy of species range predictions. We further show that CHELSA climatological data has a similar accuracy as other products for temperature, but that its predictions of precipitation patterns are better. Machine-accessible metadata file describing the reported data (ISA-Tab format)

1,859 citations

Journal ArticleDOI
TL;DR: It is shown that CHELSA climatological data has a similar accuracy as other products for temperature, but that its predictions of precipitation patterns are better and can increase the accuracy of species range predictions.
Abstract: High resolution information on climatic conditions is essential to many applications in environmental and ecological sciences. Here we present the CHELSA Climatologies at high resolution for the earths land surface areas data of downscaled model output temperature and precipitation estimates of the ERA Interim climatic reanalysis to a high resolution of 30 arc seconds. The temperature algorithm is based on statistical downscaling of atmospheric temperatures. The precipitation algorithm incorporates orographic predictors including wind fields, valley exposition, and boundary layer height with a subsequent bias correction. The resulting data consist of a monthly temperature and precipitation climatology for the years 1979 to 2013. We compare the data derived from the CHELSA algorithm with other standard gridded products and station data from the Global Historical Climate Network. We compare the performance of the new climatologies in species distribution modelling and show that we can increase the accuracy of species range predictions. We further show that CHELSA climatological data has a similar accuracy as other products for temperature but that its predictions of precipitation patterns are better.

809 citations

Journal ArticleDOI
TL;DR: In this paper, the authors compared the performance of six bias correction methods for hydrological modeling over 10 North American river basins and found that bias correction performance is location dependent and that a careful validation should always be performed, especially on studies over new regions.
Abstract: [1] This work compares the performance of six bias correction methods for hydrological modeling over 10 North American river basins. Four regional climate model (RCM) simulations driven by reanalysis data taken from the North American Regional Climate Change Assessment Program intercomparison project are used to evaluate the sensitivity of bias correction methods to climate models. The hydrological impacts of bias correction methods are assessed through the comparison of streamflows simulated by a lumped empirical hydrology model (HSAMI) using raw RCM-simulated and bias-corrected precipitation time series. The results show that RCMs are biased in the simulation of precipitation, which results in biased simulated streamflows. All six bias correction methods are capable of improving the RCM-simulated precipitation in the representation of watershed streamflows to a certain degree. However, the performance of hydrological modeling depends on the choice of a bias correction method and the location of a watershed. Moreover, distribution-based methods are consistently better than mean-based methods. A low coherence between the temporal sequences of observed and RCM-simulated (driven by reanalysis data) precipitation was observed over 5 of the 10 watersheds studied. All bias corrections methods fail over these basins due to their inability to specifically correct the temporal structure of daily precipitation occurrence, which is critical for hydrology modeling. In this study, this failure occurred on basins that were distant from the RCM model boundaries and where topography exerted little control over precipitation. These results indicate that bias correction performance is location dependent and that a careful validation should always be performed, especially on studies over new regions.

337 citations


Cites methods from "Bias correction of daily precipitat..."

  • ...Several bias correction methods ranging from simple scaling to sophisticated distribution mapping have been developed in the last decade [Sharma et al., 2007; Piani et al., 2010; Mpelasoka and Chiew, 2009; Ryu et al., 2009; Chen et al., 2011b, 2013; Salvi et al., 2011; Iizumi et al., 2011; Lafon et al., 2012; Teutschbein and Seibert, 2012]....

    [...]

  • ...…simple scaling to sophisticated distribution mapping have been developed in the last decade [Sharma et al., 2007; Piani et al., 2010; Mpelasoka and Chiew, 2009; Ryu et al., 2009; Chen et al., 2011b, 2013; Salvi et al., 2011; Iizumi et al., 2011; Lafon et al., 2012; Teutschbein and Seibert, 2012]....

    [...]

Journal ArticleDOI
TL;DR: In this article, the uncertainty of six empirical downscaling methods in quantifying the hydrological impact of climate change over two North American river basins under different climate conditions was assessed.

249 citations

BookDOI
01 Jan 2020

203 citations


Cites methods from "Bias correction of daily precipitat..."

  • ...…Changes in India 37 38 J. Sanjay et al. percentile threshold of daily maximum air temperature from each CORDEX model outputs after applying a quantile mapping bias-correction following Lafon et al. (2013), which was based on an empirical distribution correction method (Wood et al. 2004)....

    [...]

References
More filters
Book
31 Jan 1986
TL;DR: Numerical Recipes: The Art of Scientific Computing as discussed by the authors is a complete text and reference book on scientific computing with over 100 new routines (now well over 300 in all), plus upgraded versions of many of the original routines, with many new topics presented at the same accessible level.
Abstract: From the Publisher: This is the revised and greatly expanded Second Edition of the hugely popular Numerical Recipes: The Art of Scientific Computing. The product of a unique collaboration among four leading scientists in academic research and industry, Numerical Recipes is a complete text and reference book on scientific computing. In a self-contained manner it proceeds from mathematical and theoretical considerations to actual practical computer routines. With over 100 new routines (now well over 300 in all), plus upgraded versions of many of the original routines, this book is more than ever the most practical, comprehensive handbook of scientific computing available today. The book retains the informal, easy-to-read style that made the first edition so popular, with many new topics presented at the same accessible level. In addition, some sections of more advanced material have been introduced, set off in small type from the main body of the text. Numerical Recipes is an ideal textbook for scientists and engineers and an indispensable reference for anyone who works in scientific computing. Highlights of the new material include a new chapter on integral equations and inverse methods; multigrid methods for solving partial differential equations; improved random number routines; wavelet transforms; the statistical bootstrap method; a new chapter on "less-numerical" algorithms including compression coding and arbitrary precision arithmetic; band diagonal linear systems; linear algebra on sparse matrices; Cholesky and QR decomposition; calculation of numerical derivatives; Pade approximants, and rational Chebyshev approximation; new special functions; Monte Carlo integration in high-dimensional spaces; globally convergent methods for sets of nonlinear equations; an expanded chapter on fast Fourier methods; spectral analysis on unevenly sampled data; Savitzky-Golay smoothing filters; and two-dimensional Kolmogorov-Smirnoff tests. All this is in addition to material on such basic top

12,662 citations

Book
01 Jun 2008
TL;DR: The Intergovernmental Panel on Climate Change (IPCC) Technical Paper Climate Change and Water draws together and evaluates the information in IPCC Assessment and Special Reports concerning the impacts of climate change on hydrological processes and regimes, and on freshwater resources.
Abstract: The Intergovernmental Panel on Climate Change (IPCC) Technical Paper Climate Change and Water draws together and evaluates the information in IPCC Assessment and Special Reports concerning the impacts of climate change on hydrological processes and regimes, and on freshwater resources – their availability, quality, use and management. It takes into account current and projected regional key vulnerabilities, prospects for adaptation, and the relationships between climate change mitigation and water. Its objectives are:

3,108 citations

Journal ArticleDOI
TL;DR: There is a need for a move away from comparison studies into the provision of decision-making tools for planning and management that are robust to future uncertainties; with examination and understanding of uncertainties within the modelling system.
Abstract: There is now a large published literature on the strengths and weaknesses of downscaling methods for different climatic variables, in different regions and seasons. However, little attention is given to the choice of downscaling method when examining the impacts of climate change on hydrological systems. This review paper assesses the current downscaling literature, examining new developments in the downscaling field specifically for hydrological impacts. Sections focus on the downscaling concept; new methods; comparative methodological studies; the modelling of extremes; and the application to hydrological impacts. Consideration is then given to new developments in climate scenario construction which may offer the most potential for advancement within the ‘downscaling for hydrological impacts’ community, such as probabilistic modelling, pattern scaling and downscaling of multiple variables and suggests ways that they can be merged with downscaling techniques in a probabilistic climate change scenario framework to assess the uncertainties associated with future projections. Within hydrological impact studies there is still little consideration given to applied research; how the results can be best used to enable stakeholders and managers to make informed, robust decisions on adaptation and mitigation strategies in the face of many uncertainties about the future. It is suggested that there is a need for a move away from comparison studies into the provision of decision-making tools for planning and management that are robust to future uncertainties; with examination and understanding of uncertainties within the modelling system. Copyright © 2007 Royal Meteorological Society

2,015 citations


"Bias correction of daily precipitat..." refers background in this paper

  • ...The bias in GCM and RCM daily precipitation simulations may not be limited to monthly means, and may also affect precipitation variability and other derived measures that are of hydrological importance (Arnell et al., 2003; Diaz-Nieto and Wilby, 2005; Fowler et al., 2007)....

    [...]

  • ...…that have been reviewed in the literature include statistical downscaling, which uses empirical relations between climate model outputs and historical observed data, and dynamical downscaling, which involves the use of a regional climate model (RCM; see Fowler et al., 2007, for a detailed review)....

    [...]

Journal ArticleDOI
TL;DR: In this article, six approaches for downscaling climate model outputs for use in hydrologic simulation were evaluated, with particular emphasis on each method's ability to produce precipitation and other variables used to drive a macro-scale hydrology model applied at much higher spatial resolution than the climate model.
Abstract: Six approaches for downscaling climate model outputs for use in hydrologic simulation were evaluated, with particular emphasis on each method's ability to produce precipitation and other variables used to drive a macroscale hydrology model applied at much higher spatial resolution than the climate model. Comparisons were made on the basis of a twenty-year retrospective (1975–1995) climate simulation produced by the NCAR-DOE Parallel ClimateModel (PCM), and the implications of the comparison for a future(2040–2060) PCM climate scenario were also explored. The six approaches were made up of three relatively simple statistical downscaling methods – linear interpolation (LI), spatial disaggregation (SD), and bias-correction and spatial disaggregation (BCSD) – each applied to both PCM output directly(at T42 spatial resolution), and after dynamical downscaling via a Regional Climate Model (RCM – at 1/2-degree spatial resolution), for downscaling the climate model outputs to the 1/8-degree spatial resolution of the hydrological model. For the retrospective climate simulation, results were compared to an observed gridded climatology of temperature and precipitation, and gridded hydrologic variables resulting from forcing the hydrologic model with observations. The most significant findings are that the BCSD method was successful in reproducing the main features of the observed hydrometeorology from the retrospective climate simulation, when applied to both PCM and RCM outputs. Linear interpolation produced better results using RCM output than PCM output, but both methods (PCM-LI and RCM-LI) lead to unacceptably biased hydrologic simulations. Spatial disaggregation of the PCM output produced results similar to those achieved with the RCM interpolated output; nonetheless, neither PCM nor RCM output was useful for hydrologic simulation purposes without a bias-correction step. For the future climate scenario, only the BCSD-method (using PCM or RCM) was able to produce hydrologically plausible results. With the BCSD method, the RCM-derived hydrology was more sensitive to climate change than the PCM-derived hydrology.

1,706 citations


"Bias correction of daily precipitat..." refers background or methods in this paper

  • ...…and spatially varying change factor and exponent; Leander and Buishand, 2007), (3) distributionbased quantile mapping (e.g. γ -distribution, Hay et al., 2002; Piani et al., 2010) and (4) distribution-free quantile mapping (e.g. empirical distribution, Wood et al., 2002, 2004; Ashfaq et al., 2010)....

    [...]

  • ...A method of the same family has been shown to perform well in the correction of RCM precipitation forecasts for use as variables of interest for hydrologic simulations and climate change studies (Wood et al., 2002, 2004; Themeßl et al., 2010)....

    [...]

Frequently Asked Questions (17)
Q1. What contributions have the authors mentioned in the paper "Bias correction of daily precipitation simulated by a regional climate model: a comparison of methods" ?

Fernando et al. this paper used a Regional Climate Model ( RCM ) to calculate the difference between future and baseline climate from the GCM/RCM outputs and apply this factor of change to historical observed time series to generate synthetic time series assumed to be possible realisations of the future. 

Quantifying the effects of future changes in the frequency of daily precipitation extremes is a key challenge in assessing the vulnerability of hydrological systems to climate change. 

Downscaling techniques that have been reviewed in the literature include statistical downscaling, which uses empirical relations between climate model outputs and historical observed data, and dynamical downscaling, which involves the use of a Regional Climate Model (RCM) (see Fowler et al., 2007 for a detailed review). 

When correcting for biases in climate model output, it is also important that changes in the frequency distribution of climatic variables are correctly represented. 

The most comprehensive correction was achieved by using the empirical quantile-mapping methods, which incorporate information from the frequency distributions of modelled and observed precipitation. 

RCMs offer a more physically-realistic approach to GCM downscaling than statistical downscaling because they provide an explicit representation of the mesoscale atmospheric processes that produce heavy precipitation. 

This property of RCM simulations is important in producing realistic forcing data for hydrological models because many floods and droughts are caused by spatially- and temporally-persistent precipitation patterns. 

This suggests that, while the greatest accuracy is achieved by an empirical distribution method defined by at least 25 quantiles (i.e., the overall error from the same calibration-evaluation period is smallest), results are also most sensitive to the chosen calibration period. 

At the same time, the potential to over-calibrate the bias-correction procedure to aparticular set of reference data increases as more and more observed data are used to calculate the correction parameters. 

Techniques to correct the biases in the climate model outputs are therefore used to improve the realism of GCM/RCM precipitation time series, based on statistical properties obtained from observed data taken from the same baseline period. 

For the skewness and kurtosis, the highest frequency of error reduction is achieved by the linear method (61% and 62%, respectively), while the lowest frequency is obtained using the empirical distribution method with 50 quantiles (24% and 18%, respectively). 

the effectiveness of bias-correction was found to be sensitive to the time-period for which the bias-correction procedures have been calibrated. 

For the higher moments, the frequency of error reduction further decreases to 11% (gamma distribution and linear methods) and 6% (empirical distribution method with 25 quantiles) for skewness, and to 11% (linear method and empirical distribution method with 75 and 100 quantiles) methods to 7% (non-linear method) for kurtosis. 

the correction method based on a gamma distribution offers the best combination of accuracy and robustness, but it is valid only when the observed and modelled precipitation data are gamma distributed. 

Another approach is to generate synthetic precipitation time series using a stochastic weather generator, where the parameters in the generator are changed according to estimated changes in the climate from the GCM/RCM outputs (e.g. Kilsby et al., 2007, Fatichi et al., 2011). 

To evaluate the robustness of the correction procedure, the authors calculated the average of the absolute value of the relative differences (ARD, defined as | | ⁄ , where X and X’ are statistics from observed and bias-corrected precipitation, respectively) between the N-m+1 sets of corrected and observed precipitation data over the m-year period that was not used to calibrate the bias-correction method. 

The robustness of the methods for the six remaining catchments is assessed by considering how the performance of each correction method varies with location and climatic characteristics using the methodology described above.