


1
Bus driver accident record; the return of accident proneness
Anders af Wåhlberg* (1)
and
Lisa Dorn (2)
1. Department of Psychology
Uppsala University
P. O. Box 1225
751 42 Uppsala
Sweden
e-mail: anders.af_wahlberg@psyk.uu.se
Homepage: http://www.psyk.uu.se/hemsidor/busdriver
Tel: +46-18-471 25 90, +46-18-33 90 95
2. Department of Human Factors,
Cranfield University, Cranfield, Bedfordshire, MK43 0AL
UK
* corresponding author
Theoretical Issues in Ergonomics Science, Volume 10, Issue 1, 2009, Pages 77-91

2
Abstract
One of the assumptions of the theory of accident proneness is that drivers’ accident liability is stable over time
which was tested in the present paper. Previous investigations of this problem (or rather the conclusions) were
found to be deficient, because they did not take into account the statistical problem of low variance in the
accident variable. However, by correlating the between time periods association coefficient and the mean
number of accidents across several samples, this problem can be overcome. Therefore, the stability of accident
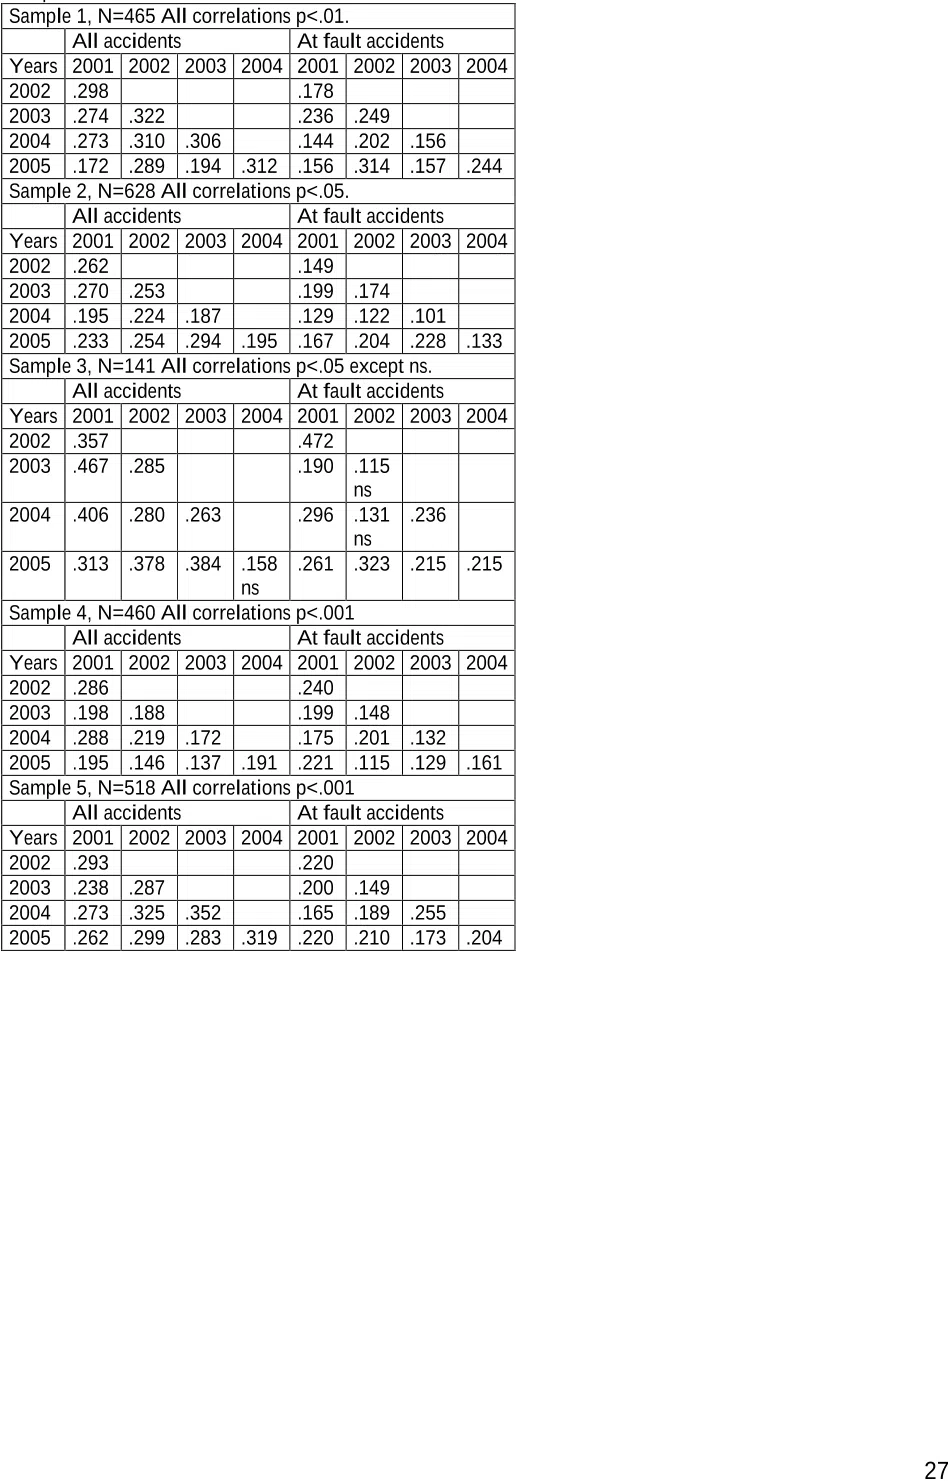
record over time was investigated in five samples of British bus drivers. It was found that the size of the
correlations between time periods increased with the increase in mean accident frequency. Furthermore, this
increase could be described by a linear regression line, which fit the various points extremely well. Also, the
size of correlations of At fault accidents increased faster with the mean than did All accidents, although the
latter had a higher initial value. It was therefore concluded, in contrast to previous authors, that the accident
record of drivers is quite stable over time, and that the very low correlations which have often been found were
due to the samples and methods used (low-risk drivers and short time periods equalling low crash means), and
not of any inherent instability in drivers’ behaviour and/or accident record. It was also concluded that only
culpable accidents should be used for this type of calculation. No evidence was found for a decrease in
correlation size between single years' accidents when time periods between the years were lengthened, i.e.
accidents in one year predicted accidents in several other years equally well. However, the period used was
rather short. The results are discussed with reference to training intervention for accident –involved drivers,
especially for organizations with major fleets such as bus companies.
Key words: accident proneness, bus driver, crash, reliability, stability, accident record

3
1. Introduction
1.1 History and theory of accident proneness
The beginning of safety research has often been traced to British studies about the
distributions of accidents in various populations (mainly industrial workers) in the early 20th
century (e.g. Greenwood & Woods, 1919; Newbold, 1927; Slocombe & Brakeman, 1930).
One of the main hypotheses was that accidents were not random events for workers, but in
some way were due to stable individual difference in their behaviour. This was the origin of
the research tradition of accident proneness.
The early work concluded that some people are clumsy, or risk seeking, and therefore cause
more damage to themselves and their surroundings than their more safety-minded peers, a
notion with quasi-theoretical properties. For example, one major prediction that could be
drawn from this general line of thinking was that people would tend to be stable over time in
their accident proneness, meaning that their numbers (or rates) of accidents would tend to be
the same in different time periods, at least within the same environment. This reasonable way
of thinking did also yield some positive results when empirical testing was undertaken (e.g.
Newbold, 1927; Wong & Hobbs, 1949; Adelstein, 1952), before many researchers turned to
statistical quarrelling (Mintz & Blum, 1949; Maritz, 1950; Mintz, 1954; 1956), and progress
was halted.
The accident proneness concept was imported into the fledgling traffic research field (Farmer
& Chambers, 1929; 1939), along with the basic controversy of whether it actually exists.
While statisticians were mainly interested in how various theoretical distributions could be
fitted against data, and what the results could possibly mean, many traffic researchers studied
the stability of accidents over time (which had generated the positive results for industrial
accidents). At first, it was claimed that a small number of drivers within a time period were
responsible for a fairly large number of accidents (e.g. Baker, 1929; 1932; Tillman &

4
Hobbes, 1949). However, it was soon found that there were actually very low correlations
between accidents in different time periods (e.g. Forbes, 1939; Kerr, 1957). Also, removing
the drivers with many accidents in one time period would actually have very little effect in
reducing crashes, because those with multiple accidents were few and far between. With
time, the traffic accident proneness concept fell into disrepute, with many critics (Kirchner,
1961; Cameron, 1975; McKenna, 1983) and hardly any defenders (for a review, see Porter,
1988). Most traffic researchers who studied the question empirically came to the conclusion
that there was very little stability over time (e.g. Harrington, 1972) as did accident
researchers in general (e.g. Arbous & Kerrich, 1951), due to the fact that most of the
correlations between time periods were extremely small. Today, there seem to be little
interest in the question of whether (traffic) accident record is a stable individual differences
variable (Gebers, 2003, is one of the exceptions).
In the present paper, some of the assumptions, methods and conclusions by previous
researchers regarding whether accident record is stable over time will be challenged as
erroneous, and alternative ways of investigating this question suggested and used. The
subjects covered are; how to analyse and interpret the sizes of accident correlations between
time periods, using all accidents versus culpable ones, and the effect of correlating accidents
in non-adjacent periods.
The notion of accident proneness used in the present study does not assume anything about
its relation to personality or other personal variables, but is simply the statement that people
are differently prone to causing accidents, in a similar environment, and that this is a trait that
is stable over time.
Methodological and statistical background

5
The rejection of the stability over time part of accident proneness did not take into
consideration a number of facts, which, if properly evaluated, point in quite another direction;
firstly, early studies on workers' accidents did often find sizeable (>.20) correlations between
time periods (e.g. Greenwood & Woods, 1919; Newbold, 1927; Farmer & Chambers, 1939);
secondly, a number of studies of professional drivers have reported fairly strong (>.40)
associations over time (e.g. Creswell & Froggatt, 1963; Bach, Bickel & Biehl, 1975;
Milosevic & Vucinic, 1975; Blasco, Prieto & Cornejo, 2003); thirdly, low correlations have
almost all been found in car driver populations (e.g. Forbes, 1939; Burg, 1970; Stewart &
Campbell, 1972; Peck, 1993); finally, culpability for accidents have seldom been included in
the analyses. The first three observations are all part of the same problem, and the solution
when it comes to reconciling them is that the weak associations have most often been
calculated on rather short time periods for low-risk groups, resulting in very low means and
standard deviations, which necessarily mean low statistical associations (Peck, 1993). The
very differing levels of correlations in different studies are therefore a natural result of
differences in mean number of accidents in the samples for the time periods used. In the
words of Arbous and Kerrich (1951): "In fairness to the theory of proneness, however, it must
be pointed out that as the successive exposure periods are increased, the correlation
coefficient will also increase..." (p. 369). Although this statement was about increasing the
variance within a sample by using longer time periods for calculations, the same principle is
valid for comparisons between samples; those with higher means/variances will yield
stronger associations between periods. So, if association data from several studies is gathered,
it can be shown that it is the time period used for calculation and/or the mean number of
accidents in the sample which almost exclusively (70-80 percent of the variance) determines
the size of the correlation between time periods (af Wåhlberg, forthcoming, see Figure 1).