
All figures (14)

TABLE V. X-BAND SETHI SAR MEASUREMENT ERRORS FOR EXAMPLES IN FIG. 5. THRESHOLD ERROR IS MEASURED AT 10−4 . 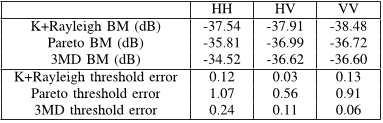
TABLE VI. L-BAND SETHI SAR MEASUREMENT ERRORS FOR EXAMPLES IN FIG. 5. THRESHOLD ERROR IS MEASURED AT 10−4 . 
Fig. 8. SETHI SAR data examples of 3MD models fitting. Left panel: X-band, right panel: L-band. Blue: data, black: first mode, magenta: first and second modes, red: all three modes. 
Fig. 6. Ingara data weighted texture modes, ancn as a function of geometry. 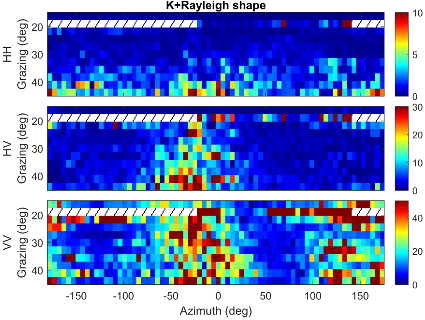
Fig. 7. Ingara data K+Rayleigh shape values as a function of geometry. 
TABLE IV. SETHI L-BAND PARAMETER ESTIMATES FOR EXAMPLES IN FIG. 5. 
Fig. 3. SETHI X-band SAR data in the upwind direction. 
TABLE III. SETHI X-BAND PARAMETER ESTIMATES FOR EXAMPLES IN FIG. 5. 
TABLE II. INGARA MEASUREMENT ERRORS FOR EXAMPLE IN FIG. 2. THRESHOLD ERROR IS MEASURED AT 10−4 . 
Fig. 1. Ingara data in the downwind direction and 30◦ grazing. 
TABLE I. INGARA PARAMETER ESTIMATES FOR EXAMPLE IN FIG. 2. 
Fig. 2. Ingara CCDF model fits for downwind data and 30◦ grazing. Blue - data, red - K+Rayleigh, magenta - Pareto+noise, black - 3MD. Right column is a zoomed version of the left. 
Fig. 10. L-band SETHI SAR data weighted texture modes (ancn) variation with grazing angle. Magenta - mode 1, red - mode 2, blue - mode 3. 
Fig. 9. X-band SETHI SAR data weighted texture modes (ancn) variation with grazing angle. Magenta - mode 1, red - mode 2, blue - mode 3.


27 Aug 2018-