scispace - formally typeset
Search or ask a question
Journal ArticleDOI

Coastal flooding event definition based on damages: Case study of Biarritz Grande Plage on the French Basque coast

TL;DR: In this paper, a statistical analysis was carried out to find the best combination of source variables explaining the reported damages for the identified storms, considering source and aggregated variables based on the empirical run-up formula or the wave energy flux.
About: This article is published in Coastal Engineering.The article was published on 2021-06-01 and is currently open access. It has received 6 citations till now. The article focuses on the topics: Return period.

Summary (5 min read)

1. Introduction

  • Mitigating coastal flooding is a common concern of countries with maritime borders.
  • Nations cope with this problem by developing coastal flood management plans, for which, one important task is the identification of coastal zones at flooding risk [3] .
  • At this stage an important distinction has to be made between source, response variables and impacts.
  • A multivariate threshold can also drive the declustering procedure. [9] used a bivariate threshold in which an event is defined when both the significant wave height and the meteorological surge exceed given values.
  • In section 3, the different rules are tested against the damage historical data and the best ones are retained.

2.1 Site description

  • The Basque coast (Fig. 1 ) is a 200 km rocky coast facing the Atlantic Ocean and stretching from the north of Spain to the south west of France.
  • The authors specifically focused on one site : the so-called Biarritz "Grande Plage" (Fig. 2 ), a touristic seaside resort where hotels, casino, infrastructures are often damaged by storms. [17] .
  • Finally, the water front is composed of a waterfront boardwalk located at 7.65m CD.

2.2.1 Damage database

  • A database reporting flooding events and associated damages was collected at the French Basque coast scale by a research in archives for the period 1950-2014 [18, 19, 20] .
  • The main source of data comes from systematic investigations in the national and local press, and in particular in the regional newspaper Sud-Ouest, as well as in the public archives kept by the government representatives, public bodies and local authorities.
  • A confidence index (1: reliable, 0: low reliability) has been added to this information for more relevant statistical processing.
  • With regard to damages, 5 events generated a level damage 2 with good reliability and 4 caused moderate damage with only one assessment considered unreliable in this category.
  • Indeed, the additional information on the occurrence of flooding and the associated confidence level, is rather scarce due to the low confidence level associated to this information (only 5 new events are associated to good confidence : 3 flooding and 2 no flooding events).

2.2.2 Wave and water level data

  • In addition to the former damage database, a corresponding hazard database composed of wave and water level data and covering the same period was also established [21] .
  • Unfortunately, these mea-surements cover a too short period to be used for the statistical study.
  • WWMII data were compared with the directional wave buoy measurements located 6 km off Biarritz in [21] .

2.3 Source and structural variables

  • Several variables can be used to build the damage function.
  • Structural or response variables can also be computed to explain damages.
  • They are generally made up of a combination of source variables and potentially some site-specific characteristics such as the beach slope for instance.
  • These structural variables are computed for a given sea state represented by the time t (i.e., one t for one sea state) in the following.
  • For the run-up computation, the authors relied on the empirical formulation proposed by [26] : EQUATION in which : the tangent of the angle) of the considered beach which is obviously not constant in the present study.

2.4 Data processing

  • Data processing is performed using R, the free software environment for statistical computing and graphics [28] .
  • Tests were also performed with the 3H time step (i.e., considering water level only when wave data are known) and the results were very similar.
  • The second one is to select the maximum for one variable and take the value of the other variable at the same time .
  • In the second hypothesis, damages are rather explained by a cumulative effect of several successive destructive high tide events.
  • In CART, the procedure starts with a learning phase where the best way to classify storms is determined using hazard variables according to the target variable (here the damages indices from the Table 1 ).

2.5 Validation

  • After determining damage rules according to Table 1 , the authors need to test these on the whole wave and water level data set.
  • A good damage rule is supposed to detect a high percentage of the historical events while avoiding false positives.
  • The authors propose two methods for the validation of the rules.

2. the damage rule requires a calculation over the storm duration

  • In the first case, the authors will only need to test every date in the dataset and verify if the corresponding threshold(s) is/are exceeded by the values of the considered variables at that date.
  • This time window, depending on the value of τ, includes variable number of dates (i.e. tide cycles).
  • Since, after applying a rule (step 1 : rule application), it is possible for an event to contain more than one date meeting a rule criterion, consecutive dates are grouped into a cluster counting as only one event for the validation (step 2 : cleansing).
  • The time lapse fixed to consider clusters as independent is equal to three tidal cycles (i.e., 36H).
  • The final step is the distinction between historical events from the data (i.e., damage level 1 and 2 from Table 1 ) with false positives (0 from Table 1 and non identified dates).

2.5.2 Method 2 : preliminary event detection

  • U e must be high enough to create independent clusters but low enough to include the important events.
  • The subset obtained is then formed of clusters, each including several values for the parameters corresponding to the rule tested.
  • The next step is to select one value (or set of values) by cluster directly based on the rule considered.
  • This is performed by applying the function of the corresponding rule on the specified time information.

3. the damage threshold

  • Max(η)) over each cluster time window.the authors.
  • Finally, the damages threshold (i.e., (5., 3.) in the example) is used to count the events and assign them to their respective categories.

2.6 Return period

  • The best rule functions will be used to compute the return period (RP) of the extreme events found in the historical investigations.
  • The three steps for validating damage rules with method 1 : 1) apply the rule to the entire dataset, 2) cleanse the dates identified in order to count only one per event, 3) sort the non identified dates between dates arguably attachable to events (close in time) and totally unknown ones.

Clusters

  • Complete wave and water level dataset Event detection (threshold u e + separation window of 36H).
  • One value by cluster (applying the rule function without threshold) i.i.d. event subset (see Sections 2.6 and 3.3).

Damage threshold

  • The two steps for validating damage rules with method 2 : 1) apply a threshold u e to the dataset to detect events at least separated by 36H (separation/merging procedure), 2) select one value by cluster by applying the rule function, 3) apply the rule damage threshold and count events.
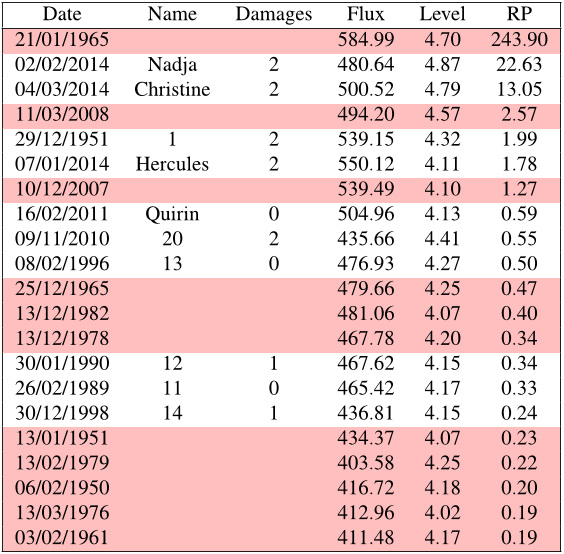
  • May for instance expect storm events showing the highest RP values to be associated to the most severe damages.
  • The EVT distribution of the events subset is estimated using the Generalized Pareto Distribution (GPD) (see, e.g., [31] ).
  • The literature provides several solutions to optimize the choice of u based on either graphical, parametric or mixed methods.
  • Here the authors needed preferably a single value for the reason explained hereafter.

3.1 Calibration of rules with the historical database

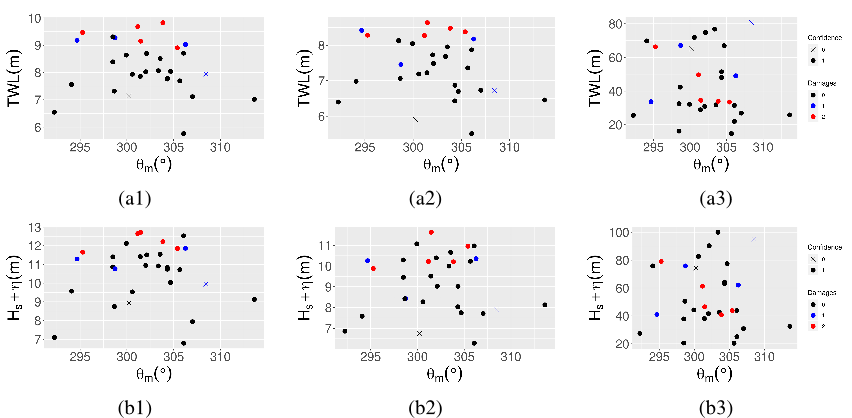
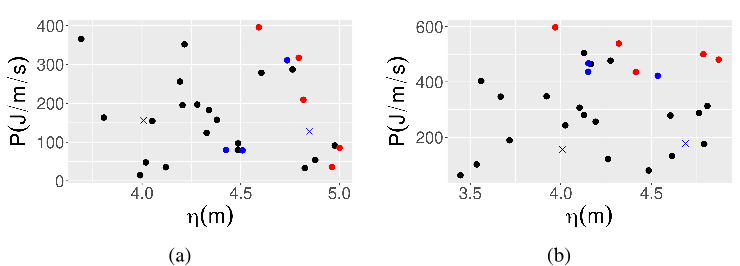
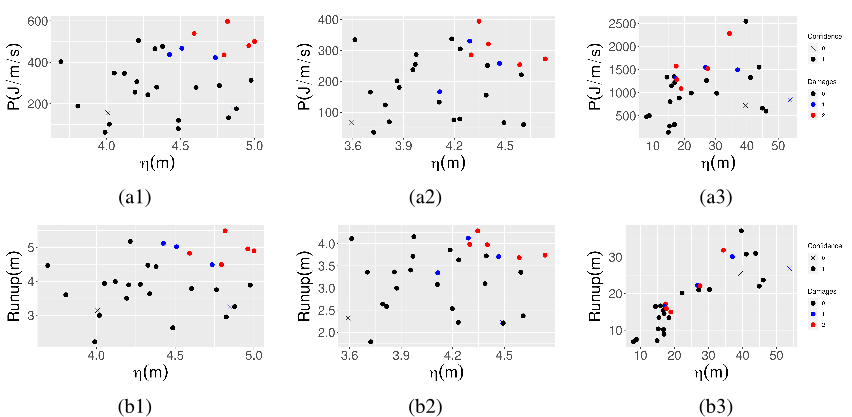
  • In order to build rules consistent with damages observed during storm events, the first step is to investigate how the combinations of variables defined in Figure 3 are distributed when considering the 30 historical storms previously collected.
  • In each Figure, the maximum, mean and cumulative values are calculated over each storm duration.
  • It may also be possible to discriminate damage level from damage level 1 by increasing these two values.
  • Considering mean wave energy flux and water level is not as accurate as considering the maximum values as storms of different damages starts to be mixed in the 2D plot while cumulative variables still appear inappropriate.
  • Figure 9 shows results from simultaneous values for the energy flux P and the water level η.

3.2.1 Method 1 : direct rule application

  • Since, the rules R5, R6, R7 and R8 do not use two non simultaneous maxima they can be written :.
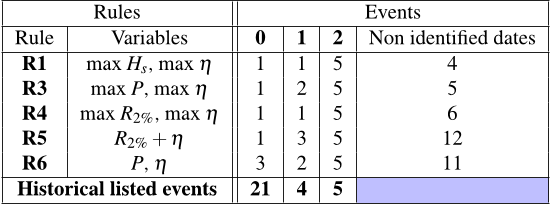
  • To fill columns "0", "1", "2" and "Non identified dates", the authors compare these binary values with the events presented in Table 1 .
  • This optimum result is not obtained with any rule.
  • Nevertheless, except for rules R2 and R8 which lead to a lot of false positives, every rule shows relatively good performance in detecting events, the best ones being R1, R3 (the best rule) and R4, therefore the rules using a time window but not only wave period as wave parameter.
  • The authors also note that the results depends moderately on the time window value.

3.2.2 Method 2 : preliminary event detection

  • The authors tested the most efficient rules (i.e. rules R1, R3 and R4) of the previous section along with rules R5 and R6, which will be used in the return period computation.
  • The following event thresholds have been found to give satisfactory results in the rules validation :.
  • They are consistent with the results of the previous method, the rule R3 still being the most efficient rule.
  • The authors note that the choice of the first threshold(s) used to create the clusters depends on the rule function considered and possibly on the site studied.
  • Conversely, a too high threshold (8.5 m here) will reduce the average size of clusters and finally lead to more false positives.

3.3 Estimation of storm return periods

  • R3 is one of the two best rules, based on the same variables as R6, but authorizing based on non simultaneous maxima.
  • This last rule is also retained to illustrate the importance of this calculation choice in the RP final result.
  • This operation reduced the time series to 924 clusters.
  • This threshold is then used to estimate the parameters of the GPD.
  • The mathematical thresholds are slightly higher than the damage thresholds (i.e., respectively 400 J.m −1 .s −1 and 4.00 m) illustrating a situation where a few damaging events RP may not be properly modeled.

Rules Events Rule

  • The number of false positives is obtained by adding up the numbers in column "0" and the column "Non identified dates".
  • This raises the question of precision in the historical data, especially regarding the dates of the events.
  • When comparing the three tables, it is obvious that the RP of a particular event strongly depends on the rule applied to define the event subset.

4. Discussion

  • Impact is included at the initial stage of coastal flooding events definition by intercomparing rules based on waves and water level parameters to a damage dataset obtained from recent historical records in the Biarritz Grande Plage, French Basque coast.
  • In the present paper, elaborated rules based on maximal, mean, integral values of source and aggregated variables over storm duration, combining waves and water level, were used and confronted to the damage database.
  • Indeed, good results for the explanation of damages are consistently obtained when combining the maximal values of a wave related variable with the maximal value of a water level related one (e.g.,max(H s ) and max(η), max(P) and max(η), etc.) compared to the mean parameters and the integral or accumulated parameters.
  • This is an interesting information, showing that a proper automatic event definition may require more than one date to be accurate and account for the complexity and variability of the events.
  • Nevertheless, one striking conclusion of the paper is that, if the rules are good to predict damages, their application to calculate RP leads to very different results.

5. Conclusions

  • The authors compared a database of source variables gathering waves and water level hindcast and observation data and a storm impact database obtained by investigations in archives and local newspapers, a site dominated by waves and tides on the French Basque coast over a period of 65 years to find statistical rules explaining damages.
  • The rules were then verified by applying them on the wave and water level dataset.
  • The following conclusions can be drawn from this work : .
  • The method presented in this study was therefore able to establish a link between damages and RP.

Did you find this useful? Give us your feedback

Figures (18)
Citations
More filters
Journal ArticleDOI
TL;DR: In this paper , the effect of surrogate seagrass meadows on wave attenuation, sediment transport and shoreline erosion was evaluated in a new flume experiment with two wave energy conditions.

5 citations

Journal ArticleDOI
17 Sep 2021-Water
TL;DR: In this paper, the authors address the problem of defining credible joint statistics of significant wave heights Hs and water levels ζ, focusing on the selection of the sample pair that characterizes each sea storm, to evaluate the occurrence probability of extreme events.
Abstract: Over the last decades, the evaluation of hazards and risks associated with coastal flooding has become increasingly more important in order to protect population and assets. The general purpose of this research was to assess reliable coastal flooding hazard maps due to overflow and wave overtopping. This paper addresses the problem of defining credible joint statistics of significant wave heights Hs and water levels ζ, focusing on the selection of the sample pair that characterizes each sea storm, to evaluate the occurrence probability of extreme events. The pair is selected maximizing a spatial structure variable, i.e., a linear combination of Hs and Relaix, F., Zammit, P.S. Satellite cells are essential for skeletal muscle, specific to each point of the area at risk. The structure variable is defined by the sensitivity of the flooding process to Hs and ζ, as found by analyzing a set of inundation maps produced through a Simplified Shallow-Water numerical model (SSW). The proposed methodology is applied to a coastal stretch in the Venetian littoral (Italy), by means of a 30 year-long time series recorded at the “Acqua Alta” oceanographic research tower, located in the Northern Adriatic Sea in front of the Venetian lagoon. The critical combination of Hs and ζ forming the structure variable is presented in a map, and it can be related to the topography and the presence of mitigation measures. The return period associated with the two recent large storms that occurred in this area in 2018 and 2019 is also investigated. The proposed procedure gives credible occurrence probabilities for these events, whereas other approaches would consider them extremely unlikely.

2 citations

Journal ArticleDOI
TL;DR: In this article , XBeach simulations were used to assess the uncertainties in beach-dune erosion related to the variability of storm severity and duration and pre-storm morphology, and three indicators, relative eroded volume, proportional berm retreat and proportional dune retreat, were evaluated.
Abstract: Early warning systems (EWSs) for coastal erosion are cost-effective instruments for risk reduction. Among other aspects, the selection of the pre-storm beach morphology and the definition of storm characteristics can affect EWS reliability. Here, XBeach simulations were used to assess the uncertainties in beach-dune erosion related to the variability of storm severity and duration and pre-storm morphology. Wave height return periods (from 5 to 50 years) determined the severity and the duration variability was established from confidence intervals after an adjustment with wave height. The variability of steep profiles included different berm morphologies (from fully developed to eroded berms). Three indicators, relative eroded volume, proportional berm retreat and proportional dune retreat, were evaluated. The experiments revealed that: (a) Relative eroded volume uncertainties related to the pre-storm morphology variability were slightly lower (maximum 8%) than the uncertainties related to storm duration (11%–18%). (b) Pre-storm profile variability can induce large uncertainties in the proportional berm retreat (up to 88%) for moderate events such as the 5- and 10-year events. Storm duration variability had less influence on this indicator (maximum 12%). (c) The uncertainties in the proportional dune retreat increased with storm severity and they ranged between 14% and 41% for pre-storm profile variability and between 2% and 40% for storm duration variability. Duration variability even governed the occurrence of dune breaching on eroded berm profiles in the most extreme event. Hence, the uncertainties related to initial/forcing conditions, namely pre-storm morphology and storm duration, must be assessed to develop reliable coastal erosion EWSs.

1 citations

Journal ArticleDOI
TL;DR: In this article, damage caused by extreme storms is evaluated at a regional scale based on news information published in regional newspapers, and the results show that estimated damage intensity is better related to maximum wave energy than cumulative wave energy during a storm, and that beach characteristics should also be included for understanding the distribution of coastal damage.
Abstract: The evaluation of coastal damage caused by storms is not straightforward and different approaches can be applied. In this study, damage caused by extreme storms is evaluated at a regional scale based on news information published in regional newspapers. The data derived from the news are compared with hydrodynamic parameters to check the reliability of this methodology as a preliminary” fast approach” to evaluate storm damage and to identify hotspots along the coast. This methodology was applied to the two most extreme storms ever recorded along the Spanish Mediterranean coast, which occurred in January 2017 and January 2020, severely impacting the coast and causing significant community concerns. The news information from different media sources was processed and weighted to describe the resulting erosion, inundation, sand accumulation, and destruction of infrastructures. Moreover, an accuracy index for scoring the quality of the information was proposed. In spite of some limitations of the method, the resulting regional coastal hazard landscape of damage provides a rapid overview of the intensity and distribution of the damage and enables one to identify the location of potential hotspots for the analyzed extreme storm events. The results show that estimated damage intensity is better related to maximum wave energy than cumulative wave energy during a storm, and that beach characteristics should also be included for understanding the distribution of coastal damage.

1 citations


Cites background from "Coastal flooding event definition b..."

  • ...This information can help to better understand coastal impacts caused by storms, although a careful verification of their uncertainties and potential bias is required before its incorporation to a robust model for coastal risk assessment [8,12]....

    [...]

Journal ArticleDOI
TL;DR: In this paper , a Bayesian network is trained using data from several monitoring networks located near the study site to predict coastal flooding risk in a qualitative manner using observational data and statistical learning methods.
Abstract: Bayesian networks are probabilistic graphical models that are increasingly used to translate hydraulic boundary conditions during storm events into onshore hazards. However, comprehensive databases that are representative of the extreme and episodic nature of storms are needed to train the Bayesian networks. Such databases do not exist for many sites and many Bayesian networks are trained on data generated by process-based models. To our knowledge, they have not been trained exclusively on observational data for storm impact modeling. This study aims to explore the performance in coastal flooding prediction of a Bayesian network exclusively based on observational data. To this end, we take the "Grande Plage" of Biarritz (South west of France) as a test case. The network is trained using data from several monitoring networks located near the study site. Because observational data about storm impact regime are limited, a second aim of this work is to propose a methodology based on statistical learning methods to complement the data about this variable. This methodology aims to select the statistical learning method with the best generalizing ability with a cross validation. Two Bayesian networks are trained, one exclusively on the observational data and one with both observational and predicted data. To compare the two networks, their performances are evaluated on the same events. We demonstrated that it is possible to predict coastal flooding risk in a qualitative manner with a Bayesian network based only on observational data with a $$F_1$$ -score, a measure combining precision and recall, of 0.628. However, the predictive skill of this network is questionable for the most intense storm impact regimes which are impact and overwash regimes. Storm impact data is extended with the random forest method which showed the best generalizing ability based on cross-validation. This extension of the database led to a better Bayesian network in terms of predictive skill, with precision, recall and $$F_1$$ -score 7% higher on average than for the network trained only on observational data.
References
More filters
Journal Article
TL;DR: Copyright (©) 1999–2012 R Foundation for Statistical Computing; permission is granted to make and distribute verbatim copies of this manual provided the copyright notice and permission notice are preserved on all copies.
Abstract: Copyright (©) 1999–2012 R Foundation for Statistical Computing. Permission is granted to make and distribute verbatim copies of this manual provided the copyright notice and this permission notice are preserved on all copies. Permission is granted to copy and distribute modified versions of this manual under the conditions for verbatim copying, provided that the entire resulting derived work is distributed under the terms of a permission notice identical to this one. Permission is granted to copy and distribute translations of this manual into another language, under the above conditions for modified versions, except that this permission notice may be stated in a translation approved by the R Core Team.

272,030 citations

Journal ArticleDOI
TL;DR: The NCEP/NCAR 40-yr reanalysis uses a frozen state-of-the-art global data assimilation system and a database as complete as possible, except that the horizontal resolution is T62 (about 210 km) as discussed by the authors.
Abstract: The NCEP and NCAR are cooperating in a project (denoted “reanalysis”) to produce a 40-year record of global analyses of atmospheric fields in support of the needs of the research and climate monitoring communities. This effort involves the recovery of land surface, ship, rawinsonde, pibal, aircraft, satellite, and other data; quality controlling and assimilating these data with a data assimilation system that is kept unchanged over the reanalysis period 1957–96. This eliminates perceived climate jumps associated with changes in the data assimilation system. The NCEP/NCAR 40-yr reanalysis uses a frozen state-of-the-art global data assimilation system and a database as complete as possible. The data assimilation and the model used are identical to the global system implemented operationally at the NCEP on 11 January 1995, except that the horizontal resolution is T62 (about 210 km). The database has been enhanced with many sources of observations not available in real time for operations, provided b...

28,145 citations

Book
20 Aug 2001
TL;DR: This paper presents a meta-modelling framework that automates the very labor-intensive and therefore time-heavy and therefore expensive and expensive process of manually cataloging and modeling extreme value values in sequences.
Abstract: 1. Introduction.- 2. Basics of Statistical Modeling.- 3. Classical Extreme Value Theory and Models.- 4. Threshold Models.- 5. Extremes of Dependent Sequences.- 6. Extremes of Non-Stationary Sequences.- 7. A Point Process Characterization of Extremes.- 8. Multivariate Extremes.- 9. Further Topics.- Appendix A: Computational Aspects.- Index.

4,476 citations

Journal Article
TL;DR: In this article, the authors combine the updated Gridded Population of the World (GPW2) population distribution estimate for 1990 and lighted settlement imagery with a global digital elevation model (DEM) and a high resolution vector coastline.
Abstract: Recent improvements in mapping of global population distribution makes it possible to estimate the number and distribution of people near coasts with greater accuracy than previously possible, and hence consider the potential exposure of these populations to coastal hazards. In this paper, we combine the updated Gridded Population of the World (GPW2) population distribution estimate for 1990 and lighted settlement imagery with a global digital elevation model (DEM) and a high resolution vector coastline. This produces bivariate distributions of population, lighted settlements and land area as functions of elevation and coastal proximity. The near-coastal population within 100 km of a shoreline and 100 m of sea level was estimated as 1.2 X 10(9) people with average densities nearly 3 times higher than the global average density. Within the near coastal-zone, the average population density diminishes more rapidly with elevation than with distance, while the opposite is true of lighted settlements. Lighted settlements are concentrated within 5 km of coastlines worldwide, whereas average population densities are higher at elevations below 20 m throughout the 100 km width of the near-coastal zone. Presently most of the near-coastal population live in relatively densely-populated rural areas and small to medium cities, rather than in large cities. A range of improvements are required to define a better baseline and scenarios for policy analysis. Improving the resolution of the underlying population data is a priority.

1,404 citations

Frequently Asked Questions (10)
Q1. What have the authors contributed in "Coastal flooding event definition based on damages: case study of biarritz grande plage on the french basque coast" ?

This paper presents a method to include damage at the initial stage of coastal flooding events definition and in return periods computation. The methodology is illustrated within a local study carried out in Biarritz Grande Plage, a meso-tidal, wave dominated beach located on the french basque coast in the south west of France. A statistical analysis was first carried out to find the best combination of source variables explaining the reported damages for the identified storms. Most of the rules formerly studied, except the ones using wave period only as wave parameter, were able to correctly perform this task. Nevertheless, the discrepancy still observed among the different rules calls for further work in this direction. 

Then, the rules skill was retrospectively tested over the total time span, showing the existence of efficient rules, which could be potentially used for damage prediction for future events. Nevertheless, from the results of the paper, it seems that there is still significant work to be done to ensure that each individual storm potential impact is assessed accurately on an appropriate metric respecting the point of view defended in this paper. 

The test based on Kendall’s τ coefficient does not reject independence between the two variables composing the event dataset, allowing the use of equation (8) to estimate the joint probability. 

The number of storms, for which only Biarritz was mentioned is 30 and the number of flood events at the Grande Plage is 13, which represents one third of the storms observed over the period 1950-2014. 

Whereas the problem is more and more acute due to the growing coastal population and associated infrastructures [1], climate change also increases pressure on the coast by sea level rise which allows the ocean to reach usually protected areas [2]. 

another limitation of this study is the unknownbeach profile variability over time during the studied period and its effect on the damages induced by coastal flooding. 

The best rule was the one based on wave energy flux (or equivalently the significant wave height) and water level maxima over the event.• 

Stakeholders being mostly concerned by the impacts to the coast and population, RP should reflect this aspect in applied studies. 

The analysis of quantile/quantile graphs shows an underestimation by the model for extreme sea states, detrimental to this type of study precisely focused on these events. 

The return period of the event {x > x,y > y} is thennaturally computed asRP(x,y) = µP̂r(x > x,y > y)= µP̂r(x > x)P̂r(y > y)= µ{1− Ĝx(x)}{1− Ĝy(y)} ,(8)whereµ = 2015−1949+1∑t∈T 1{x(t)> ux,y(t)> uy} .