
All figures (18)
 Figure 1. Location of the study site on the France map (left panel) with a zoom on the Basque coast (right panel - red rectangle) with buoys (Anglet and Saint-Jean-de-Luz) and tide gauges (Socoa) used on this study.
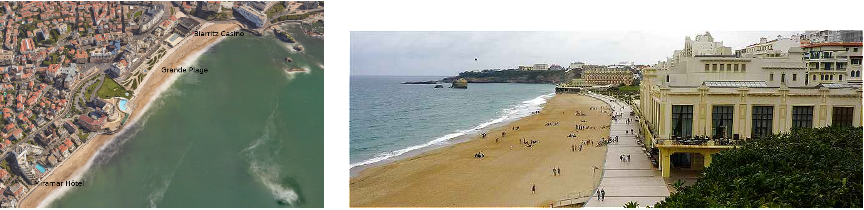 Figure 2. Photographs of the Grande Plage of Biarritz showing a few of the assets frequently flooded (left panel - ©Google Maps), the Grande Plage waterfront and the the casino building (right panel - ©FranceBallade)
 Figure 11. Extrapolation plot for the GPD computed with the time series η +R2% (rule R5) for a threshold of 7.26 m. The lines correspond to the model and its 95% confidence interval, the black dots correspond to the empirical values from the time series.
 Figure 12. Maxima of the Run-up R2% versus maxima of water level η during historical events. The left plots corresponds to values computed with a constant beach slope β = 0.09 (similar to Figure 7 without applying distribution correction). The right plots are obtained by computing the Run-up maximum run-up R2% by sampling one random beach slope for each event from a uniform distribution (with parameters min = 0.06 and max = 0.12). Each line corresponds to a different set of random slopes used to compute the run-up on the right panel.
 Figure 4. The three steps for validating damage rules with method 1 : 1) apply the rule to the entire dataset, 2) cleanse the dates identified in order to count only one per event, 3) sort the non identified dates between dates arguably attachable to events (close in time) and totally unknown ones. The result can take the form of a count of events based on the damages index (0,1 or 2) if the event is existing or NI for ”Not identified”.
 Figure 5. The two steps for validating damage rules with method 2 : 1) apply a threshold ue to the dataset to detect events at least separated by 36H (separation/merging procedure), 2) select one value by cluster by applying the rule function, 3) apply the rule damage threshold and count events. The result can take the form of a count of events based on the damages index (0,1 or 2) if the event is existing or NI for ”Not identified”.
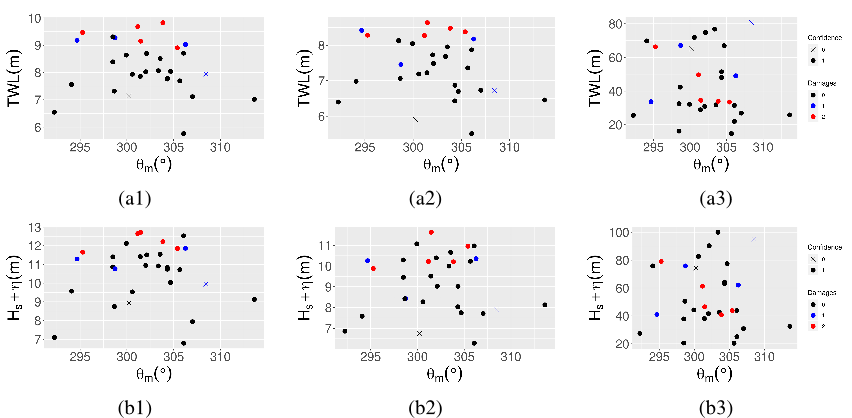 Figure 8. Total water level (a) / Hs +η (b) versus mean wave direction over storm duration. (1) maximum value of total water level / Hs +η over storm duration, (2) mean value of total water level / Hs +η , (3) cumulative value of total water level / Hs +η .
 Figure 10. (a) storms as a function of the maximum I (in x-axis) and the average of θm (y-axis). (b) storms as a function of water level η at maximum of I (x-axis) and wave power P at maximum of I (y-axis)
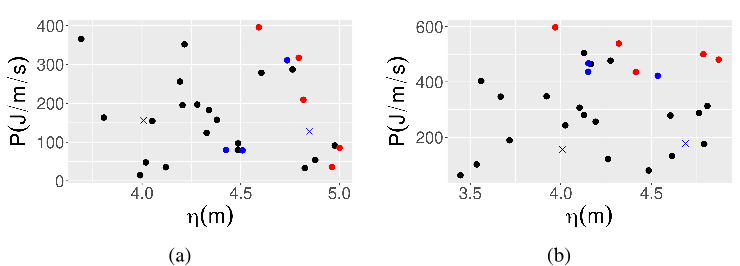 Figure 9. Wave energy flux versus water level (a) values of P taken when η is maximum (b) values η taken when P is maximum
 Table 4. List of storms ranked by decreasing RP based on rule R5. In pink, events not reported in the damage database (Table 1).
 Figure 6. Significant wave height Hs (a) / peak period Tp (b) / energetic period Tm10 (c) versus water level, (1) maximum values calculated for both variables over storm duration, (2) mean values for both variables over storm duration, (3) cumulative values for both variables over storm duration. Damage level : 0 (black), 1 (blue), 2 (red) (points represented by a cross ”+” are data of low confidence see Table 1).
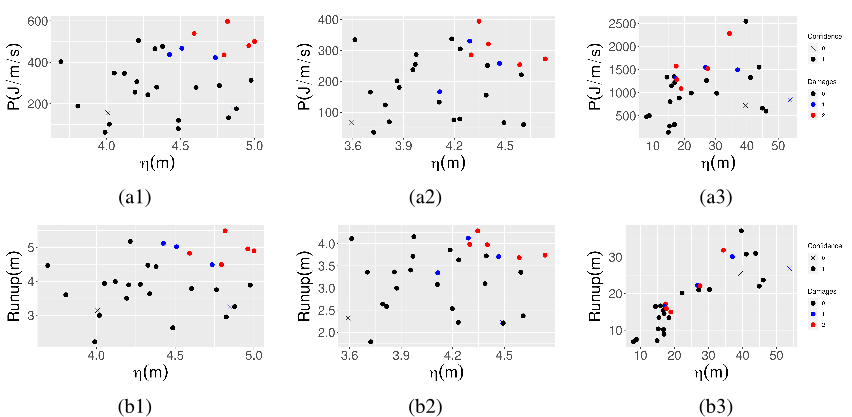 Figure 7. Energy flux P (a) / wave run-up R2% as calculated by Stockdon’s formula (b) versus water level, (1) maximum values calculated for both variables over storm duration, (2) mean values for both variables over storm duration, (3) cumulative values for both variables over storm duration. Damage level : 0 (black), 1 (blue), 2 (red) (points represented by a cross ”+” are data of low confidence see Table 1).
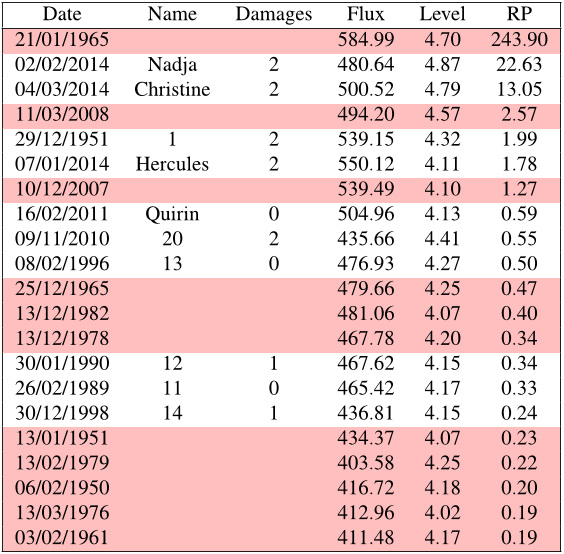 Table 5. List of storms ranked by decreasing RP based on rule R6. In pink, events not reported in the damage database (Table 1)
 Figure 3. Diagram summarizing the different possibilities of event definition based on data taken from the ”Andrea” storm (between 26/02/2014 and 03/03/2014 as symbolized by pink lines).
 Table 6. List of storms ranked by decreasing RP based on rules R3. In pink, events not reported in the damage database (Table 1)
 Table 1. Database of damages related to coastal flooding in the Biarritz Grande Plage. When the events correspond to known storms, their name is used if not their number. The dates and durations are either extracted or inferred from the press and archives. The Confidence indices are coded as 1 (confident) or 0 (not confident). Damage is coded in intensity 0 (weak/absent), 1 (moderate) or 2 (strong) and flooding occurrence is coded by 1 (presence) and 0 (absence). The last column indicates the storms recognized as CATNAT and the corresponding dates. The state of natural disaster (natural catastrophe = CATNAT) is a situation whose recognition in France by the Ministry of the Interior allows for the systematic compensation of victims of damage caused by various natural agents. This procedure was established in 1982.
 Table 2. Method 1 rules validation results for τ = 4 and τ = 6. For each rule, the number of identified category 0, 1 or 2 events is given along with the number of unrecorded events in the historical dataset. It should be remembered that, during the latter, of the 30 events listed, 21 (respectively 4, 5) were Category 0 (1, 2, respectively). The number of false positives is obtained by adding up the numbers in column ”0” and the column ”Non identified dates”.
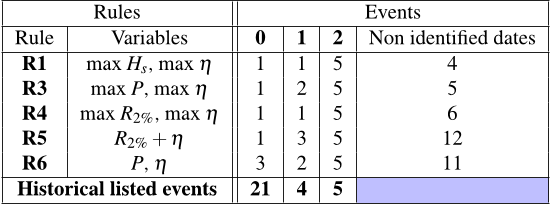 Table 3. Method 2 rules validation results. For each rule, the number of identified category 0, 1 or 2 events is given along with the number of unrecorded events in the historical dataset. It should be remembered that, during the latter, of the 30 events listed, 21 (respectively 4, 5) were Category 0 (1, 2, respectively). The number of false positives is obtained by adding up the numbers in column ”0” and the column ”Non identified dates”.


