
All figures (15)

Fig. 8. Heat conductivity breakdown due to air, radiation and through the solid material. 
Fig. 10. Temperature distribution through periodic packing of silica aggregates. ![Table 1 Comparison of thermal conductivity λ of high performance thermal insulation materials [3] (EPS and XPS are expanded and extruded polystyrene respectively).](/figures/table-1-comparison-of-thermal-conductivity-l-of-high-1wilio0z.png)
Table 1 Comparison of thermal conductivity λ of high performance thermal insulation materials [3] (EPS and XPS are expanded and extruded polystyrene respectively). ![Fig. 4. Thermal conductivity measurement system composed of: [1] insulated enclosure, [2] vacuum pump, [3] thermostat, [4] pressure sensor, [5] measurement electronics and laptop.](/figures/fig-4-thermal-conductivity-measurement-system-composed-of-1-2277oh7c.png)
Fig. 4. Thermal conductivity measurement system composed of: [1] insulated enclosure, [2] vacuum pump, [3] thermostat, [4] pressure sensor, [5] measurement electronics and laptop. 
Fig. 9. Radiation distribution through periodic packing of silica aggregates. 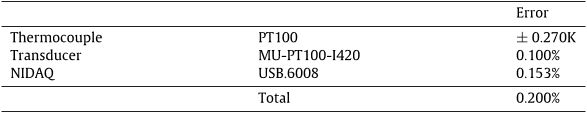
Table 2 Measurement uncertainty for temperature sensors. 
Fig. 5. Schematic diagram of measurement system. The power required to maintain the top hot plate at 40 ◦C is proportional to the effective thermal conductivity. 
Table 3 Measurement uncertainty for power sensor. 
Fig. 1. Geometry generated with YADE before and after compression, aggregates shown in different colors. 
Fig. 2. The two domains for LBM, Ωs and Ωf for the solid and fluid respectively, with periodic boundaries Γp and temperature boundaries Γt and Γb . ![Fig. 11. Comparison of effective thermal conductivity to reference values [7]. Simulated effective thermal conductivity decreases at low pressures due to solid conductivity being influenced by the globally defined mean free path.](/figures/fig-11-comparison-of-effective-thermal-conductivity-to-1h8b67lo.png)
Fig. 11. Comparison of effective thermal conductivity to reference values [7]. Simulated effective thermal conductivity decreases at low pressures due to solid conductivity being influenced by the globally defined mean free path. 
Fig. 12. (A) Measurement of the effect different compression forces on the thermal conductivity of the VIP. (B) Simulation results of the effect of different compression forces on the thermal conductivity of the VIP (3.5 mW/mK is added to correct for thermal bridging artifacts in the measurement). 
Fig. 6. Simplified geometry used to calculate experimental order of convergence. Top and bottom boundaries are held at constant temperature and the other 4 boundaries are periodic. 
Fig. 7. Relative error as a function of simulation resolution. ![Fig. 3. Schematic representation of the speed directions according to D3Q7 [25].](/figures/fig-3-schematic-representation-of-the-speed-directions-hjrwjs08.png)
Fig. 3. Schematic representation of the speed directions according to D3Q7 [25].


![Table 1 Comparison of thermal conductivity λ of high performance thermal insulation materials [3] (EPS and XPS are expanded and extruded polystyrene respectively).](/figures/table-1-comparison-of-thermal-conductivity-l-of-high-1wilio0z.webp)
![Fig. 4. Thermal conductivity measurement system composed of: [1] insulated enclosure, [2] vacuum pump, [3] thermostat, [4] pressure sensor, [5] measurement electronics and laptop.](/figures/fig-4-thermal-conductivity-measurement-system-composed-of-1-2277oh7c.webp)


![Fig. 11. Comparison of effective thermal conductivity to reference values [7]. Simulated effective thermal conductivity decreases at low pressures due to solid conductivity being influenced by the globally defined mean free path.](/figures/fig-11-comparison-of-effective-thermal-conductivity-to-1h8b67lo.webp)


![Fig. 3. Schematic representation of the speed directions according to D3Q7 [25].](/figures/fig-3-schematic-representation-of-the-speed-directions-hjrwjs08.webp)