
All figures (15)

Table 5: Marital status 
Table A.1: Utility-consistent poverty lines 
Figure 2: Time to fetch water 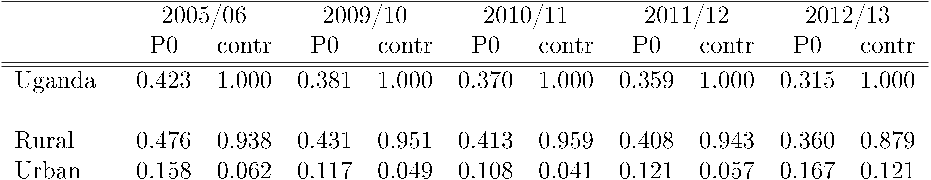
Table 4: Poverty headcounts 2002-2012 using six spatial domains 
Figure 6: Coping with adverse shocks 
Table A.3: Poverty severity 2002-2012 using six spatial domains 
Table 6: Most important source of earnings 
Figure 5: Days inactive 
Figure 4: Distance to health infrastructure 
Table A.2: Poverty gap 2002-2012 using six spatial domains 
Figure 3: Household size and child dependency ratios 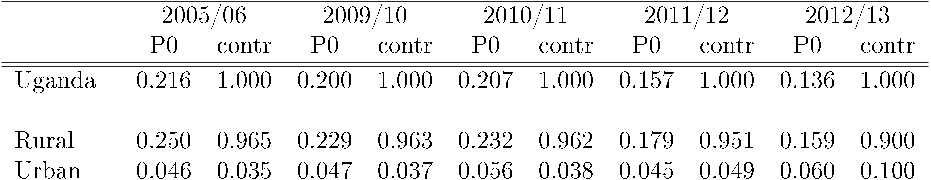
Table 3: Poverty headcounts 2002-2012 using one spatial domain 
Figure 1: Regional poverty dynamics 
Table 1: O cial poverty headcounts 2002-12 
Table 2: Utility-consistent poverty lines based on UNHS 2012/13


