
All figures (10)
 Fig. 7. Effect of net surface radial curvature on fringe shape (a) scheme of the non-sequential ray trace. (b) Integrated fringe shapes of an ideal uncurved fringe (SE ∞) and of the simulated fringes (c) for radial surface errors of SE 20 (left) and SE 10 (right).
 Fig. 5. (a) Temperature tuning rate for tuning modes: constant density (TTCD) and constant pressure (TTCP) as a function of the CTE of the spacer and according length of the FS part of a composite spacer made of silica and calcium fluoride. (b) Three-dimensional model of the FWFIMI with composite spacers in the air arm.
 Fig. 6. Global contrast for angular distributed light incident on an FWFIMI, where the arm lengths d 1 and d 2 are varied around the ideal values for mean angles of incidence of θt 2° (a) and θt 0° (b). Tolerances are indicated by white squares.
 Fig. 10. (i) Receiver setup for the range-resolved measurement of wind speeds. Blue boxes mark components to be inserted for a fiber-coupled setup. (ii) Scheme of a two-lens optical scrambler with two aspheres of focal length f. (iii) Signal processing: light distributions on the linear detector (LPMT1) for reference and signal light (illumination function neglected).
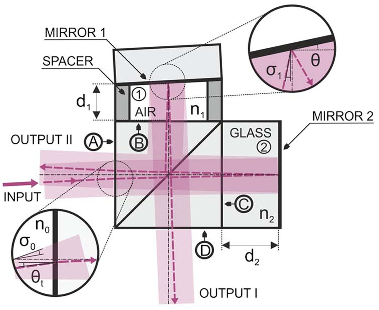 Fig. 3. Monolithic fringe-imaging Michelson interferometer (FWFIMI) tilted by 2° with air arm (1) and glass arm (2).
 Fig. 9. Global fringe contrast as a function of the distance (dz ) from the exit face of the FWFIMI. Inset: Global fringe patterns for increasing values of d z and ray-tracing layout of the FWFIMI used for the simulations.
 Fig. 4. OPD change in wavelengths as a function of incident angle for FWFIMI field widened for θt 0° and 2° and uncompensated FIMI. Vertical lines mark the respective tilt angle (θt ).
 Table 1. Penalty Factors for Wind Speed Measurement
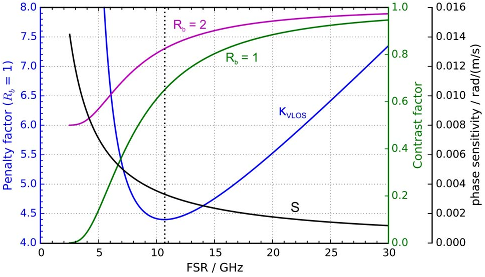 Fig. 1. Penalty factor of wind speed measurement κVLOS (blue), contrast factor G(FSR) (green: Rb 1, magenta: Rb 2), and phase sensitivity S (black) as a function of FSR for 273 K, Rb 1 at a wavelength of 355 nm.
 Fig. 11. (a) Detector SNR of one pulse for h 10; 000 m, Rb 1 and (b) h 1000 m, Rb 6 in the cases of the laser transmitters: “WALES,” “MULTIPLY,” “AWIATOR,” and “HYPO.” Two curves are shown for every transmitter, giving the SNR of one center and one edge pixel of the PMT array illuminated with a centered interference fringe. Colored areas mark the regions in between where the SNR values of the other pixels are located. Additional black squares mark the SNR of the third pixel in case of WALES. The solid black line marks a range dependence of the SNR proportional to 1/Range. (c) Total speckle patterns for h 10; 000 m, Rb 1 and for h 1000 m, Rb 6. (d) Exemplary downsampled speckle distribution for one WALES pulse at h 1000 m, Rb 6 and the respective integrated distributions on a linear detector for 10 signal pulses and 1000 reference pulses.


