scispace - formally typeset
Search or ask a question
Journal ArticleDOI

Detailed analysis of the flow within the boundary layer and wake of a full-scale ship

15 Dec 2020-Ocean Engineering (Pergamon)-Vol. 218, pp 108022
TL;DR: A detailed numerical flow assessment of the boundary layer and wake of a full-scale cargo ship was conducted using a sophisticated numerical approach that is able to resolve large turbulent scale vortices contained in the flow as mentioned in this paper.
About: This article is published in Ocean Engineering.The article was published on 2020-12-15 and is currently open access. It has received 5 citations till now. The article focuses on the topics: Boundary layer & Wake.

Summary (3 min read)

1. Introduction

  • Experimental fluid dynamics towing tank tests have been traditionally used to evaluate the flow around the ship.
  • Also, the aft boundary layer is significantly different in model and full-scale.
  • LES resolves turbulent vortices everywhere in the flow domain down to the grid size.
  • This method is more computationally affordable in ship hydrodynamics than LES, allowing the study of complex unsteady flows in full-scale and being deemed as the best alternative to calculate wake parameters, especially behind high block coefficient ships (Larsson et al., 2015).
  • The authors established that both DES approaches improve the prediction of the total resistance and velocity distribution for most of the propeller plane; however, the authors also revealed that both models showed issues predicting the shear stress in the boundary layer region.

2. Benchmark Case Study

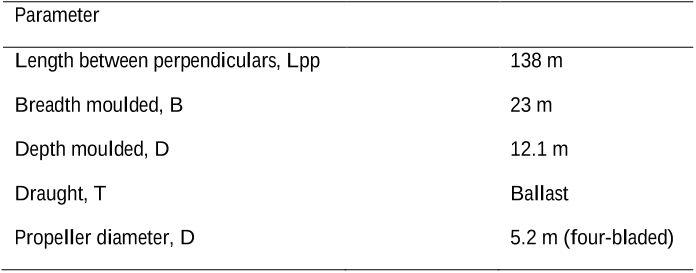
  • The 'Regal' is a 138m single screw vessel with the following main particulars (Table 1):.
  • Before the sea trials, the vessel was dry-docked, the hull was cleaned, and the propeller surface was polished.
  • The scanned geometry was directly imported into the CFD computations, thus ensuring high accuracy of the geometry CAD models.
  • These numerical study simulations of the flow around the ship were conducted using the commercial CFD code Siemens Star CCM+.

3. Numerical Approach

  • This work uses the Improved Delayed Detached Eddy Simulation turbulence modelling strategy and following the approach described in previous work (Pena et al., 2019; Pena et al., 2020).
  • In general, this model switches between the RANS SST k-ω model, which has demonstrated maturity and reliability calculating skin friction coefficients and steady flow features (Wilcox, 1993; Menter, 1994); and LES in away from the wall, where it can capture the larger unsteady eddies such as the bilge vortex.
  • This approach follows the ITTC recommended practices (ITTC, 2014c, Lloyds Register, 2016).
  • The DFBI (Dynamic Fluid Body Interaction) module was used to simulate the motion of the ship in response to pressure and shear forces exerted by the fluid on the solid body, as well as gravity.

4. Boundary Layer Analysis Approach

  • As mentioned in the introduction section, this analysis required a higher definition of the boundary layer of the ship that is required to measure the velocity profiles across the 3D ship boundary layer of the.
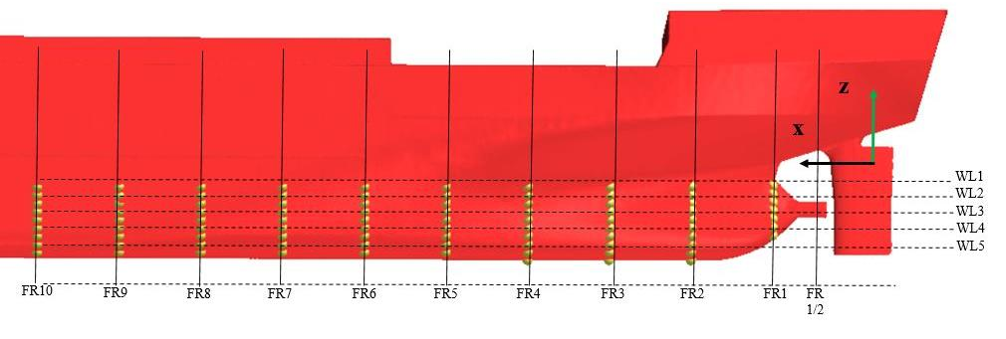
  • All planes are parallel to each other, and their normal component is parallel to the ship length vector.
  • Transversal waterline (WLi) and length planes (LGi) are also defined for reference purposes.
  • Note that FR½ corresponds to the propeller plane, where nominal wake velocity measurements are taken.
  • Additional probe points are installed at the flat bottom which are built through the intersection of LGi planes, FRi planes and the hull surface.

5. Ship Resistance: Calculated Components

  • The bare hull total resistance, viscous resistance and pressure resistance are determined from the converged IDDES simulations.
  • The drag forces are made dimensionless and represented by the total resistance coefficient (𝐶𝑇), pressure resistance coefficient (𝐶𝑃) and the viscous resistance coefficient (𝐶𝑉).
  • Note that 𝐶𝑉 is calculated using the shear stress tensor and accounts for viscous stresses that the fluid exerts to the hull.
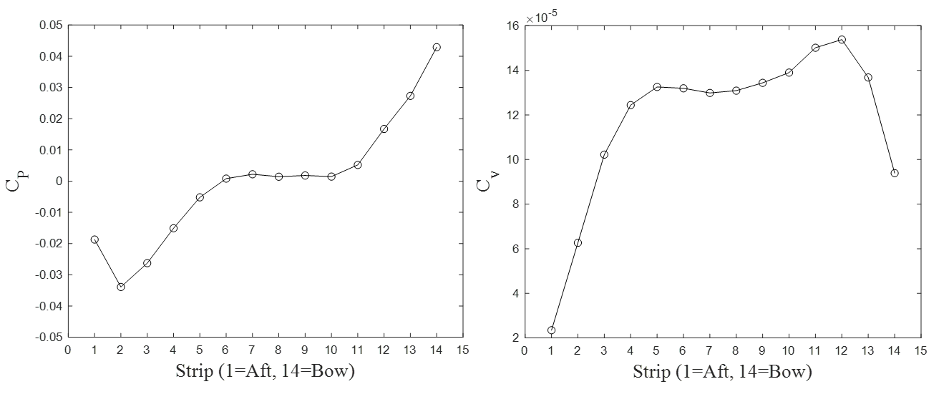
  • Ship resistance distribution per unit length is also measured to quantify the drag contribution of each hull segment (i.e. bow, stern).
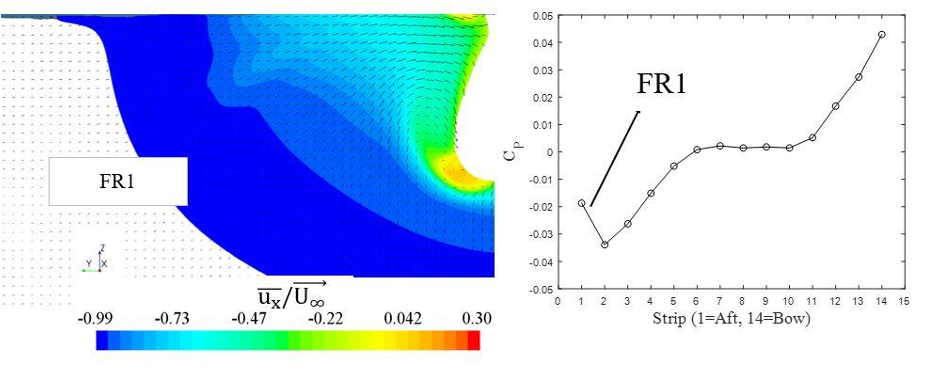
  • Resistance per unit length was plotted, where 1 is at the Aft Perpendicular and 14 is at the Forward Perpendicular (F.P).

6. Computational Set-up

  • 1 Time-step and Spatial Discretization The Courant number (Cr) is used to represent the number of cells that the fluid travels through within a time step, and it is defined as Cr= 𝑢∆𝑡 ∆𝑥 (where 𝑢 is the local speed, ∆𝑡 the interval of time (time step) and ∆𝑥 the cell size in the direction of the flow).
  • All simulations used a 2nd order spatial and temporal discretisation for all equations.
  • A very high-density mesh was generally defined in regions around the stern of the vessel , including the rudder.
  • Besides, a second- order spatial resolution scheme was used to discretise the free-surface, with a trimmed mesh aligned with the calm water free-surface.
  • With regards to the near-wall cell, the grid was set-up to achieve a mean y+ of 1 and ensuring that no wall functions are applied in the near-wall region.

7. Mesh Performance Analysis

  • A mesh independence study was conducted for the simulation set-up on four different grid resolutions by varying the mesh size input parameter while holding all other parameters constant and following recommended practices (ITTC, 2017).
  • The uniform parameter refinement ratio was established as √2.
  • Also, mesh convergence is monitored by plotting the resolved Turbulent Kinetic Energy (TKE) convergence for the four grids at FR1 as shown in Figure 8.
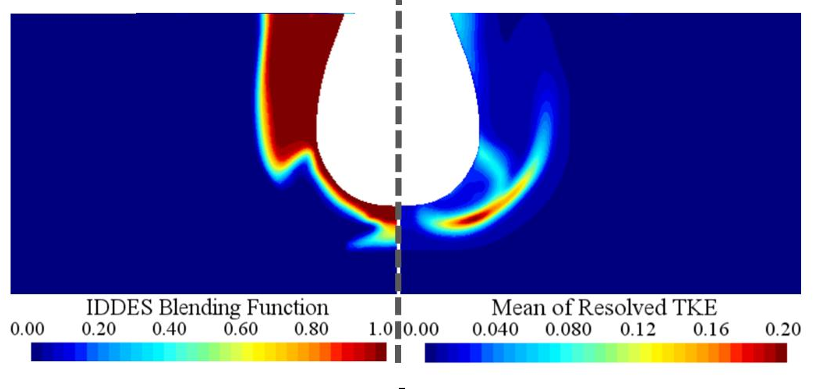
  • The comparison demonstrates that as desired, the core of the bilge vortex falls in the LES region and confirms that the present grid will resolve most of the vortex turbulence.
  • Looking back at Figure 11, it could be seen that the LES region is already close to the near-wall region, so it could be risky to significantly reduce the mesh size, since there could be an incursion of the LES region into the RANS region and thus trigger the undesired MSD phenomenon.

8. Results Analysis

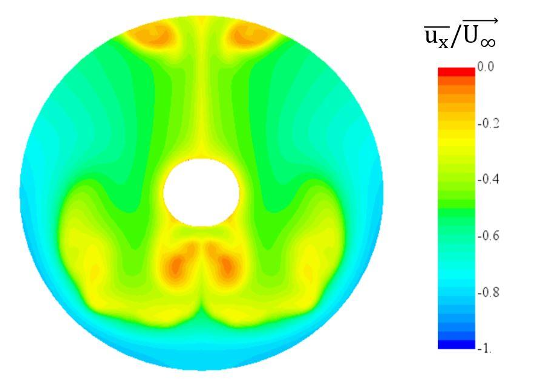
  • The numerical results of the flow around the hull are shown and discussed in terms of ship resistance coefficients, limiting streamlines, nominal wake and the boundary layer at the stern of the ship.
  • Overall, the pressure resistance displays a significant pressure imbalance between the aft and bow ends of the ship.
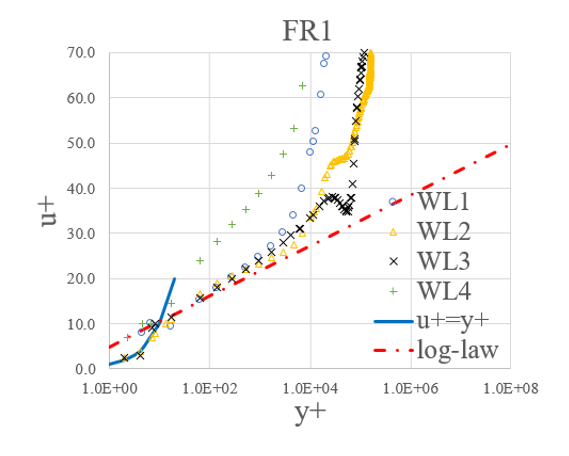
  • Downstream at FR7 , the boundary layer considerably thickens, and stronger crossflows appear.
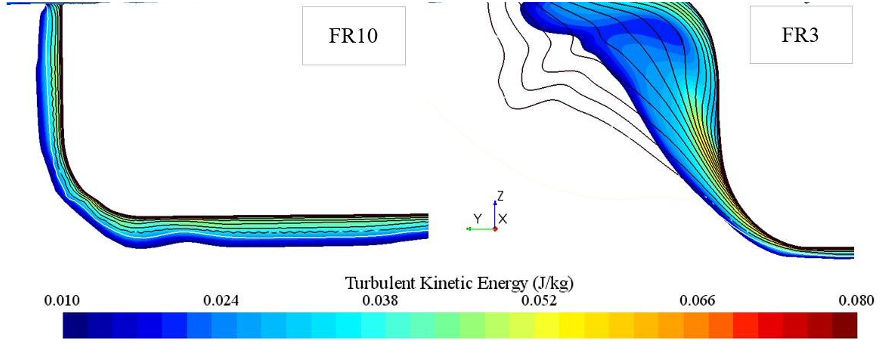
  • The FR10 plot and WL1 series represent the velocity profiles measured on the probe point located at the intersection of the frame 'FR10' and the waterline 'WL1' (or the point PFR10WL1).
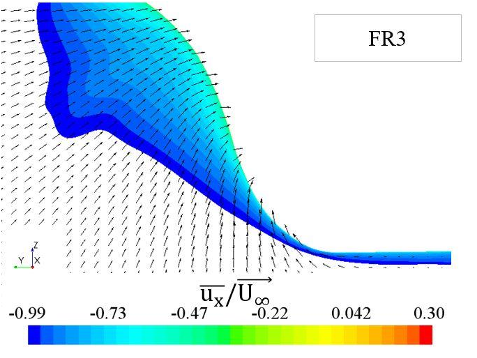
  • The side vortex sheet is formed due to the change in curvature of the hull and is found to be weak when compared to the bilge vortex.

8. Discussion and Conclusions

  • The present research has numerically investigated the ship hydrodynamic performance of a full-scale general cargo ship using extensive flow data on the boundary layer and wake field.
  • This negative pressure gradient, together with the bilge vortex create the perfect environment for a local flow recirculation region near the propeller hub.
  • As the flow advances, the near-wall region flow particles retard to a point where it can no longer counteract the pressure gradient, thus separating from the surface.
  • The detriment on the ship efficiency is triggered by the loss of momentum that takes place on the aft end boundary layer.
  • In general, the analysis conducted within this work has demonstrated to be essential to a full understanding and explanation of the underlying physical structure of the full-scale aft end flow.

Did you find this useful? Give us your feedback

Citations
More filters
Journal ArticleDOI
TL;DR: A review of the state-of-the-art of turbulence modeling for ship hydrodynamic applications can be found in this paper, where the authors provide recommendations for the selection of turbulence modelling strategies versus various ship simulation scenarios, such as resistance prediction, ship flow modelling, self-propulsion and cavitation analyses.

15 citations

Journal ArticleDOI
TL;DR: In this paper , the authors present an overview of applying ML techniques to enhance ships' sustainability, covering the ML fundamentals and applications in relevant areas: ship design, operational performance, and voyage planning.

7 citations

Journal ArticleDOI
TL;DR: In this article , the authors explore an optimal approach for full-scale ship simulations and investigate their influence on the prediction of ship resistance, ship-generated waves as well as the boundary-layer flow of the hull.
Abstract: Computational Fluid Dynamics (CFD) simulations of a ship’s operations are generally conducted at model scale, but the reduced scale changes the fluid behaviour around the ship. Whilst ideally ship simulations should be run directly at full scale, a guide has not been published to advise on the suitable setups that can provide accurate results while minimizing the computational cost. To address this, the present work explores an optimal approach for full-scale ship simulations. Extensive sensitivity studies were conducted on relevant computational setups to investigate their influences on the prediction of ship resistance, ship-generated waves as well as the boundary-layer flow of the hull. A set of CFD setups for full-scale ship simulations in open water was recommended. It was demonstrated that the ideal Y+ and Courant numbers in full scale are evidently different from those given in current model-scale CFD guidelines, indicating the necessity to establish full-scale CFD guidelines separately.

2 citations

Journal ArticleDOI
TL;DR: In this paper , the main findings from the full-scale Computational Fluid Dynamics (CFD) analyses conducted at SINTEF Ocean on the case of MV REGAL, which is one of the benchmark vessels studied in the ongoing joint industry project JoRes, are summarized.
Abstract: This paper summarises the main findings from the full-scale Computational Fluid Dynamics (CFD) analyses conducted at SINTEF Ocean on the case of MV REGAL, which is one of the benchmark vessels studied in the ongoing joint industry project JoRes. The numerical approach is described in detail, and comparative results are presented regarding the propeller open water characteristics, ship towing resistance, and ship self-propulsion performance. The focus of numerical investigations is on the assessment of the existing simulation best practises applied to a ship-scale case in a blind simulation exercise and the performance thereof with different turbulence modelling methods. The results are compared directly with full-scale performance predictions based on model tests conducted at SINTEF Ocean and sea trials data obtained in the JoRes project.
References
More filters
Journal ArticleDOI
TL;DR: In this article, a CFD strategy is proposed that combines delayed detached-eddy simulation (DDES) with an improved RANS-LES hybrid model aimed at wall modelling in LES (WMLES).

1,543 citations

Journal ArticleDOI
TL;DR: In this article, the Strouhal number was used to measure the vortex shedding frequency from spheres in a low-speed wind tunnel and the results showed that at Reynolds numbers ranging from 8X10² to 1.5X10⁴, the higher and lower frequency modes of the stromhal number coexist.
Abstract: Vortex shedding from spheres at Reynolds numbers from 3 × 10² to 4 × 10⁴ in a uniform flow was investigated experimentally. Standard hot-wire technique were used to measure the vortex shedding frequency from spheres in a low-speed wind tunnel. Flow-visualization experiments were carried out in a water channel. Important results from the investigation were that (i) the variation of the Strouhal number St (=fD/U0 , U0 : freestream velocity, D: diameter of the sphere, f: vortex shedding frequency) with the Reynolds number (= U0 D/v, v: kinematic viscosity) can be classified into four regions, (ii) the Reynolds number at which the hairpinshaped vortices begin to change from laminar to turbulent vortices so that the wake structure behind the sphere is not shown clearly when a Reynolds number of about 800 is reached, and (vi) at Reynolds numbers ranging from 8X10² to 1.5X10⁴ , the higher and lower frequency modes of the Strouhal number coexist.

482 citations

Journal ArticleDOI
TL;DR: In this article, the authors discuss the role of vortices in the flight of modern helicopters and aircraft, and discuss the geometrical boundary geometries that act to promote vortex formation.
Abstract: Situations where an effectively irrotational freest ream contains regions of concentrated vorticity are common in external aerodynamics, where vortices are known to play an important role in the flight of modern helicopters (Carr 1988) and aircraft (Cunningham 1989, Mabey 1989). Vortices may arise as a consequence of shedding from some upstream surface or near certain three-dimensional boundary geometries that act to promote vortex formation. Examples of the former type of vortex gen­ eration include: 1. vortices that trail from the tips of airfoils (Harvey & Perry 1971) and control surfaces on submarines (Lugt 1983), 2. transverse vortices shed from maneuvering airfoil surfaces and helicopter blades in a process known as dynamic stall (McCroskey 1982, Francis & Keesee 1985, Carr 1988), and 3. shedding from stationary obstacles. Geometry-induced creation can occur in any situation where a flow along a wall approaches a surface-mounted obstacle; examples include: 1. airframe features such as wing/body junctions, 2. conning towers on submarines, and 3 . computer chips mounted on electrical circuit boards. Similar geometries are en-

384 citations

Journal ArticleDOI
Y. Na1, Parviz Moin1
TL;DR: In this paper, a separated turbulent boundary layer over a flat plate was investigated by direct numerical simulation of the incompressible Navier-Stokes equations, where a suction-blowing velocity distribution was prescribed along the upper boundary of the computational domain to create an adverse-to-favourable pressure gradient that produces a closed separation bubble.
Abstract: A separated turbulent boundary layer over a flat plate was investigated by direct numerical simulation of the incompressible Navier–Stokes equations. A suction-blowing velocity distribution was prescribed along the upper boundary of the computational domain to create an adverse-to-favourable pressure gradient that produces a closed separation bubble. The Reynolds number based on inlet free-stream velocity and momentum thickness is 300. Neither instantaneous detachment nor reattachment points are fixed in space but fluctuate significantly. The mean detachment and reattachment locations determined by three different definitions, i.e. (i) location of 50% forward flow fraction, (ii) mean dividing streamline (ψ=0), (iii) location of zero wall-shear stress (τw=0), are in good agreement. Instantaneous vorticity contours show that the turbulent structures emanating upstream of separation move upwards into the shear layer in the detachment region and then turn around the bubble. The locations of the maximum turbulence intensities as well as Reynolds shear stress occur in the middle of the shear layer. In the detached flow region, Reynolds shear stresses and their gradients are large away from the wall and thus the largest pressure fluctuations are in the middle of the shear layer. Iso-surfaces of negative pressure fluctuations which correspond to the core region of the vortices show that large-scale structures grow in the shear layer and agglomerate. They then impinge on the wall and subsequently convect downstream. The characteristic Strouhal number St=fδ*in/U0 associated with this motion ranges from 0.0025 to 0.01. The kinetic energy budget in the detachment region is very similar to that of a plane mixing layer.

283 citations

Book
01 Sep 2010

77 citations

Frequently Asked Questions (1)
Q1. What contributions have the authors mentioned in the paper "Detailed analysis of the flow within the boundary layer and wake of a full-scale ship" ?

This article presents a detailed numerical flow assessment of the boundary layer and wake of a full-scale cargo ship. The analysis method followed during this work has been a determinant factor for fast and efficient design of energy saving devices, propellers or rudders that work within the limits of the boundary layer of a ship. In particular, this thorough analysis avoided the necessity to use the commonly used practice of trial and error that is typically followed in the maritime industry.