
All figures (15)

Table 1 Input parameters for the economic model ![Fig. 44. Comparison of (a) non grid-optimized; and (b) grid-optimized battery operating strategies. Source: [34], p.4.](/figures/fig-44-comparison-of-a-non-grid-optimized-and-b-grid-1iqi7law.png)
Fig. 44. Comparison of (a) non grid-optimized; and (b) grid-optimized battery operating strategies. Source: [34], p.4. ![Fig. 1. System architecture. Source: adopted from [1], p.7.](/figures/fig-1-system-architecture-source-adopted-from-1-p-7-2rdd00s0.png)
Fig. 1. System architecture. Source: adopted from [1], p.7. 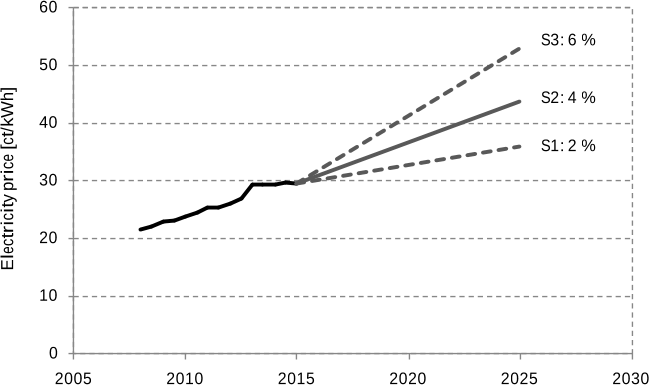
Fig. 5. Retail electricity price in Germany. 
Table 2 Input parameters for the technical model (left two columns: PV system, right two columns: battery storage system) 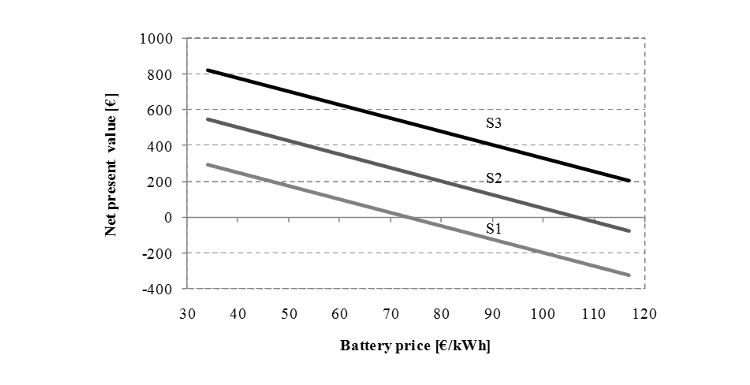
Fig. 31. Net present value for different scenarios and battery prices. 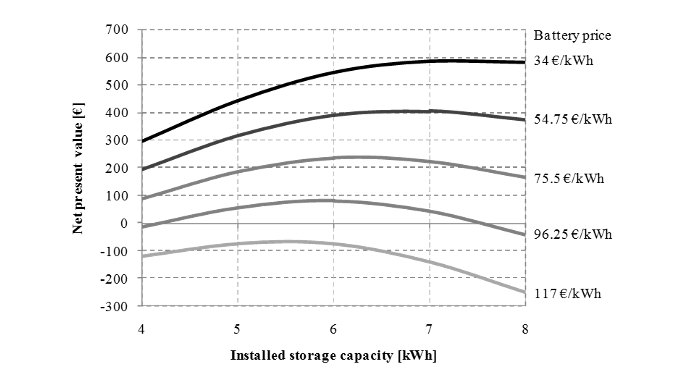
Fig. 12. Optimal storage size. 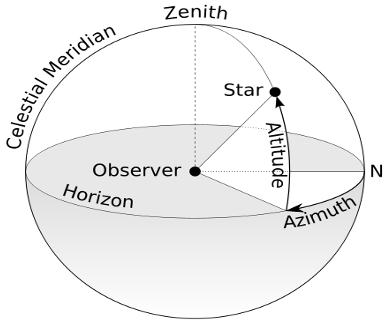
Fig. 7. Coherences between altitude, azimuth and the position. 
Fig. 2. Solar irradiation data in 2014. 
Fig. 13. Sensitivity analysis. 
Fig. 20. Development of the battery capacity and inner resistance over the examined time period of 10 years. ![Fig. 6. Topology of integrated PV-storage system [22].](/figures/fig-6-topology-of-integrated-pv-storage-system-22-32k9o93y.png)
Fig. 6. Topology of integrated PV-storage system [22]. 
Fig. 4. Electric load profiles for the transitional period. 
Fig. 3. Ambient air temperature in 2014. 
Figure 10 depicts the behavior of battery capacity and inner resistance over the examined period of ten years. The capacity starts at 80% of its beginning of life (BOL) value, as this is the remaining capacity at the time the battery is replaced in the electric vehicle. Over the second life the available capacity decreases to roughly 60% of its original capacity. At the same time the inner resistance increases from 150% to 320% of its BOL value. The increasing inner resistance results in a decrease of the efficiency due to power losses.

![Fig. 44. Comparison of (a) non grid-optimized; and (b) grid-optimized battery operating strategies. Source: [34], p.4.](/figures/fig-44-comparison-of-a-non-grid-optimized-and-b-grid-1iqi7law.webp)
![Fig. 1. System architecture. Source: adopted from [1], p.7.](/figures/fig-1-system-architecture-source-adopted-from-1-p-7-2rdd00s0.webp)


![Fig. 6. Topology of integrated PV-storage system [22].](/figures/fig-6-topology-of-integrated-pv-storage-system-22-32k9o93y.webp)


