scispace - formally typeset
Search or ask a question
Journal ArticleDOI

Establishing correlations of scalp field maps with other experimental variables using covariance analysis and resampling methods.

01 Jun 2008-Clinical Neurophysiology (Elsevier)-Vol. 119, Iss: 6, pp 1262-1270
TL;DR: Covariance mapping combined with bootstrapping methods has high statistical power and yields unique and directly interpretable results in EEG/MEG scalp data analysis.
About: This article is published in Clinical Neurophysiology.The article was published on 2008-06-01 and is currently open access. It has received 45 citations till now. The article focuses on the topics: Covariance & Resampling.

Summary (2 min read)

1. Introduction

  • Technical improvements have made it possible that in EEG/MEG and ERP/ERF experiments, the number of sensors on the scalp could be substantially increased.
  • In many studies, the statistical approaches chosen to analyze multi-channel scalp field data do not take the relations between sensors properly into account and disregard the physical basis of the signals to be analyzed.
  • The additional information obtained with higher spatial sampling is thus often poorly exploited by the statistics applied.
  • In terms of statistics of EEG/MEG and ERP/ERF data, this implies that the basic entity for analysis should be the scalp electric field.
  • By repeating this randomization many times, one can therefore obtain a good estimate of the distribution of the total map difference under the null hypothesis.

2. Methods

  • Bold symbols denote a column vector or matrix and non-bold symbols, a scalar magnitude.
  • When inter-subject covariance is modeled, 1980) .
  • In the Fisher transformed distribution of r * , the so-called studentized bootstrap confidence intervals are constructed from the bootstrap replicates (see Davison and Hinkley, 1997 for details).
  • The TANOVA is thus similar to the ANOVA in the sense that it used categorical independent variables, while the present method is similar to the ANCOVA by using one continuous independent variable.

3. Simulations

  • The random map was multiplied by the random external variable to obtain simulated data that are compatible with the model outlined in formula (4).
  • Using these noisy random simulated data and the random external variable, the p-value was computed for each simulation run.
  • For each step of the SNR ratio, 500 simulations were computed, each with 500 randomization runs.
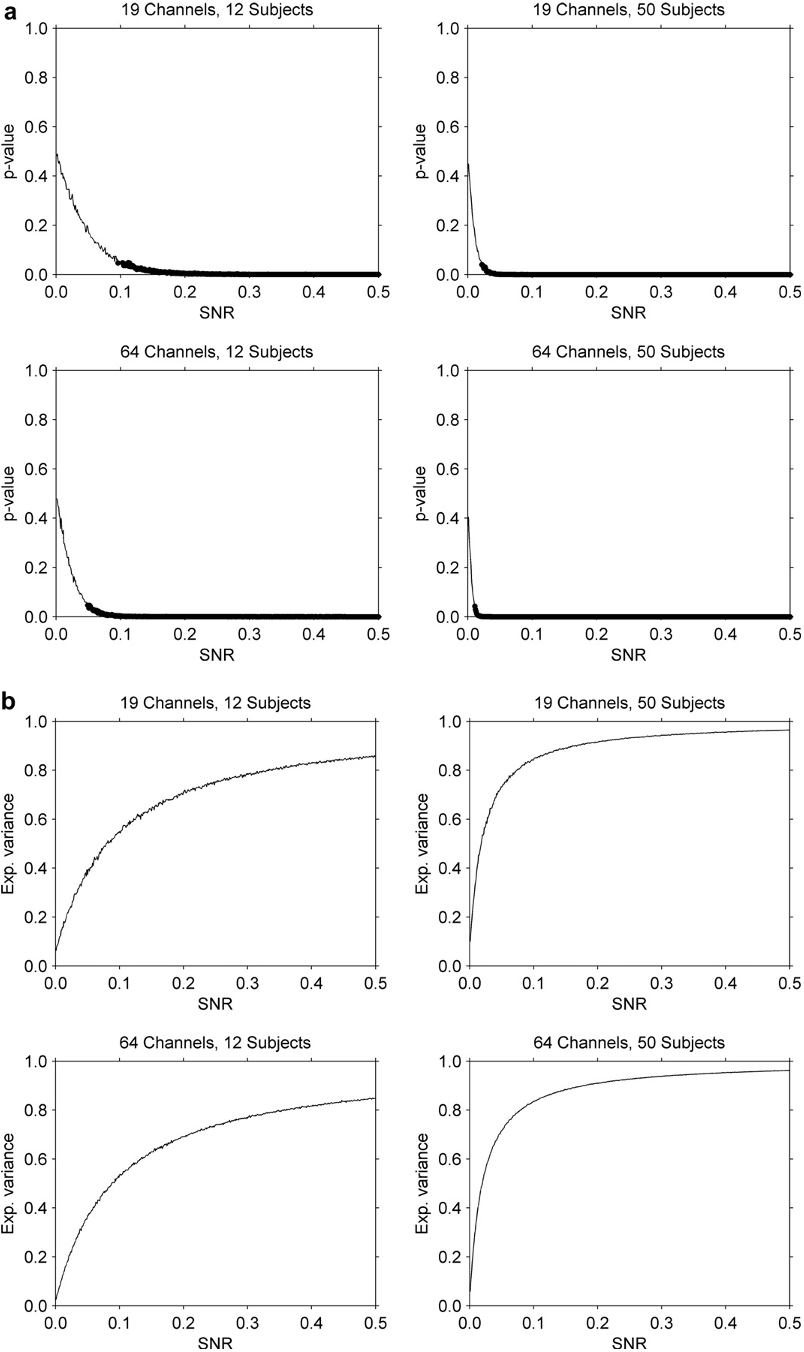
  • The graphs of the mean p-values and the mean r 2 -values against the SNR are shown in Fig. 1 .
  • The figure indicates that with 12 subjects and 19 channels of EEG, significant (p < .05) effects can be detected at SNRs above about 10%.

4. Example

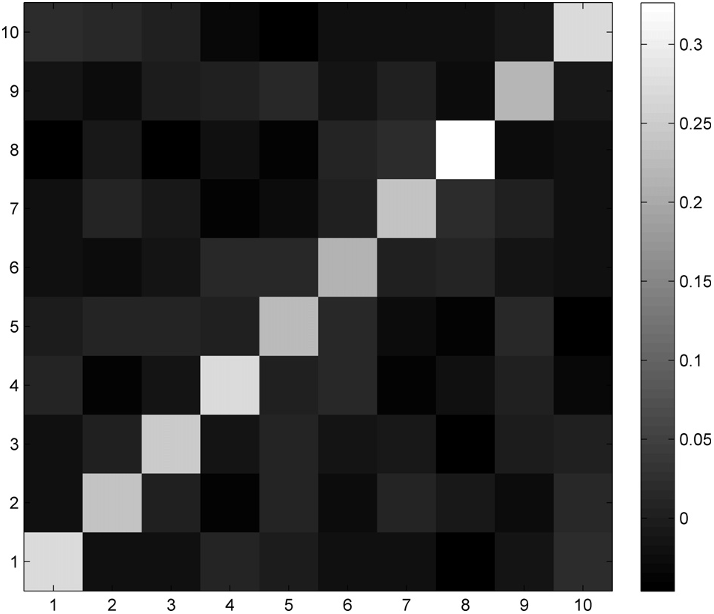
  • Seventy-four channel ERPs were collected in 10 English-speaking exchange students to Switzerland while reading single-German words.
  • The ERPs were collected after the students had spent about 3 months in Switzerland and had already acquired some proficiency in German.
  • The study was approved by the Canton of Bern's ethical committee.
  • The topography of the map series was correlated to a combined score of both language tests.
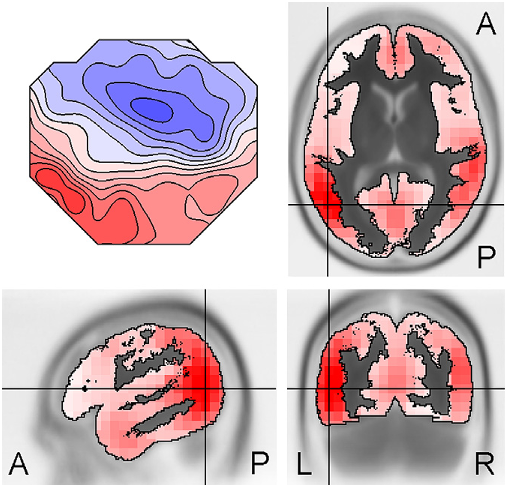
  • The covariance map at the most significant time point (448 ms post stimulus) is shown, together with a distributed inverse solution of that map (Fig. 2 ).

5. Discussion

  • The presented methodology provides an extension of the currently available methods for multi-channel randomization statistics of EEG and MEG topographies.
  • By limiting the number of external variables to one, no rotation of the covariance matrix is necessary, and the resulting covariance map remains directly interpretable in terms of intracerebral sources associated with the external variable.
  • By basing the analysis on a vector of scalp potentials that is scaled for each subject (Eq. 5), it is furthermore assumed that across subjects a common vector of scalp potentials corresponds to the same distribution and orientation of current density.
  • Since ERP averaging has produced an abundant mass of meaningful results and often served as the basis for the computation of convincing inverse solutions, the authors think that practically, this assumption is very plausible.

Did you find this useful? Give us your feedback

Figures (4)
Citations
More filters
Journal ArticleDOI
TL;DR: A functional dissociation was showed between two well-known ERP components: FN400 (Frontal N400, traditionally related to semantic processes) and LPC (Late Positive Complex, related to memory processes), which suggests this component is unrelated to familiarity processes and is only influenced by semantic differences between stimuli.
Abstract: Training readers to recognize pseudowords could decrease the processing differences between them and real words while clarifying the lexical acquisition processes. We analyze the effect of pseudoword repetition through the recording of EEG during a lexical decision task. Results showed a functional dissociation between two well-known ERP components: FN400 (Frontal N400, traditionally related to semantic processes) and LPC (Late Positive Complex, related to memory processes). On the one hand, FN400 was unaffected by pseudoword repetition and showed the typical lexicality effect. On the other hand, topographic and neural source analyses showed that LPC amplitude increased across repetitions, causing the lexicality effect to disappear, with the left inferior frontal, left superior temporal and right superior frontal gyri identified as the most likely neural sources. The lack of repetition effect on FN400 suggests that this component is unrelated to familiarity processes and is only influenced by semantic differences between stimuli. The LPC observations, however, reflect the construction and strengthening of visual memory traces for repeated pseudowords, facilitating their processing over the course of the task.

31 citations


Cites methods from "Establishing correlations of scalp ..."

  • ...TANCOVA, introduced by Koenig et al. (2008), was used to identify the significant time points in which global scalp field potentials for pseudoword covaried with the external variable repetition (six levels)....

    [...]

  • ...The covariance maps obtained with TANCOVA analysis represent a linear transformation of the original ERP topography, and hence can be directly submitted to source localization methods (Koenig et al. 2008; Pedroni et al. 2011)....

    [...]

  • ...To that end, we combined Topographical analysis of the covariance (TANCOVA) and Local Auto-Regressive Average (LAURA) source estimation methods (Koenig et al. 2008)....

    [...]

Journal ArticleDOI
TL;DR: Results indicate that value functions of experienced utility and regret disproportionally increase with monetary value, and thus contradict the compressing value function functions of decision utility.
Abstract: Economic theory distinguishes two concepts of utility: decision utility, objectively quantifiable by choices, and experienced utility, referring to the satisfaction by an obtainment. To date, experienced utility is typically measured with subjective ratings. This study intended to quantify experienced utility by global levels of neuronal activity. Neuronal activity was measured by means of electroencephalographic (EEG) responses to gain and omission of graded monetary rewards at the level of the EEG topography in human subjects. A novel analysis approach allowed approximating psychophysiological value functions for the experienced utility of monetary rewards. In addition, we identified the time windows of the event-related potentials (ERP) and the respective intracortical sources, in which variations in neuronal activity were significantly related to the value or valence of outcomes. Results indicate that value functions of experienced utility and regret disproportionally increase with monetary value, and thus contradict the compressing value functions of decision utility. The temporal pattern of outcome evaluation suggests an initial (∼250 ms) coarse evaluation regarding the valence, concurrent with a finer-grained evaluation of the value of gained rewards, whereas the evaluation of the value of omitted rewards emerges later. We hypothesize that this temporal double dissociation is explained by reward prediction errors. Finally, a late, yet unreported, reward-sensitive ERP topography (∼500 ms) was identified. The sources of these topographical covariations are estimated in the ventromedial prefrontal cortex, the medial frontal gyrus, the anterior and posterior cingulate cortex and the hippocampus/amygdala. The results provide important new evidence regarding "how," "when," and "where" the brain evaluates outcomes with different hedonic impact.

24 citations


Cites background or methods from "Establishing correlations of scalp ..."

  • ...These covariance maps were then used to compute, for each reward level, an electrophysiological index s i of reward using the following equation (Koenig et al. 2008): st,i e 1 m vi,t,e t,e, (3) and where s i is the mean of st,i across time....

    [...]

  • ...According to Koenig et al. (2008), a randomization procedure (5000 iterations) was used to identify at which time points of the ERP the global scalp field potentials significantly covaried with the previously determined best-fitting value function....

    [...]

  • ...This method of analysis introduced by Koenig et al. (2008) relies on the fact that ERP fields are additive....

    [...]

  • ...Using the GFP of this covariance map as an effect size allows testing time frame for time frame for significant covariation by applying randomization statistics as described by Koenig et al. (2008)....

    [...]

  • ...These covariance maps were then used to compute, for each reward level, an electrophysiological index s i of reward using the following equation (Koenig et al. 2008):...

    [...]

Journal ArticleDOI
TL;DR: In subjects with strong craving, the conflict reflected in the NoGo-N2 was enhanced in the alcohol-related context, which makes the successful inhibition of the urge to drink in high-risk situations even more difficult for this subgroup of patients and should be addressed in individualized treatment planning.
Abstract: Background Most contemporary neuroscientific models of alcohol use disorders (AUD) incorporate an imbalance between enhanced cue reactivity, which results in a strong urge to consume, and the impaired inhibitory control of that urge. While these phenomena have been frequently investigated separately, studies involving both aspects and thus precisely investigating the postulated imbalance are rare. In this study, inhibition was investigated in an addiction-specific context and individual craving levels were also examined. Methods This study compared inhibition in alcohol-related and neutral contexts in patients with AUD and healthy controls, while also taking into account the individual amount of craving. All subjects performed a Go/NoGo task involving neutral and alcohol-related NoGo trials, while their brain activity was recorded using multichannel electroencephalography. The map strength and topography of the N2 and P3 components of the NoGo event-related potentials were compared between groups and contexts using whole-scalp randomization-based methods. The effects of interest were further investigated with sLORETA source analysis. Results For the N2 component, the context by craving interaction was strong for map strength and map topography. The source analysis indicated that in subjects with high craving, alcohol-related context led to enhanced and prolonged activation in the posterior cingulate and premotor cortical areas. This interaction was specific for craving, but not for diagnostic classification. The amplitude of the P3 component was reduced in subjects with AUD, which replicated previous findings. Conclusions In subjects with strong craving, the conflict reflected in the NoGo-N2 was enhanced in the alcohol-related context. Such enhanced conflict probably makes the successful inhibition of the urge to drink in high-risk situations even more difficult for this subgroup of patients and should therefore be addressed in individualized treatment planning.

21 citations


Cites methods from "Establishing correlations of scalp ..."

  • ...…was analyzed: A topographic analysis of covariance (TANCOVA) establishes scalp field topographies that vary linearly with a continuous external predictor (e.g., the OCDS values) and tests these correlations for significance using bootstrapping and randomization statistics (Koenig et al., 2008)....

    [...]

  • ..., the OCDS values) and tests these correlations for significance using bootstrapping and randomization statistics (Koenig et al., 2008)....

    [...]

Journal ArticleDOI
TL;DR: Delinquents with ADHD symptomatology showed more beta power at frontal, central and parietal brain regions than nondelinquent subjects with ADHD symptoms, suggesting that excessive beta power may represent a risk factor for delinquent behavior in adults with ADHD symptatology.
Abstract: Background/Aims: The attention-deficit/hyperactivity disorder (ADHD) shows an increased prevalence in delinquents compared to the normal population. In recent studies, a subgroup of subjects with ADHD as well as a subgroup of delinquents displayed excessive electroencephalography (EEG) beta activity, which has been associated with antisocial behavior in ADHD children. We investigated whether delinquent behavior in adults with ADHD symptomatology is related to excessive beta activity. Methods: We compared the resting state EEGs (eyes open/closed) of delinquent and nondelinquent subjects with ADHD symptoms and those of a control group regarding EEG power spectra and topography. Results: Delinquents with ADHD symptomatology showed more beta power at frontal, central and parietal brain regions than nondelinquents with ADHD symptoms. Conclusion: Excessive beta power may thus represent a risk factor for delinquent behavior in adults with ADHD symptomatology. The awareness of such a risk factor may be helpful in the assessment of the risk for delinquent behavior in a psychiatric context and may provide a neurobiological background for therapeutic interventions. © 2014 S. Karger AG, Basel

20 citations

Book ChapterDOI
01 Jul 2009
TL;DR: In this article, a comprehensive introduction to the display and quantitative characterization of scalp field data is given, and different approaches for comparing scalp fields are described, which can be interpreted in terms of differences of intracerebral sources either in strength, or in location and orientation.
Abstract: The present chapter gives a comprehensive introduction into the display and quantitative characterization of scalp field data After introducing the construction of scalp field maps, different interpolation methods, the effect of the recording reference and the computation of spatial derivatives are discussed The arguments raised in this first part have important implications for resolving a potential ambiguity in the interpretation of differences of scalp field data In the second part of the chapter different approaches for comparing scalp field data are described All of these comparisons can be interpreted in terms of differences of intracerebral sources either in strength, or in location and orientation in a nonambiguous way In the present chapter we only refer to scalp field potentials, but mapping also can be used to display other features, such as power or statistical values However, the rules for comparing and interpreting scalp field potentials might not apply to such data Generic form of scalp field data Electroencephalogram (EEG) and event-related potential (ERP) recordings consist of one value for each sample in time and for each electrode The recorded EEG and ERP data thus represent a two-dimensional array, with one dimension corresponding to the variable “time” and the other dimension corresponding to the variable “space” or electrode Table 21 shows ERP measurements over a brief time period The ERP data (averaged over a group of healthy subjects) were recorded with 19 electrodes during a visual paradigm The parietal midline Pz electrode has been used as the reference electrode

20 citations

References
More filters
Book
01 Jan 1993
TL;DR: This article presents bootstrap methods for estimation, using simple arguments, with Minitab macros for implementing these methods, as well as some examples of how these methods could be used for estimation purposes.
Abstract: This article presents bootstrap methods for estimation, using simple arguments. Minitab macros for implementing these methods are given.

37,183 citations

Book
28 Oct 1997
TL;DR: In this paper, a broad and up-to-date coverage of bootstrap methods, with numerous applied examples, developed in a coherent way with the necessary theoretical basis, is given, along with a disk of purpose-written S-Plus programs for implementing the methods described in the text.
Abstract: This book gives a broad and up-to-date coverage of bootstrap methods, with numerous applied examples, developed in a coherent way with the necessary theoretical basis. Applications include stratified data; finite populations; censored and missing data; linear, nonlinear, and smooth regression models; classification; time series and spatial problems. Special features of the book include: extensive discussion of significance tests and confidence intervals; material on various diagnostic methods; and methods for efficient computation, including improved Monte Carlo simulation. Each chapter includes both practical and theoretical exercises. Included with the book is a disk of purpose-written S-Plus programs for implementing the methods described in the text. Computer algorithms are clearly described, and computer code is included on a 3-inch, 1.4M disk for use with IBM computers and compatible machines. Users must have the S-Plus computer application. Author resource page: http://statwww.epfl.ch/davison/BMA/

6,420 citations

Journal ArticleDOI
TL;DR: The standard nonparametric randomization and permutation testing ideas are developed at an accessible level, using practical examples from functional neuroimaging, and the extensions for multiple comparisons described.
Abstract: Requiring only minimal assumptions for validity, nonparametric permutation testing provides a flexible and intuitive methodology for the statistical analysis of data from functional neuroimaging experiments, at some computational expense. Introduced into the functional neuroimaging literature by Holmes et al. ([1996]: J Cereb Blood Flow Metab 16:7-22), the permutation approach readily accounts for the multiple comparisons problem implicit in the standard voxel-by-voxel hypothesis testing framework. When the appropriate assumptions hold, the nonparametric permutation approach gives results similar to those obtained from a comparable Statistical Parametric Mapping approach using a general linear model with multiple comparisons corrections derived from random field theory. For analyses with low degrees of freedom, such as single subject PET/SPECT experiments or multi-subject PET/SPECT or fMRI designs assessed for population effects, the nonparametric approach employing a locally pooled (smoothed) variance estimate can outperform the comparable Statistical Parametric Mapping approach. Thus, these nonparametric techniques can be used to verify the validity of less computationally expensive parametric approaches. Although the theory and relative advantages of permutation approaches have been discussed by various authors, there has been no accessible explication of the method, and no freely distributed software implementing it. Consequently, there have been few practical applications of the technique. This article, and the accompanying MATLAB software, attempts to address these issues. The standard nonparametric randomization and permutation testing ideas are developed at an accessible level, using practical examples from functional neuroimaging, and the extensions for multiple comparisons described. Three worked examples from PET and fMRI are presented, with discussion, and comparisons with standard parametric approaches made where appropriate. Practical considerations are given throughout, and relevant statistical concepts are expounded in appendices.
5,777 citations


"Establishing correlations of scalp ..." refers methods in this paper

  • ...Alternatively, one may employ techniques for the correction of multiple comparisons that are commonly employed in functional neuroimaging (Nichols and Holmes, 2002; Carbonell et al., 2004)....

    [...]

Journal ArticleDOI
11 Jan 1980-Science
TL;DR: In a sentence reading task, words that occurred out of context were associated with specific types of event-related brain potentials that elicited a late negative wave (N400).
Abstract: In a sentence reading task, words that occurred out of context were associated with specific types of event-related brain potentials. Words that were physically aberrant (larger than normal) elecited a late positive series of potentials, whereas semantically inappropriate words elicited a late negative wave (N400). The N400 wave may be an electrophysiological sign of the "reprocessing" of semantically anomalous information.

4,226 citations


"Establishing correlations of scalp ..." refers background in this paper

  • ...The figure indicates that effects of language proficiency are found in a time window that has often been associated with language processing (Kutas and Hillyard, 1980)....

    [...]

Journal ArticleDOI
TL;DR: It is shown that modern EEG source imaging simultaneously details the temporal and spatial dimensions of brain activity, making it an important and affordable tool to study the properties of cerebral, neural networks in cognitive and clinical neurosciences.

1,600 citations


"Establishing correlations of scalp ..." refers methods in this paper

  • ...Second, the accuracy of EEG/MEG and ERP/ERF inverse solution improves significantly when high-density electrode arrays are being used (see Michel et al., 2004, for a review)....

    [...]

Frequently Asked Questions (5)
Q1. What contributions have the authors mentioned in the paper "Establishing correlations of scalp field maps with other experimental variables using covariance analysis and resampling methods" ?

The authors introduce a procedure to identify spatially extended scalp fields that correlate with some external, continuous measure ( reaction-time, performance, clinical status ) and to test their significance. The authors formally deduce that the channel-wise covariance of some experimental variable with scalp field data directly represents intracerebral sources associated with that variable. The authors furthermore show how the significance of such a representation can be tested with resampling techniques. The introduced methodology overcomes some of the ‘ traditional ’ statistical problems in EEG/MEG scalp data analysis. In a sample analysis of real data, the authors found that foreign-language evoked ERP data were significantly associated with foreign-language proficiency. 

Seventy-four channel ERPs were collected in 10 English-speaking exchange students to Switzerland while reading single-German words. 

The amplitudes of the estimated covariance map b depend on the variance of V, on the variance of X, and on the strength of the relation between V and X. 

In order to establish the statistical significance of such difference maps, one can either use the standard multivariate statistical approaches such as MANOVA (Vasey and Thayer, 1987). 

Increasing the number of subjects or electrodes improves the sensitivity of the method, and effects can be detected at lower SNRs.