
All figures (46)
 Table 7. Variation of measured wave height at WP3 and impact pressures around the forward and aft columns using four repeated runs.
 Figure 29. Pressure contours for condition 5 (Hinput = 201.6 mm, Tinput = 1.163 s) using mesh level 3 and compressible air. Time instances (a) – (d) are shown in Figure 28.
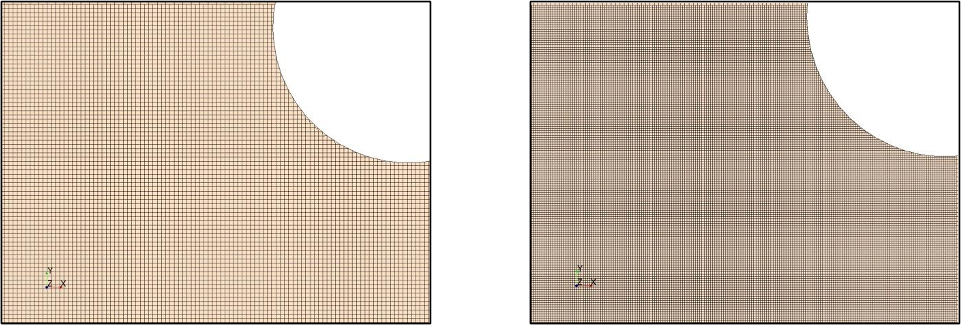 Figure 15. Snapshots showing local refinement of surface mesh at the deck underside near the aft column: reference mesh, level 1 (left); fine mesh, level 2 (right).
 Figure 10. Resulting wave-in-deck pressures around the aft column (PT#14 – PT#16) using four repeated runs (Hmeas. = 219.60 mm, Tmeas. = 1.52 s).
 Figure 25. Time history of CFD results for tendon tensions in the up-wave and down-wave tendons and the simultaneous vertical wave-in-deck force, Fz: for condition 3 (top); for condition 5 (middle); for condition 8 (bottom).
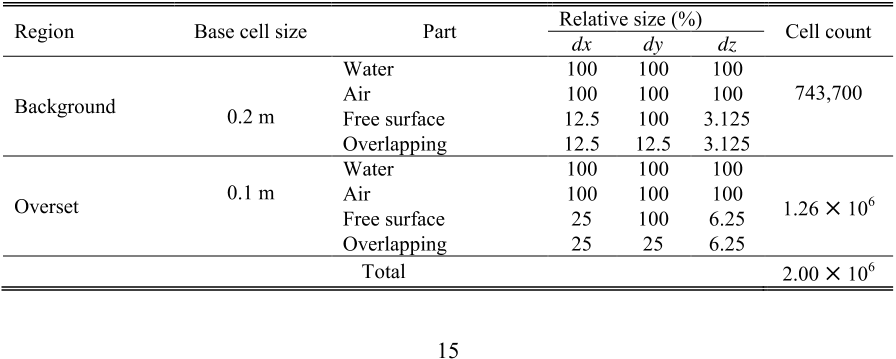 Table 10. Mesh size details in the background and overset regions.
 Table 9. Domain size for the background and overset regions and overlapping zone.
 Table 14. Summary of maximum and minimum tensions in the up-wave and down-wave tendons for all conditions.
 Figure 19. Results of sensitivity analysis of maximum pressure at the deck underside due to air compressibility using mesh level 3 for condition 5 (Hinput = 201.6 mm, Tinput = 1.163 s, S = 0.095): time history of multiple wave-in-deck impact events (left); time history of a single wave-in-deck impact event (right).
 Figure 30. Time history of wave-in-deck pressure at PT#16 obtained by experiments and CFD for Condition 5 (Hinput = 201.6 mm, Tinput = 1.163 s).
![Figure 2. Profile view showing sketch definition of wave and the model setup at the AMC towing tank [not to scale]. The adjustment of pretension for each leg was performed through a turnbuckle connected to the tank side.](/figures/figure-2-profile-view-showing-sketch-definition-of-wave-and-doxigbzt.png) Figure 2. Profile view showing sketch definition of wave and the model setup at the AMC towing tank [not to scale]. The adjustment of pretension for each leg was performed through a turnbuckle connected to the tank side.
Figure 2. Profile view showing sketch definition of wave and the model setup at the AMC towing tank [not to scale]. The adjustment of pretension for each leg was performed through a turnbuckle connected to the tank side. Table 2. Location of wave probes used in the model tests with respect to the model’s initial centroid.
 Figure 22. Comparison of CFD and experimental results for condition 3 (Hinput = 220 mm, Tinput = 1.52 s): surge motion (top); tension in the up-wave tendon (middle); tension in the down-wave tendon (bottom).
 Figure 1. Photograph showing the TLP model prior to model tests.
 Figure 11. Variation of impact pressures measured by sixteen pressure transducers (Hmeas. = 218.8 mm, Tmeas. = 1.52 s): boxplots (top); coefficient of variation, CV (bottom).
 Table 16. Effect of platform set-down on the dynamic air gap.
 Table 15: Measured leg pretension (To) and its ratio to the leg pretension using in CFD models (To = 31.60 N).
 Figure 6. Time history of measured wave elevation of a single wave for condition 2 (Hinput = 200 mm, Tinput = 1.52 s) using four repeated runs: wave probe WP4 at LE (top); wave probe WP5 at TE (bottom).
 Table 6. Variation of measured wave elevations at WP4 and WP5 and tension in the up-wave tendon (Leg#1) and down-wave tendon (Leg#4) using four repeated runs.
 Table 5. Variation of measured wave elevations at WP3 and surge motion using four repeated runs.
 Figure 26. Time history of CFD results for a single wave-in-deck event and the associated tendon tensions in the up-wave and down-wave tendons for condition 5: Hinput = 201.6 mm, Tinput = 1. 163 s.
 Figure 14. Snapshot at xz plane showing mesh distribution near the TLP model.
 Figure 5. Time history of measured wave elevation of a single wave for condition 2 (Hinput = 200 mm, Tinput = 1.52 s) using four repeated runs: wave probe WP3 (top); surge motion (bottom).
 Figure 7. Time history of measured tension using four repeated runs (Hinput = 200 mm, Tinput = 1.52 s): up-wave tendon (top); down-wave tendon (bottom).
 Figure 18. Results of sensitivity analysis of maximum pressure at the deck underside due to mesh density for condition 5 (Hinput = 201.6 mm, Tinput = 1.163 s, S = 0.095): time history of multiple wave-in-deck impact events (left); time history of a single wave-in-deck impact event (right).
 Figure 17. Comparisons between CFD and theoretical solutions of wave elevation along the computational domain for condition 3 (Hinput = 220 mm, Tinput = 1.52 s, S = 0.061): at time = one wave period (top); at time = three wave periods (middle); at time = six wave periods (bottom).
 Table 8. Relative mesh size to the base cell size of 0.2 m used for numerical wave tank during wave generation tests.
 Figure 27. Snapshots at different time instances showing an extreme wave impact on the TLP model at the towing tank (left) and using CFD simulations (right): (a) no wave (still-water) condition; (b) wave run-up on the forward columns; (c) wave impact on the deck underside; (d) wave impact on the aft section of deck underside and water overtopping on the aft columns. Condition 5 (Hinput = 201.6 mm, Tinput = 1.163 s).
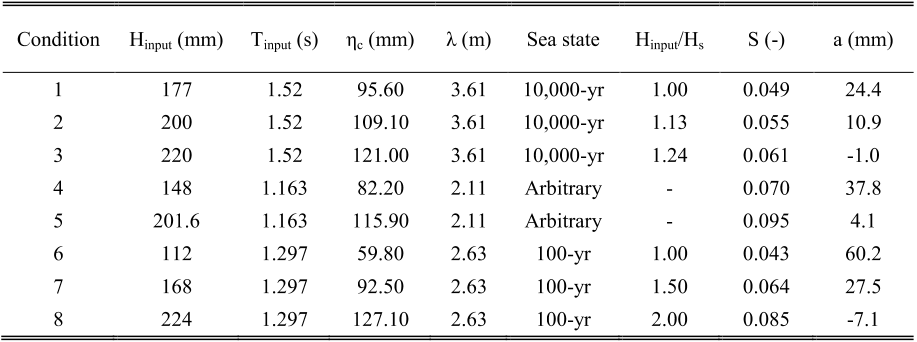 Table 4. Input wave parameters of wave conditions tested in towing tank.
 Table 3. Sea state selected for model tests.
 Figure 12. Numerical wave tank used in CFD simulations during wave generation without the model in-place.
 Figure 8. FFT results of tendon tensions using four repeated runs corresponding to the time history shown in Figure 7 for condition 2 (Hinput = 200 mm, Tinput = 1.52 s): up-wave tendon (top); down-wave tendon (bottom).
 Figure 21. Comparison of CFD and experimental results for condition 2 (Hinput = 200 mm, Tinput = 1.52 s): surge motion (top); tension in the up-wave tendon (middle); tension in the down-wave tendon (bottom).
 Figure 23. Time history of heave motion predicted by CFD and the estimated set-down by measurements: for condition 2 (top); for condition 3 (bottom).
 Table 11. Under-relaction factors (URF) used in numerical simulations.
 Table 12. Levels of local mesh refinement at the deck underside relative to the base cell size of overset region (0.10 m).
 Figure 4. Plan view of the deck underside showing the distribution of pressure transducers (PT).
 Figure 16. Results of wave height (H) predicted by CFD to Hinput versus wave steepness at different locations along the computational domain. Mesh size: λ/dx > 20 and Hinput/dz > 80.
![Figure 13. A sketch showing overlapping between background and overset regions: plan view (top); side view (bottom) [not to scale].](/figures/figure-13-a-sketch-showing-overlapping-between-background-1bra40y3.png) Figure 13. A sketch showing overlapping between background and overset regions: plan view (top); side view (bottom) [not to scale].
Figure 13. A sketch showing overlapping between background and overset regions: plan view (top); side view (bottom) [not to scale]. Figure 28. Time history of maximum pressure at the deck underside computed using mesh level 3 with compressible air for condition 5 (Hinput = 201.6 mm, Tinput = 1.163 s).
 Figure 9. Resulting wave-in-deck pressures around the forward column (PT#1 – PT#3) using four repeated runs (Hmeas. = 219.60 mm, Tmeas. = 1.52 s).
![Figure 3. Plan view of the AMC towing tank showing the distribution of wave probes (WP): during wave calibration (top); during wave impact tests with the TLP model in-place (bottom) [not to scale].](/figures/figure-3-plan-view-of-the-amc-towing-tank-showing-the-2f0e18f0.png) Figure 3. Plan view of the AMC towing tank showing the distribution of wave probes (WP): during wave calibration (top); during wave impact tests with the TLP model in-place (bottom) [not to scale].
Figure 3. Plan view of the AMC towing tank showing the distribution of wave probes (WP): during wave calibration (top); during wave impact tests with the TLP model in-place (bottom) [not to scale]. Figure 24. Comparison of CFD and experimental results: maximum amplitude of surge motion (top); maximum and minimum tension (Tmax and Tmin) in the up-wave tendon, Leg#1 (middle); maximum and minimum tension (Tmax and Tmin) in the down-wave tendon, Leg#4 (bottom).
 Table 13. Damped natural periods of the TLP model obtained by model tests and CFD.
 Table 1. Key principles for SNORRE-A TLP at full and model scales.
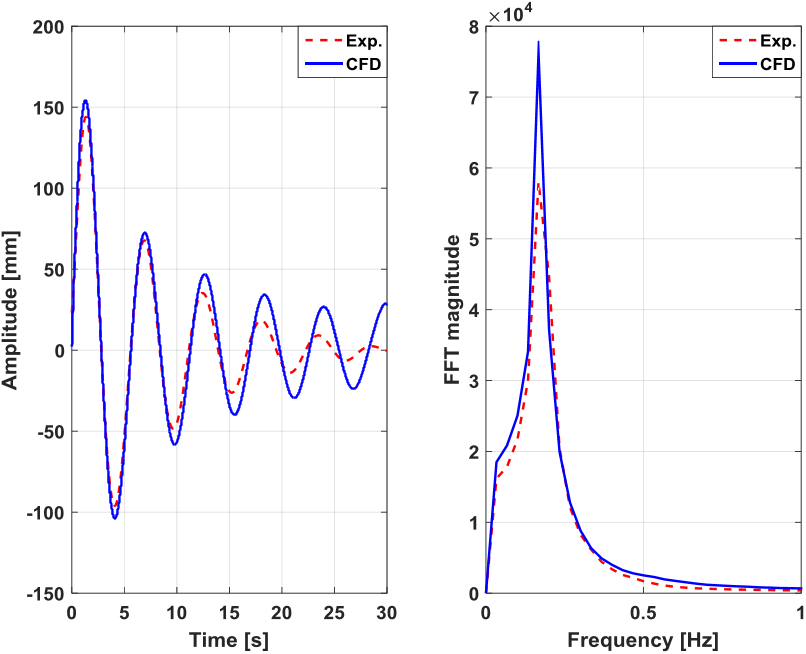 Figure 20. Free decay test results of CFD and experiments for surge motion: time history (left); FFT results (right).


![Figure 2. Profile view showing sketch definition of wave and the model setup at the AMC towing tank [not to scale]. The adjustment of pretension for each leg was performed through a turnbuckle connected to the tank side.](/figures/figure-2-profile-view-showing-sketch-definition-of-wave-and-doxigbzt.webp)


![Figure 13. A sketch showing overlapping between background and overset regions: plan view (top); side view (bottom) [not to scale].](/figures/figure-13-a-sketch-showing-overlapping-between-background-1bra40y3.webp)


![Figure 3. Plan view of the AMC towing tank showing the distribution of wave probes (WP): during wave calibration (top); during wave impact tests with the TLP model in-place (bottom) [not to scale].](/figures/figure-3-plan-view-of-the-amc-towing-tank-showing-the-2f0e18f0.webp)


