scispace - formally typeset
Search or ask a question
Journal ArticleDOI

File popularity characterisation

01 Mar 2000-Vol. 27, Iss: 4, pp 45-50
TL;DR: It is shown that locality can be characterised with a single parameter, which primarily varies with the topological position of the caches, and is largely independent of the culture of the cache users.
Abstract: A key determinant of the effectiveness of a web cache is the locality of the files requested. In the past this has been difficult to model, as locality appears to be cache specific. We show that locality can be characterised with a single parameter, which primarily varies with the topological position of the cache, and is largely independent of the culture of the cache users. Accurate cache models can therefore be built without any need to consider cultural effects that are hard to predict.

Summary (2 min read)

1. Introduction.

  • WWW caching has proved a valuable technique for scaling up the internet [ABR95, BAE 97].
  • This would be useful because previous observations of Zipf’s law have been largely culture independent, and if some culture independent cache metrics could be established cache models would not need to take account of cultural effects.
  • It is not at all clear that cache logs reflect human choices, since not all of a user’s web requests reach the network cache.
  • Derived from the literature and their own imagination, and propose tests of the explanations.the authors.

2. Theories.

  • One possible hypothesis (derived from a related proposal by Zipf [ZIP49]) is that caches at different levels of the hierarchy have different exponents for best-fit power laws, and caches higher up the hierarchy would have smaller exponents.
  • This is because requests for more popular files are reduced more than requests for less popular files, since only the first request for a file from a low level cache reaches a high level cache.
  • This can be tested by accurately determining the exponent for a range of caches, at the same position in the hierarchy, and finding a correlation between exponent and size.
  • If the behaviour of individuals is strongly correlated (e.g. by information waves) on a range of timescales with an infinite variance, then the popularity curve exponent will exhibit variation regardless of sample size or timescale.
  • From consideration of the work of Zipf on word use in different cultures, it seems likely that cultural differences will often be expressed through differences in the K factor in the power curve rather than the exponent.

3. Techniques.

  • To analyse file popularity, cache logs are usually needed, the only alternative being the correctly processed output from such a cache log.
  • The authors are indebted to several sources for making their logs available, and hope this is fully shown in the acknowledgements.
  • At the moment cache logs do not contain the means to discriminate between the physical request made by the client and files that are requested by linkage (linked image file, redirections etc) to the requested files.
  • Another analysis irregularity is that some researchers look at the popularity of generic hosts and not files.
  • The quality of the fit was checked using the standard R2 test.

4. Variability of Locality.

  • In order to compare data from different caches reliably it is necessary to ensure that differences are real and not due to insufficiently large samples.
  • This cache receives about 10000 requests per day from a research community.
  • The least squares procedure can then be used to find the slope of the line with best fit.
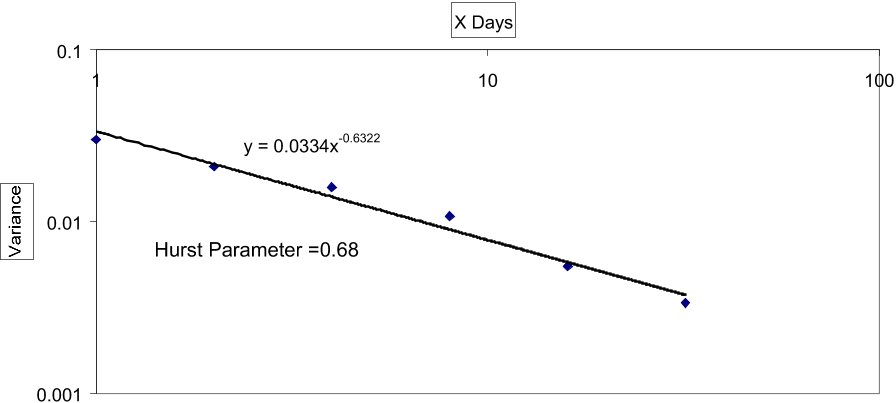
  • If the data shows longrange dependence the sample size required to get a reliable estimate of the slope of the popularity curve will be considerably larger than might be expected for normal Poisson statistics.
  • The exponent converges to a stable value for samples of 300 000 or more requests, for all the caches the authors have analysed.

5. Analysis.

  • The authors have been able to obtain samples in excess of 500000 file requests for 5 very different caches.
  • The authors show in figures 7 and 8 the popularity curves for these caches, and the curves fitted to the data using the techniques outlined in section 3.
  • In table 1 the authors show the estimated value of the exponent in the power law, together with the error interval and the confidence limit established by the R2 test.
  • FUNET and Spain are national caches, RMPLC and PISA are local caches serving very different communities.
  • Error estimates were calculated using several methods, the ones shown were the largest calculated.

6. Discussion.

  • The data in section 5 supported the notion that the variation in cache popularity curves is simply due to the hierarchical position of the cache.
  • Figure 9 shows cache size plotted against exponent.
  • It is hard to imagine a user community more different from the undergraduates, lecturers and researchers at Pisa university.
  • The lack of significant differences between caches at similar apparent levels in the hierarchy means that client effect are not significant either.
  • These models require an accurate description of real cache behavior so their performance can be accurately assessed.

7. Conclusion.

  • The analysis of cache popularity curves requires careful definition of what is to be analysed and, since the data displays significant long range dependency, very large sample sizes.
  • Further data should be analysed to fully confirm the relative independence of the metric.
  • The authors would like to thank Pekka Järveläinen for supplying us with anonymised logs for the Funet proxy cache, Simon Rainey , Javier Puche (Centro Superior de Investigaciones Cientificas) and Luigi Rizzo (Pisa).
  • 'On the implications of Zipf's Law for web caching'. in 3W3Cache Workshop, Manchester, June 1998. [CUN95] C Cunha, A Bestavros, and M Crovella.

Did you find this useful? Give us your feedback

Content maybe subject to copyright    Report

File Popularity Characterisation.
Chris Roadknight, Ian Marshall and Deborah Vearer
BT Research Laboratories, Martlesham Heath, Ipswich, Suffolk, UK. IP5 7RE
{roadknic,marshall}@drake.bt.co.uk
D.A.Vearer@uea.ac.uk
Abstract
A key determinant of the effectiveness of a web cache is the locality of the files
requested. In the past this has been difficult to model, as locality appears to be cache
specific. We show that locality can be characterised with a single parameter, which
primarily varies with the topological position of the cache, and is largely independent of
the culture of the cache users. The accurate determination of the parameter requires large
samples. This is due to a large timescale, long range dependency in the user requests.
1. Introduction.
WWW caching has proved a valuable technique for scaling up the internet [ABR95, BAE
97]. Caches can bring files nearer the client (with a possible reduction in latency), reduce
load on servers and add missing robustness to a distributed system such as the web. A
cache’s usefulness is directly related to the degree of locality shown in the files it serves,
where locality refers to the tendency of users to request access to the same files. The
locality is best illustrated using a popularity curve, which plots the number of requests for
each file against the file’s popularity ranking. It is often said that this popularity curve
follows Zipf's law, Popularity = K* ranking
-a
, with a being close to 1 (e.g. [CUN95]);
others argue that the curve does not follow Zipf's law [ALM98]. Zipf's law has been
observed in several environments where human choice is involved, including linguistic
word selection [ZIP49] and choice of habitat [MAR98b], so there is an expectation that
some measures of file popularity should follow Zipf’s law too. This would be useful
because previous observations of Zipf’s law have been largely culture independent, and if
some culture independent cache metrics could be established cache models would not
need to take account of cultural effects. However, it is not at all clear that cache logs
reflect human choices, since not all of a user’s web requests reach the network cache.
Some of the user’s requests are intercepted on the user’s client, by the cache maintained
by the browser. In addition it is hard to establish whether logged requests are user
initiated or are the result of embedded object links. The 'Zipf / not Zipf' argument is not
helped by the notion that a curve follows Zipf's law if the exponent is close to unity, with
the precise meaning of 'close' being vague. In fact (e.g. fig. 1) the observed popularity
curves vary significantly. In order to use the observations in a predictive model, it is
necessary to link the variations to features of the caches. That is, we must attempt to
explain the differences in terms of measurable parameters. In this paper we present a set
of possible explanations of the variance, derived from the literature and our own

imagination, and propose tests of the explanations. We have performed some of the tests
by analysing a wide variety of caches, and have thereby eliminated some of the theories.
We argue (along with another recent, submitted study [BRE98]) that popularity curves
are more accurately modelled by a power law curve with a fitted, negative exponent that
is not usually -1. We show in this paper, and elsewhere [ROA98], that even for this
model to be meaningful, the definitions of what is to be plotted, the sample size, and the
fit must be made carefully and precisely. We demonstrate for the first time in this paper
that, with appropriate care in the analysis, it can be shown that whilst the power law
curves are not strictly Zipf curves they are still culture independent.
0
20
40
60
80
100
120
1234567891011121314151617181920
Popularity ranking (1=Most Popular)
Zipf's Law
ACT (Aus)
Swinburne (Aus)
Edinburgh
HGMP
Korea
Le Trobe
Figure 1. Scaled popularity curves at 6 caches.
2. Theories.
One possible hypothesis (derived from a related proposal by Zipf [ZIP49]) is that caches
at different levels of the hierarchy have different exponents for best-fit power laws, and
caches higher up the hierarchy would have smaller exponents. This is due to a filtering
effect of intervening caches. Requests to NLANR, for example, might first go through a
browser, local, regional and/or national caches, each one serving some of the requests.
Unless there is a strong correlation between the time to live (ttl) allocated to a file and the
file’s popularity, this 'filtering' will be systematic. This is because requests for more
popular files are reduced more than requests for less popular files, since only the first
request for a file from a low level cache reaches a high level cache. If the filtering is
systematic there should be a reduction in the exponent observed (illustrated in figure 2).
Figure 2 also shows that there would be no change in power law exponent if the filtering
was in a 'per request' manner (which would be obtained if ttl was inversely proportional
to popularity). Seeking a negative correlation between the hierarchical position of
caches, and the fitted exponent can test this hypothesis.

y = 100x
-1
y = 80x
-1
y = 82.607x
-0.9103
10
100
1 10
Ranking
……. Original Requests
_
___
_
_ Stochastic filtering
_
_ _ Popularity
dependent filtering.
Figure 2. The possible effects of cache filtering
While filtering is one possible factor affecting the exponent of the locality curve, other
factors possibly influence the exponent. Possible reasons for differences in power law
exponent include:
a. Size of the cache. It has been proposed [BRE98b] that larger caches (i.e. Caches
with more requests per day) should have smaller exponents. This can be tested by
accurately determining the exponent for a range of caches, at the same position in the
hierarchy, and finding a correlation between exponent and size. Taking progressively
larger samples from a single cache is not a good test since, as we show below,
popularity data is highly bursty and small samples of less than 500000 requests
provide unreliable results
b. The nature of client. Clients that have large caches will filter requests more than
clients with small caches. As the size of the client cache depends on the available
disk space, and the disk space is roughly inversely proportional to the age of the
computer, areas tending to have newer computers may have lower exponents. So a
cache serving an industrial lab should have a lower exponent than a cache serving
publicly funded schools.
c. Number of days that the data is collected over. It is possible that the popularity
curve only approaches stability assymptotically. If the behaviour of individuals is
strongly correlated (e.g. by information waves) on a range of timescales with an
infinite variance, then the popularity curve exponent will exhibit variation regardless
of sample size or timescale. On the other hand if the correlation is only at bounded
timescales the exponent will be stable only at timescales larger than the bound. If the
behaviour of individual users is only weakly correlated, but has a bounded
autocorrelation (e.g. fractional Gaussian statistics), then the exponent should be stable
at large sample size regardless of timescale.

d. Cultural differences between user communities. Popularity curves are a reflection
in user behavior, so differences in this behavior should be reflected in the data
[ALM98]. From consideration of the work of Zipf on word use in different cultures,
it seems likely that cultural differences will often be expressed through differences in
the K factor in the power curve rather than the exponent. If the exponent is
significantly affected by cultural factors then the variation should not be explicable by
any obvious cache metrics. This can be tested by using caches which are similar in
size and topological position, and demonstrating inexplicable variation in the
exponent of the popularity curve
3. Techniques.
To analyse file popularity, cache logs are usually needed, the only alternative being the
correctly processed output from such a cache log. We are indebted to several sources for
making their logs available, and hope this is fully shown in the acknowledgements. We
have analysed cache logs from several sources including:
NLANR-lj, a high-level cache serving other caches worldwide
RMPLC, a cache serving schools in the UK
FIN, a cache serving Finnish Universities and academic institutions
SPAIN, a cache serving most of the universities and polytechnics of Spain
PISA, a cache serving the computer science department of Pisa University, Italy
Processed statistics are also available via web pages. We have used published logs from:
HGMP (Human Genome Mapping Project) used by scientists working on the HGMP
project in the U.K.
ACT, Swinburne, Letrobe, Caches serving academic communities in Australia
The range of logs we have looked contain different proportions of academic and home
usage. This is of importance because one possible reason for the variation between
caches could be the various usage styles at the caches.
Cache logs can be extremely comprehensive, detailing time of request, bytes transferred,
file name and other useful metrics [e.g. ftp://ircache.nlanr.net/Traces/]. It is inevitable
though, that they cannot contain every variable, that every researcher requires. At the
moment cache logs do not contain the means to discriminate between the physical request
made by the client and files that are requested by linkage (linked image file, redirections
etc) to the requested files. Some heuristic proposals have been made for filtering out
linked requests (e.g. only looking at HTML files [HUB98], filtering out file requests with
very close time dependencies [MAR98a]), but these inevitably introduce some error into
the analysis. Another analysis irregularity is that some researchers look at the popularity
of generic hosts and not files. We believe that the best approach is to accept that some
pages have embedded links and analyse all requests going through a cache, unlinked or

otherwise. The popularity curves in this paper were generated using all the logged
requests for files in the analysis period.
A simple, least squares method [TOP72] was used to fit power law curves to the data.
The quality of the fit was checked using the standard R
2
test. The least squares algorithm
did not initially fit the upper (most popular) part of the curve very well. The R
2
was
between 0.7 and 0.9 and the visual fit was poor (figure 3). In an effort to rectify this, a fit
on modified data was used [ZIP49]. This involved taking all the files that were requested
an identical number of times and averaging their ranking, in effect giving them all the
same ranking (which seems fairer). For example, if three files are requested 10 times
each and are ranked 100, 101 and 102, then one point would appear on the graph at
ranking = 101, popularity = 10. As can be seen in figure 3 this makes for a much tighter
visual fit. The improvement is confirmed by much higher R
2
values (table 1). The least
squares calculation could use a weighting for these averaged points, in proportion to the
number of files they represent, but with good R
2
values this seemed unnecessary.
y = 53.315x
-0.511
R
2
= 0.8302
y = 106.91x
-0.5872
R
2
= 0.9898
0.1
1
10
100
1000
1 10 100 1000 10000
Ranking
No of Requests
All Points
A verage Poi nt s
Pow er ( A l l Po i nt s )
Power (A verage Points)
Figure 3. Illustration of fit calculated by least squares algorithms
4. Variability of Locality.
In order to compare data from different caches reliably it is necessary to ensure that
differences are real and not due to insufficiently large samples. In order to establish the
variability of the fitted exponent we examined the popularity curve of one cache over a
long period of time. The cache we chose was the Human Genome Research Project
(HGMP) cache in the U.K [http://wwwcache.hgmp.mrc.ac.uk/]. This cache receives
about 10000 requests per day from a research community. They publish an access count
histogram that gives the number of objects accessed N times, this can be easily converted
in to a ranking vs. popularity graph. The least squares procedure can then be used to find
the slope of the line with best fit. This was carried out for six months of data from

Citations
More filters
Journal ArticleDOI
TL;DR: It is found that improvements in the caching architecture of the World Wide Web are changing the workloads of Web servers, but major improvements to that architecture are still necessary.
Abstract: This article presents a detailed workload characterization study of the 1998 World Cup Web site. Measurements from this site were collected over a three-month period. During this time the site received 1.35 billion requests, making this the largest Web workload analyzed to date. By examining this extremely busy site and through comparison with existing characterization studies, we are able to determine how Web server workloads are evolving. We find that improvements in the caching architecture of the World Wide Web are changing the workloads of Web servers, but major improvements to that architecture are still necessary. In particular, we uncover evidence that a better consistency mechanism is required for World Wide Web caches.

743 citations

01 Jan 2000
TL;DR: In this article, a detailed workload characterization study of the 1998 World Cup Web site is presented, showing that improvements in the caching architecture of the World Wide Web are changing the workloads of Web servers, but major improvements to that architecture are still necessary.
Abstract: This article presents a detailed workload characterization study of the 1998 World Cup Web site. Measurements from this site were collected over a three-month period. During this time the site received l .35 billion re uests, making this the largest throu h comparison with existing characterization studies, we are able to determinelow W eb server workloads are evolving. We find that improvements in the caching architecture of the World Wide Web are changing the workloads of Web servers, but major im rovements to that architecture are still necessary. In particular, we uncover evilence that a better consistency mechanism is required for World Wide Web caches. Web workload analyzed to date. By examining a t is extremely busy site and

711 citations

Journal ArticleDOI
TL;DR: A novel anomaly detector based on hidden semi-Markov model is proposed to describe the dynamics of Access Matrix and to detect the attacks of new application-layer DDoS attacks.
Abstract: Distributed denial of service (DDoS) attack is a continuous critical threat to the Internet. Derived from the low layers, new application-layer-based DDoS attacks utilizing legitimate HTTP requests to overwhelm victim resources are more undetectable. The case may be more serious when such attacks mimic or occur during the flash crowd event of a popular Website. Focusing on the detection for such new DDoS attacks, a scheme based on document popularity is introduced. An Access Matrix is defined to capture the spatial-temporal patterns of a normal flash crowd. Principal component analysis and independent component analysis are applied to abstract the multidimensional Access Matrix. A novel anomaly detector based on hidden semi-Markov model is proposed to describe the dynamics of Access Matrix and to detect the attacks. The entropy of document popularity fitting to the model is used to detect the potential application-layer DDoS attacks. Numerical results based on real Web traffic data are presented to demonstrate the effectiveness of the proposed method.

256 citations


Cites background from "File popularity characterisation"

  • ..., [29] and [30], we will extend it to our detection in the rest of this paper....

    [...]

Book
01 Mar 2015
TL;DR: Using this book, readers will be able to analyze collected workload data and clean it if necessary, derive statistical models that include skewed marginal distributions and correlations, and consider the need for generative models and feedback from the system.
Abstract: Reliable performance evaluations require the use of representative workloads. This is no easy task since modern computer systems and their workloads are complex, with many interrelated attributes and complicated structures. Experts often use sophisticated mathematics to analyze and describe workload models, making these models difficult for practitioners to grasp. This book aims to close this gap by emphasizing the intuition and the reasoning behind the definitions and derivations related to the workload models. It provides numerous examples from real production systems, with hundreds of graphs. Using this book, readers will be able to analyze collected workload data and clean it if necessary, derive statistical models that include skewed marginal distributions and correlations, and consider the need for generative models and feedback from the system. The descriptive statistics techniques covered are also useful for other domains.

247 citations

Journal ArticleDOI
TL;DR: Web proxy workloads from different levels of a caching hierarchy are used to understand how the workload characteristics change across different levels to improve the performance and scalability of the Web.
Abstract: Understanding Web traffic characteristics is key to improving the performance and scalability of the Web. In this article Web proxy workloads from different levels of a caching hierarchy are used to understand how the workload characteristics change across different levels of a caching hierarchy. The main observations of this study are that HTML and image documents account for 95 percent of the documents seen in the workload; the distribution of transfer sizes of documents is heavy-tailed, with the tails becoming heavier as one moves up the caching hierarchy; the popularity profile of documents does not precisely follow the Zipf distribution; one-timers account for approximately 70 percent of the documents referenced; concentration of references is less at proxy caches than at servers, and concentration of references diminishes as one moves up the caching hierarchy; and the modification rate is higher at higher-level proxies.

159 citations

References
More filters
Journal ArticleDOI
TL;DR: Analysis of a range of user traces shows that, just like caches, individual users have highly variable hit rates, Zipf locality curves and show strong signs of long range dependency.
Abstract: The performance of HTTP cache servers varies dramatically from server to server. Much of the variation is independent of cache size and network topology and thus appears to be related to differences in the user communities. Analysis of a range of user traces shows that, just like caches, individual users have highly variable hit rates, Zipf locality curves and show strong signs of long range dependency. In order to predict cache performance we propose a simple model which treats a cache as an aggregation of single users, and each user as a small cache.

26 citations


"File popularity characterisation" refers background in this paper

  • ...In the absence of a culture independent metric, modellers are forced to use parameters with embedded culture dependence....

    [...]

01 Jan 1998

25 citations


"File popularity characterisation" refers background in this paper

  • ...Accurate cache models can therefore be built without any need to consider cultural effects that are hard to predict....

    [...]

Journal ArticleDOI
01 Apr 1998
TL;DR: The variation in hit rate across a number of caches is investigated and is shown to be partly stochastic and partly fractal, both caused by insufficient sample size and deterministic in origin.
Abstract: HTTP cache servers reduce network traffic by storing popular files nearer to the client and have been implemented worldwide. Their reported performance on key metrics such as hit rate varies greatly. In order to optimise the design of the cache network this variation needs to be understood. The variation in hit rate across a number of caches is investigated and is shown to be partly stochastic (i.e caused by insufficient sample size) and partly fractal (i.e deterministic in origin).

9 citations

Book ChapterDOI
12 Apr 1999
TL;DR: A model of the http traffic generated by a community of users connected to the Internet via a proxy cache is described and is used as input to the internet cache simulation models developed by British Telecom research laboratories.
Abstract: A model of the http traffic generated by a community of users connected to the Internet via a proxy cache is described. The model reproduces Internet traffic realistically and is used as input to the Internet cache simulation models developed by British Telecom research laboratories.

2 citations

Frequently Asked Questions (11)
Q1. What are the contributions in "File popularity characterisation" ?

The authors show that locality can be characterised with a single parameter, which primarily varies with the topological position of the cache, and is largely independent of the culture of the cache users. 

Number of requests used to calculate exponentThe authors have been able to obtain samples in excess of 500000 file requests for 5 very different caches. 

In order to compare data from different caches reliably it is necessary to ensure that differences are real and not due to insufficiently large samples. 

With appropriate care it is possible to fit an inverse power law curve to cache popularity curves, with an exponent of between -0.9 and -0.5, and with a high degree of confidence. 

From consideration of the work of Zipf on word use in different cultures, it seems likely that cultural differences will often be expressed through differences in the K factor in the power curve rather than the exponent. 

While filtering is one possible factor affecting the exponent of the locality curve, other factors possibly influence the exponent. 

The analysis of cache popularity curves requires careful definition of what is to be analysed and, since the data displays significant long range dependency, very large sample sizes. 

The authors demonstrate for the first time in this paper that, with appropriate care in the analysis, it can be shown that whilst the power law curves are not strictly Zipf curves they are still culture independent. 

Over these six months the fitted exponent ranged from -0.23 to -1.34 with a mean of -0.5958 and a variance of 0.03 (figure 4), using the 'averaged' ranking method mentioned above. 

The exponent does not appear to depend on cache size, on time, or on the culture of the cache users, but only depends on the topological position of the cache in the network. 

Cache logs can be extremely comprehensive, detailing time of request, bytes transferred, file name and other useful metrics [e.g. ftp://ircache.nlanr.net/Traces/].