scispace - formally typeset
Search or ask a question
Posted ContentDOI

Flat-to-curved transition during clathrin-mediated endocytosis correlates with a change in clathrin-adaptor ratio and is regulated by membrane tension

TL;DR: The results support the model that mammalian cells dynamically regulate the flat-to-curved transition in clathrin-mediated endocytosis by both biochemical and mechanical factors.
Abstract: Although essential for many cellular processes, the sequence of structural and molecular events during clathrin-mediated endocytosis remains elusive. While it was believed that clathrin-coated pits grow with a constant curvature, it was recently suggested that clathrin first assembles to form a flat structure and then bends while maintaining a constant surface area. Here, we combine correlative electron and light microscopy and mathematical modelling to quantify the sequence of ultrastructural rearrangements of the clathrin coat during endocytosis in mammalian cells. We confirm that clathrin-coated structures can initially grow flat and that lattice curvature does not show a direct correlation with clathrin coat assembly. We demonstrate that curvature begins when 70% of the final clathrin content is acquired. We find that this transition is marked by a change in the clathrin to clathrin-adaptor protein AP2 ratio and that membrane tension suppresses this transition. Our results support the model that mammalian cells dynamically regulate the flat-to-curved transition in clathrin-mediated endocytosis by both biochemical and mechanical factors.

Summary (7 min read)

Introduction

  • Clathrin-mediated endocytosis (CME) is an essential uptake pathway that relocates membrane or extracellular cargo into the cell to regulate multiple cellular functions and cell homeostasis 1 .
  • This process is coordinated by numerous adaptor and accessory proteins 1, 3 .
  • For topological reasons this requires a major ultrastructural rearrangement of the clathrin lattice which appeared to be dynamically difficult and energetically costly [8] [9] [10] [11] [12] .
  • Recently, correlative light and electron microscopy (CLEM) analyses provided experimental evidence that CCS first grow flat to their final size and then acquire curvature (constant area model, Fig. 1a ) 19 .
  • The authors combine mathematical modelling of individual endocytic event dynamics and CLEM analysis to provide a comprehensive description of the dynamic ultrastructural rearrangement of the clathrin coat during CME.

EM and CLEM analysis of CCS do not support existing growth models

  • To address whether CCP formation follows the constant curvature model or the constant area model (Fig. 1a ) 13 , the authors chose BSC-1 cells, a widely used cellular model to study CME 10, 14, 20 .
  • In contrast, the constant area model implies that both projected and surface areas initially show similar growth but then the projected area should drop significantly as bending starts (Fig. 1b ).
  • In contrast their EM data reveals that around 50% of the CCS in BSC-1 correspond to flat CCS (Fig. 1e ) and that a large fraction of the flat and dome structures have a projected area larger than the projected area of the pits (Fig. 1g ).
  • The copyright holder for this preprint (which was not this version posted July 11, 2017.
  • In conclusion, their TEM and CLEM analyses argue that neither of the proposed growth models fully explains the observed ultrastructural distribution and corresponding fluorescence intensities of CCS in BSC-1 cells.

Modelling of CCP assembly reveals bending of the coat before reaching full surface area

  • It only provides snapshots of the dynamic process of CCP assembly 23 .
  • The copyright holder for this preprint (which was not this version posted July 11, 2017.
  • Mathematically there is only one type of growth equation that can explain why growth should stop at a finite patch radius, namely association over the edge and dissociation over the area of the patch (Supplementary Information).
  • Given the high proportion of flat structures (Fig. 1e ), the authors reasoned that CCS start as flat structures and then acquire curvature before reaching the full clathrin content (Fig. 3d and Supplementary Information).
  • As before, the ratio between the flat, dome, and pit structures was biased towards flat structures (Fig. 3g ) but now the calculated size and morphology distribution fit the EM data better than the distribution according to the constant area model.

Starting point of acquiring curvature is marked by a change in the AP2/clathrin ratio

  • The flat-to-curved transition of a CCS requires major ultrastructural reorganisation of the coat 11 .
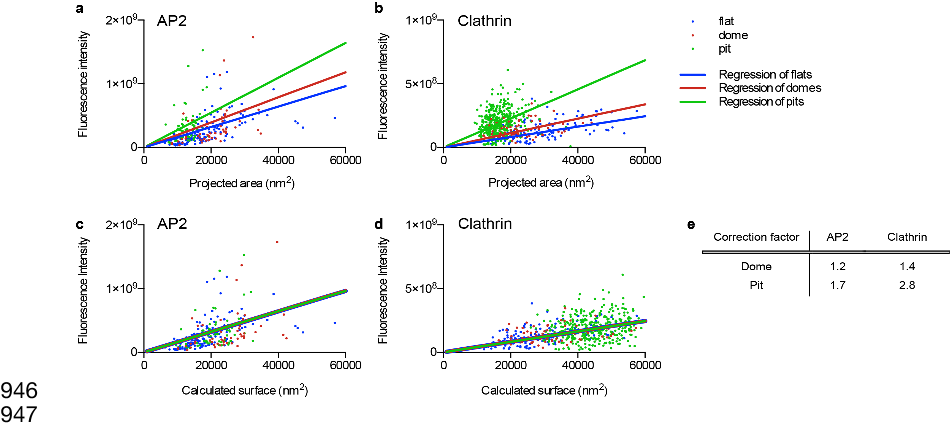
  • To find the relationship between fluorescence intensity and the surface of CCS, the measured projected area needs to be corrected for the curvature to obtain the surface area of the CCS (Fig. 1b ).
  • Assuming the geometry of a hemisphere for domes and an almost complete sphere for pits the authors expect a correction factor of ≤2 certified by peer review) is the author/funder.
  • The copyright holder for this preprint (which was not this version posted July 11, 2017.
  • These findings strongly support a model where flat-to-curved transition initiates at around 70% of its maximal clathrin content and correlates with the concomitant change in the AP2/clathrin ratio.

High membrane tension inhibits the flat-to-curved transition of CCS

  • By inducing curvature to the PM, the CCS needs to act against the plasma membrane tension (PMT).
  • This effect was transient and cells quickly reverted to normal clathrin dynamics (Fig. 6b and d ).
  • The authors found an accumulation of flat CCS under osmotic shock compared to normal conditions and the frequency was comparable to their predictions from the AP2 and CLC profiles certified by peer review) is the author/funder.
  • The copyright holder for this preprint (which was not this version posted July 11, 2017.
  • These flat structures, as well as the dome and pit structures, have the same size distribution as under normal conditions (Fig7d box/whiskers and 7e).

Discussion

  • The complex coordination of CCS formation during CME has been investigated for decades 32, 33 and the field has been driven by the competition between the constant curvature versus the constant area models 13 .
  • The authors model where a change in AP2/clathrin ratio drives the flat-to-curved transition is consistent with their recent observation that AP2 (and other adaptor/accessory proteins) partitions in different nanoscale area of the clathrin coat and that the concentration of AP2 varies within these zones at various stage of CCS assembly 22 .
  • The authors growth behaviour of CCP assembly, determined in this work in BSC-1 cells, may also apply for other cell types.
  • The copyright holder for this preprint (which was not this version posted July 11, 2017.
  • Surprisingly, the increase in PMT only changes the ratio between the different morphologies of CCS in favour of flat structures but does not affect their size.

Methods

  • Cell lines and cell culture BSC-1 cells were obtained from ATCC.
  • BSC-1 cells stably expressing AP2-eGFP were created by transfecting BSC-1 cells with a plasmid expressing the sigma2 subunit of AP2 fused to eGFP 20 .
  • After detaching, the cells were resuspended in complete medium.

Transfection

  • Transfection of cells was done using Lipofectamine 2000 .
  • The next day, cells were transfected at 70-80% confluence.
  • 2µg DNA and 8µl Lipofectamine 2000 were separately mixed with 100µl OptiMEM .
  • For generation of stable cell lines, the growth medium was exchange for fresh growth medium after 8 hours.
  • For live-cell imaging of BSC-1 AP2-eGFP transiently expressing CLCa-tdtomato were seeded 8 hours after transfection.

Live-cell microscopy

  • Glass coverslips (TH. Geyer, 25mm diameter, No. 1.5H) were coated with poly-Dlysine solution (Sigma-Aldrich, #P6407) at concentration 0.1mg ml -1 for 5 minutes at room temperature and washed three times with PBS.
  • Cells were seeded on poly-D-lysine-coated coverslips and live-cell microscopy was performed 12-16 hours after seeding.
  • Live-cell imaging of AP2-eGFP was performed with an inverted spinning-disk confocal microscope , with a 60x (1.42 numerical aperture, Apo TIRF, Nikon) or 100x (1.4 numerical aperture, Plan Apo VC, Nikon) oil immersion objective and a CMOS camera (Hamamatsu Ocra Flash 4).
  • An environment control chamber was attached to the microscope to keep 37 °C and 5%CO2.
  • 10 minutes-long movies of representative cells were taken with one frame every 3 seconds.

Osmotic shock experiments

  • For live-cell microscopy of cells under osmotic shock, one cell was imaged for 5 minutes under normal conditions.
  • Afterwards the medium was change to hypotonic certified by peer review) is the author/funder.
  • 1 ratio of medium to water with 10% FBS) and the same cell was imaged for an additional 30 minutes, also known as medium (1.
  • For TEM of cells under osmotic shock, cells were put into hypotonic medium and unroofed after 10 minutes of osmotic shock.

Immunofluorescence

  • For immunofluorescence, intact cells growing on poly-D-lysine coated 12mm coverslips (#1.5, Thermo Scientific) or unroofed PMs were fixed with 2-4% paraformaldehyde for 20 minutes at room temperature.
  • Intact cell were permeabilised with 0.5% Triton X in PBS for 15 minutes.
  • After five washes with PBS, samples were incubated with the secondary antibody.
  • Certified by peer review) is the author/funder.
  • The copyright holder for this preprint (which was not this version posted July 11, 2017.

Imaging of unroofed PMs for CLEM

  • Widefield fluorescent images of unroofed PMs were taken with a Nikon N-STORM microscope with a 100x oil immersion objective and an EMCCD camera (Andor Ixon Ultra DU-897).
  • The imaged area was marked with a circle (4mm in diameter) around the centre of the imaged area using an objective diamond scriber.
  • The immersion oil was carefully removed from the bottom of the glass coverslip and the sample was prepared for EM.

TEM of metal replica

  • Coverslips with unroofed membranes were fixed with 2% glutaraldehyde in PBS overnight.
  • After two washes with water, samples were dehydrated with a series of ethanol solutions (15%-100%).
  • For better orientation, the marked area of the coated samples was imaged with a phase contrast microscope.
  • 5% hydrofluoric acid was used to remove glass from the metal replica.
  • Certified by peer review) is the author/funder.

Transformation of images for CLEM

  • The fluorescence microscopy image and the electron microscopy montage of the same membrane sheet were first manually and roughly overlaid using Photoshop.
  • MATLAB was used to transform the fluorescence image according to the electron microscopy montage using three manually identified CCS.
  • For the transformation the centre of the clathrin structure in the electron microscope montage and the centre of the fluorescence signal determined by a Gaussian fit were used as landmarks.

Tracking

  • For tracking CME events, the authors used ilastik (http://ilastik.org).
  • First the images were segmented using the pixel classification and object classification workflow.
  • The maximal distance was put to 5 to avoid merging of close tracks.
  • For particle detection, a Laplacianof-Gaussian filter and connected-component labelling was used.
  • In addition, the lifetime of CCS was quantified and classified into different ranges.

STED

  • STED nanoscopy was carried out using the Two-color-STED system (Abberior Instruments GmbH, Göttingen).
  • Image acquisition was performed using a 100x Olympus UPlanSApo (NA 1.4) oil immersion objective and 70 % nominal STED laser power (l= 775 nm, max.
  • Deconvolution of acquired images was done using certified by peer review) is the author/funder.

Constant area model

  • As the fluorescence intensity of labelled clathrin triskelia is proportional to the number of incorporated clathrin triskelia or equivalently to the size of clathrin covered membrane area, the authors model the assembly of CCV as surface growth.
  • In the observed fluorescence intensity tracks the intensity decreases after some time until the intensity vanishes completely.
  • The constant area model assumes that a flat patch transforms into a spherical pit as soon as the patch reaches the area plateau.
  • The copyright holder for this preprint (which was not this version posted July 11, 2017.

Data fits

  • To test whether the constant area model correctly describes the shape and size of clathrin coated vesicles the authors fitted Eq. 1 to 4927 FM tracks of 4 different cells (Fig. 3b ) and calculated from the fitted area surface growth curves histograms which they could compare to EM histograms.
  • Therefore, the authors related the intensity of an FM track to its corresponding area.
  • Furthermore, the FM dataset was filtered before the fitting.
  • The exact details of their procedure are described in the following.

Relate fluorescence intensity and surface area by means of CLEM

  • To relate the fluorescence intensity of a clathrin FM track to the corresponding clathrin covered membrane area the authors use their clathrin CLEM data, relating the projected surface size of CCS to their fluorescence intensity.
  • The authors analyse flat CCS for which the projected area directly corresponds to their surface.
  • As the local intensity background is removed from the CLEM data the authors find 𝐼(𝐴) = 𝛽𝐴, (Eq. S2) where I is the intensity of the FM data, A is the area of the clathrin structure and 𝛽 is the proportionality constant.
  • Fig. 4b shows the intensity of flat structures as a function of their projected area (blue).
  • The copyright holder for this preprint (which was not this version posted July 11, 2017.

Relate different FM datasets

  • To calculate a size histogram from fluorescence intensity tracks the authors analyse live cell FM data, that have a different intensity level than the fluorescence intensity of the CLEM data.
  • Therefore, the authors need to relate these two different data sets.
  • As the CLEM intensity I and the live cell FM intensity I' are both proportional to the number of labelled clathrin triskelia, both intensities, which are background corrected, can be related only by some factor 𝛼.
  • In the live cell FM data set the authors register only detectable intensities, which exceed the local background signal.
  • The copyright holder for this preprint (which was not this version posted July 11, 2017.

Data filtering

  • To ensure that all structures correspond to real objects the authors assume for a productive object a minimal lifetime of 24 seconds.
  • The authors filter their data set for FM tracks with multiple structures (defined as a FM track that shows at least two clear intensity maxima) to allow for direct fitting of single tracks.

Parameter choice and data fitting

  • The parameters for the fit are restricted by assuming that growth curves should at least reach 90% and at most 120% of the maximal area value.
  • Additionally, the authors assume that vesicle pinch off (corresponding to a decrease in the intensity to 10%) takes between 10 seconds to 20 seconds.
  • Additionally, the authors require the fit to reach 99% of the steady state area before the area decrease happens and at least 10% of that time until the 99% area level are reached.
  • Certified by peer review) is the author/funder.
  • The copyright holder for this preprint (which was not this version posted July 11, 2017.

Calculation of the size histogram

  • From the growth curves, the authors calculated a histogram (Fig. 3c ) to compare the constant area model to the measured projected size EM histogram (Fig. 3h ).
  • The authors classified the chosen times and corresponding areas into three categories.
  • The authors computed the projected area by assuming that the transformation within the dome and pit phase is a linear function of time.
  • From the growth curves the authors calculated a histogram (Fig. 3f ) to compare "the curvature acquisition during growth model" to the measured projected size EM histogram (Fig. 3h ).
  • The copyright holder for this preprint (which was not this version posted July 11, 2017.

Curvature acquisition during growth: updated model

  • In the updated growth model the authors assume that CCS first grow flat, start to invaginate as they reach 70 % of their final size (which they determine by taking the inverse of the intensity ratio of pit and flat structures in clathrin CLEM, which is 1.44) and finally grow as a spherical cap until a full pit has formed.
  • As before the authors model the assembly of clathrin coated vesicles as surface growth.
  • The authors mathematical description of the "curvature acquisition during growth model " considers a spherical cap with radius 𝑅 that grows at its edge with rate 𝑘 "# which can be expresses by sizes.
  • After reaching 70% of the maximal area the authors classify CCS in the first 40% of the remaining time to be domes and pits otherwise.
  • The copyright holder for this preprint (which was not this version posted July 11, 2017.

Data fits, parameter choice and data fitting

  • To test whether the "curvature acquisition during growth" model correctly describes the shape and size of clathrin coated vesicles the authors fitted Eq. S4 to 4927 FM tracks of 4 different cells (Fig. 3e ) and calculated from the fitted area surface growth curves histograms which they could compare to EM histograms.
  • Therefore, the authors related the intensity of an FM track to its corresponding area.
  • The exact details of their procedure are the same as before.
  • The parameters for the fit are restricted by assuming that growth curve should at least reach 90% and maximal 120% of the maximal area value and that the vesicle pinching off (corresponding to a decrease in the intensity to 10%) takes between 10 seconds to 20 seconds.
  • The authors implement the Python module 'lmfit' for fitting the area tracks where they use the method 'nelder' of the minimiser function.

Live cell FM analysis resampling

  • To determine the ratio of clathrin and AP2 during the process of CME, the authors performed TIRF microscopy of BSC-1 AP2-eGFP cells transiently expressing CLCatdtomato.
  • The authors analysed the excess of clathrin in comparison with AP2 during the formation of CCVs.
  • Therefore, the authors calculated the ratio of the maximum clathrin intensity divided by the intensity of clathrin at the time when AP2 shows an intensity plateau (95% intensity level) and subtract this ratio from the ratio, which they get for AP2.
  • The authors calculate the plateau time, defined as the time when 95% of the AP2 plateau intensity is reached by fitting the constant certified by peer review) is the author/funder.
  • The copyright holder for this preprint (which was not this version posted July 11, 2017.

Calculation of the ratio histogram during the osmotic shock

  • To determine the ratio histogram of flat, dome and pit CCS during the osmotic shock (Fig. 7a and 7c ) the authors first defined a transition time 𝑡 D@A#0$"@ADƒ"# , when flat CCS start to invaginate, where the normalised clathrin intensity exceeds the normalised AP2 intensity by 5% (blue region in Fig. 6c ).
  • The found ratios of flat, dome and pit CCS were then plotted as a function of the time after the osmotic shock (Fig. 7a ).
  • Averaging over all tracks and considering only tracks with lifetimes shorter than 90s and with AP2/clathrin discrepancy the authors obtained 47.8% flat CCS, 18.0% dome CCS and 34.2% pit CCS which is close to the determined ratios in (Fig. 5g ). certified by peer review) is the author/funder.
  • The copyright holder for this preprint (which was not this version posted July 11, 2017.

Did you find this useful? Give us your feedback

Figures (8)

Content maybe subject to copyright    Report

!"#$%$&%'()*+,- $)#./0$0&.- ,()0.1- '"#$2)0.%3+,0#$+,-1
+.,&'4$&/0/- '&))+"#$+/- 50$2- #- '2#.1+- 0.- '"#$2)0.%#,#6$&)-2
)#$0&-#.,-0/-)+1("#$+,-74-3+37)#.+-$+./0&.-3
!4
Delia! Bucher
1,2*
,! Felix! Frey
3,4*
,! Kem! A.! Sochacki
5
,! Susann! Kummer
1
,! Jan-Philip!5
Bergeest
2,3,6
,!William!J.!Godinez
2,3,6
,
!
Hans-Georg!Kräusslich
1
,!Karl!Rohr
2,3,6
,!Justin!W.!6
Taraska
5!
,!Ulrich!S.!Schwarz
3,4
,!Steeve!Boulant
1,2
!7
!8
1!
Department! of! Infectious! Diseases,! Virology,! University! Hospital! Heidelberg,! Im!9
Neuenheimer!Feld!324,!69120!Heidelberg,!Germany!10
2!
German! Cancer! Research! Center! (DKFZ),! Im! Neuenheimer! Feld! 581,! 69120!11
Heidelberg,!Germany!12
3!
BioQuant-Center,!Im!Neuenheimer!Feld!267,!69120!Heidelberg,!Germany!13
4!
Institute!for!Theoretical!Physics,!Heidelberg!University,!Philosophenweg!19,!69120!14
Heidelberg,!Germany!
!
15
5!
National! Heart! Lung! and! Blood! Institute,! National! Institutes! of! Health,! Bethesda,!16
U.S.A.!17
6!
Department!of!Bioinformatics!and!Functional!Genomics,!Heidelberg!University,!Im!18
Neuenheimer!Feld!267,!69120!Heidelberg,!Germany!19
!20
*!equal!contributions!21
!22
!23
!24
Correspondence!should!be!addressed!to!Steeve!Boulan t:!25
s.boulant@dkfz.de!26
!27
!28
certified by peer review) is the author/funder. All rights reserved. No reuse allowed without permission.
The copyright holder for this preprint (which was notthis version posted July 11, 2017. ; https://doi.org/10.1101/162024doi: bioRxiv preprint

Keywords:! clathrin-mediated! endocytosis,! clathrin-coated! pit s,! flat! clathrin! lattice,!29
CLEM,!membrane!curvature!30
87/$)#'$-31
Although! essential! for! many! cellular! processes,! the! sequence! of! structural! and!32
molecular! events! during! clathrin-mediated! endocytosis! remains! elusive.! While! it!33
was! believed! that ! clathrin-coated! pits! grow! with! a! constant! curvature,! it! was!34
recently! suggested! that! clathrin! first! assembles! to! form! a! flat! structure! and! then!35
bends! while! maintaining! a! constant! su rfa ce! area.! Here,! we! combine! correlative!36
electron!and!light!microscopy!and!mathematical!modelling!to!quantify!the!sequence!37
of! ultrastructural! rearrangements! of! the! clathrin! coat! during! endocytosis! in!38
mammalian!cells.!We!confirm!that!clathrin-coated!structures!can!initially!grow!flat!39
and! that! lattice! curvature! does! not! show! a! direct! correlation! with! clathrin! coat!40
assembly.! We! demonstrate! that! curvature! begins! when! 70%! of! the! final! clathrin!41
content!is!acquired.!We!find!that!this!transition!is!marked!by!a!change!in!the!clathrin!42
to! clathrin-adaptor! protein! AP2! ratio! and! that! membrane! tension! suppresses! this!43
transition.! Our! results! support! the! model! that! mammalian! cells! dynamically!44
regulate! the! flat-to-curved! transition! in! clathrin-mediated! endocytosis! by! both!45
biochemical!and!mechanical!factors.!!46
! !47
certified by peer review) is the author/funder. All rights reserved. No reuse allowed without permission.
The copyright holder for this preprint (which was notthis version posted July 11, 2017. ; https://doi.org/10.1101/162024doi: bioRxiv preprint

9.$)&,('$ 0& .-48
! Clathrin-mediated! endocytosis! (CME)! is! an! essential! uptake! pathway! that!49
relocates!membrane!or!extracellular!cargo!into!the!cell!to!regulate!multiple!cellular!50
functions!and!cell!homeostasis
1
.!During!CME,!the!clathrin!coat!is!assembled!to!form!51
a! clathrin-coated! pit! (CCP)! that! after! dynamin-mediated! scission! from! the! plasma!52
membrane! (PM)! leads! to! the! formation! of! a! clathrin-coated! vesicle! (CCV)
2
.! This!53
process! is! coordinated! by! numerous! adaptor! and! accessory! proteins
1,3
.! Electron!54
microscopy! (EM)! of! clathrin! coated! structures! (CCS)! has! shown! the! architectural!55
complexity! of! the! clathrin! meshwork! organized! into! hexagons! and! pentagons
4,5
.!56
From!this!EM!analysis,!it!was!proposed!that!a !CCV!initiates!as!a!flat!clathrin!lattice!57
that!is!then!rearranged!to!form!a!curved!CCP
4,6,7
.!However,!for!topological!reasons!58
this! requires! a! major! ultrastructural! rearrangement! of! the! clathrin! lattice! which!59
appeared!to!be!dynamically!difficult!and!energetically!costly
8–12
.!For!these!reasons,!60
this!notion!was!replaced!by!a!general!belief! that!CCS!grow!with!a!constant!curvature!61
(constant!curvature!model,!Fig.1a)
8,9,13
!and!that!flat!CCS!are!distinct!from!CCPs!and!62
serve!different!purposes
1416
.!This!model!was!supported!by!the!finding!that!purified!63
clathrin! triskelia! self-assemble! into! curved! clathrin! baskets! in# vitro
17,18
.! Recently,!64
correlative! light! and! electron! microscopy! (CLEM)! analyses! provided! experimental!65
evidence! that! CCS! first! grow! flat! to! their! final! size! and! then ! acquire! curvature!66
(constant!area!model,!Fig.1a)
19
.!However,!this!study!did!not!measure!the!dynamics!67
of! CCP! formation! directly,! and! it! did! not! identify! the! cellular! factors! that! might!68
determine! when! the! flat-to-curved! transition! occurs.! Thus! a! comprehensive!69
understanding! of! t he! dynamic! process! of! coat! rearrangement,! of! the! temporal!70
aspects! of! flat-to-curved! transition! and! of! what! governs! this! ultrastructural!71
rearrangement!during!CME!is!still!missing.!!72
In! this! work,! we! combine! mathematical! modelling! of! individual! endocytic!73
event!dynamics!a nd! CLEM! analysis! to!provide!a! comprehensive! description! of!the!74
dynamic! ultrastructural! rearrangement! of! the! clathrin! coat! during! CME.! We!75
demonstrate! that ! CCPs! indeed! initially! grow! as! flat! arrays,! but! that! their!76
reorganisation! into! curved! structures! occurs! before! reaching! their! full! clathrin!77
certified by peer review) is the author/funder. All rights reserved. No reuse allowed without permission.
The copyright holder for this preprint (which was notthis version posted July 11, 2017. ; https://doi.org/10.1101/162024doi: bioRxiv preprint

content.! We! correlate! this! flat-to-curved! transition! with! a! change! in! the!78
AP2/clathrin!ratio!and!show!that!it!is!governed!by!biophysical!properties!of!the!PM.!79
Our!findings!provide!a!unifying!view!of!the!dynamic!process!of!coat!rearrangement!80
during! CME! and! our! approach! constitutes! a! methodological! framework! to! further!81
study!the!fine-tuned!spatio-temporal!mechanism!regulating!coat!assembly.!82
! -83
certified by peer review) is the author/funder. All rights reserved. No reuse allowed without permission.
The copyright holder for this preprint (which was notthis version posted July 11, 2017. ; https://doi.org/10.1101/162024doi: bioRxiv preprint

:+/("$/--84
;<-#.,-=>;<-#.#"4/0/-&?-==@-,&-.&$-/(66&)$-+A0/$0.1-1)&5$2-3&,+"/-85
!86
To! address! whether! CCP! formation! follows! the! constant! curvature! model! or! the!87
constant!area!model!(Fig.1a)
13
,!we!chose!BSC-1!cells,!a!widely!used!cellular!model!to!88
study! CME
10,14,20
.! BSC-1! cells! present! homogenous! CME! events! in! regard! to! both!89
lifetime! as! well! as! intensity! profiles! and! lack! the! long-live! flat! clathrin-coated!90
plaques
10,15
! (Supplementary! Fig.1! and! Fig.1c-g).! Both! models! predict! different!91
growth! profiles! for! the! surface! and! projected! area! during! CCP! formation.! The!92
constant! curvature! model! implies! that! the! projected! area! will! quickly! be! smaller!93
than! the! surface! area.! In! contrast,! the! constant! area! model! implies! that! both!94
projected! and! surface! areas! initially! show! similar! growth! but! then! the! projected!95
area!should!drop!significantly!as!bending!starts!(Fig.1b).!96
To! comprehensively! characterise! the! ultrastructural! organisation! of! CCS! in! BSC-1!97
cells,! we! performed! TEM! of! metal! replicas! from! unroofed! PMs! (Fig.1c).! We!98
confirmed! that! CCS! are! not! altered! by! the! unroofing! procedure! using! stimulated!99
emission!depletion!(STED)!super-resolution!microscopy!of!intact!and!unroofed!cells.!100
The! number! and! size! distribution! of! CCS! were! indeed! similar! between! intact! and!101
unroofed!cells!(Supplementary!Fig.2).!CCS!in!TEM!images!of!whole!PM!sheet s!were!102
counted,! categorised! as! flat,! dome! or! pit! structures! (Fig.1d-e)! and! t heir! size! was!103
measured!as!projected!area!(Fig.1a,!f,!and!g).!For!the!constant!curvature!model,!we!104
would! expect! no! flat! structures! at! all! and! no! dome! structures! that! exceed! the!105
projected!area!of!pits!(Fig.1a-b).!In!contrast!our!EM!data!reveal s!that!around!50%!of!106
the!CCS!in!BSC-1!correspond!to!flat!CCS!(Fig.1e)!and!that!a!large!fraction!of!the!flat!107
and!dome!structures!have!a!projected!area!larger!than!the!projected!area!of!the!pits!108
(Fig.1g).! Since! BSC-1! cells! do! not! have! clathrin-coated! plaques
10,15
,! these! results!109
demonstrate! that! the! constant! curvature! model! cannot! explain! the! CCS! size!110
distribution,!in!agreement!with!the!recent!results!by!Avinoam!et!al
19
.!Although!the!111
existence!of!flat!CCS! seems!to!argue!in!favour!for!the!constant!area!model,!we!would!112
expect!that!some!flat!structures!have!the!same!projected!area!as!the!surface!area!of!113
certified by peer review) is the author/funder. All rights reserved. No reuse allowed without permission.
The copyright holder for this preprint (which was notthis version posted July 11, 2017. ; https://doi.org/10.1101/162024doi: bioRxiv preprint

Citations
More filters
Journal ArticleDOI
TL;DR: It is concluded that sterols lower the energetic costs of membrane bending during pit formation and vesicular scission during CME and suggest reduced CME contributes to cellular phenotypes observed within disorders of cholesterol metabolism.
Abstract: As the principal internalization mechanism in mammalian cells, clathrin-mediated endocytosis (CME) is critical for cellular signal transduction, receptor recycling, and membrane homeostasis. Acute depletion of cholesterol disrupts CME, motivating analysis of CME dynamics in the context of disrupted cholesterol synthesis, sterol specificity, mechanisms involved, and relevance to disease pathology. Using genome-edited cell lines, we demonstrate that inhibition of post-squalene cholesterol biosynthesis as observed in inborn errors of cholesterol metabolism, results in striking immobilization of CME and impaired transferrin uptake. Imaging of membrane bending dynamics and CME pit ultrastructure revealed prolonged clathrin pit lifetimes and accumulation of shallow clathrin-coated structures that scaled with diminishing sterol abundance. Moreover, fibroblasts derived from Smith-Lemli-Opitz syndrome subjects displayed reduced CME function. We conclude that sterols lower the energetic costs of membrane bending during pit formation and vesicular scission during CME and suggest reduced CME contributes to cellular phenotypes observed within disorders of cholesterol metabolism.

10 citations

Dissertation
01 Sep 2017
TL;DR: It is shown how the complex structure of epsin 1 causes competition with β-arrestin 1 for clathrin TD binding, and competition is observed between espin 1 and auxilin 1 as well, which reveals information about the mechanism of disassembly.
Abstract: Clathrin-mediated endocytosis (CME) plays a central role in fundamental processes such as synaptic vesicle recycling, receptor recycling, signalling and development. CME begins with clathrin assembly on the plasma membrane, facilitated by adaptor proteins. This process forms an endocytic vesicle that allows transport of cargo into the cell, and is followed by clathrin disassembly through the action of different adaptor/accessory proteins. A large number of different adaptor and accessory proteins are recruited during CME, in a spatially and temporally ordered manner. Although our understanding is growing as to the roles of individual adaptor proteins, we still do not understand the way in which some adaptors interact with clathrin or the molecular details of their interactions with one another in the presence of clathrin. Clathrin adaptor proteins contain short, linear clathrin-binding motifs, which form the basis of their interaction with the four distinct sites on the clathrin N-terminal domain (TD). An adaptor protein with tighter binding or more numerous clathrin binding sequences could displace one with weaker or fewer binding elements. This raises the question of whether adaptor proteins compete for binding to clathrin or whether they can bind simultaneously. Using certain biochemical and biophysical techniques in vitro and purified WT and mutant adaptor proteins, I have shown the complex ‘multiple TD linking effect’ of epsin 1 via the cooperative action of its two clathrin box motifs and unstructured region. Using the newly developed SPR/IAC (2-injection) method, I explored competition between five purified structurally and functionally diverse adaptor proteins when simultaneously binding to clathrin TD. I have shown how the complex structure of epsin 1 causes competition with β-arrestin 1 for clathrin TD binding. Such competition is observed between espin 1 and auxilin 1 as well, which reveals information about the mechanism of disassembly. However, β2-adaptin and auxilin 1 demonstrate no such competition.

2 citations


Cites background from "Flat-to-curved transition during cl..."

  • ...This transition initiates with the clathrin assembly growing as a flat structure, which then begins to bend when clathrin has reached 70% final content, a change in clathrin/adaptor (AP2) ratio occurs prior to the completion of coat assembly (Bucher et al., 2017)....

    [...]

  • ...The bending process is carried out with the help of specific adaptor proteins, which maintain a constant surface area (Traub, 2009; Bucher et al., 2017)....

    [...]

  • ...This flat-to-curved transition is hypothesised to be controlled by biophysical properties of the plasma membrane (e.g. tension) (Bucher et al., 2017)....

    [...]

  • ...This transition occurs when the content of clathrin is around 70% indicating the completion of the coat assembly (Bucher et al., 2017)....

    [...]

References
More filters
Journal ArticleDOI
TL;DR: Clathrin-mediated endocytosis is the endocytic portal into cells through which cargo is packaged into vesicles with the aid of a clathrin coat and is fundamental to neurotransmission, signal transduction and the regulation of many plasma membrane activities and is thus essential to higher eukaryotic life.
Abstract: Clathrin-mediated endocytosis is the endocytic portal into cells through which cargo is packaged into vesicles with the aid of a clathrin coat. It is fundamental to neurotransmission, signal transduction and the regulation of many plasma membrane activities and is thus essential to higher eukaryotic life. Morphological stages of vesicle formation are mirrored by progression through various protein modules (complexes). The process involves the formation of a putative FCH domain only (FCHO) initiation complex, which matures through adaptor protein 2 (AP2)-dependent cargo selection, and subsequent coat building, dynamin-mediated scission and finally auxilin- and heat shock cognate 70 (HSC70)-dependent uncoating. Some modules can be used in other pathways, and additions or substitutions confer cell specificity and adaptability.

1,974 citations

Journal ArticleDOI
TL;DR: In spite of their seeming unrelatedness, both K+ depletion and hypertonic treatment cause coated pits to disappear, and both induce abnormal clathrin polymerization into empty microcages, which suggests that in both cases, an abnormal formation of microc cages inhibits endocytosis.
Abstract: Two seemingly unrelated experimental treatments inhibit receptor mediated endocytosis: (a) depletion of intracellular K+ (Larkin, J. M., M. S. Brown, J. L. Goldstein, and R. G. W. Anderson. 1983. Cell. 33:273-285); and (b) treatment with hypertonic media (Daukas, G., and S. H. Zigmond. 1985. J. Cell Biol. 101:1673-1679). Since the former inhibits the formation of clathrin-coated pits (Larkin, J. M., W. D. Donzell, and R. G. W. Anderson, 1986. J. Cell Biol. 103:2619-2627), we were interested in determining whether hypertonic treatment has the same effect, and if so, why. Fibroblasts (human or chicken) were incubated in normal saline made hypertonic with 0.45 M sucrose, then broken open by sonication and freeze-etched to generate replicas of their inner membrane surfaces. Whereas untreated cells display typical geodesic lattices of clathrin under each coated pit, hypertonic cells display in addition a number of empty clathrin "microcages". At first, these appear around the edges of normal coated pit lattices. With further time in hypertonic medium, however, normal lattices largely disappear and are replaced by accumulations of microcages. Concomitantly, low density lipoprotein (LDL) receptors lose their normal clustered distribution and become dispersed all over the cell surface, as seen by fluorescence microscopy and freeze-etch electron microscopy of LDL attached to the cell surface. Upon return to normal medium at 37 degrees C, these changes promptly reverse. Within 2 min, small clusters of LDL reappear on the surfaces of cells and normal clathrin lattices begin to reappear inside; the size and number of these receptor/clathrin complexes returns to normal over the next 10 min. Thus, in spite of their seeming unrelatedness, both K+ depletion and hypertonic treatment cause coated pits to disappear, and both induce abnormal clathrin polymerization into empty microcages. This suggests that in both cases, an abnormal formation of microcages inhibits endocytosis by rendering clathrin unavailable for assembly into normal coated pits.

934 citations

Journal ArticleDOI
03 Sep 2004-Cell
TL;DR: The real-time visualization of cargo sorting and endocytosis by clathrin-coated pits in living cells is reported, leading to a model in which coated pits initiate randomly but collapse unless stabilized, perhaps by cargo capture.

851 citations

Journal ArticleDOI
TL;DR: Understanding of the mechanisms by which dynamin acts, its essential roles in cell physiology and the specific function of different dynamin isoforms are improved, highlighting specific contributions of this GTPase to the physiology of different tissues.
Abstract: Dynamin, the founding member of a family of dynamin-like proteins (DLPs) implicated in membrane remodelling, has a critical role in endocytic membrane fission events. The use of complementary approaches, including live-cell imaging, cell-free studies, X-ray crystallography and genetic studies in mice, has greatly advanced our understanding of the mechanisms by which dynamin acts, its essential roles in cell physiology and the specific function of different dynamin isoforms. In addition, several connections between dynamin and human disease have also emerged, highlighting specific contributions of this GTPase to the physiology of different tissues.

829 citations

Journal ArticleDOI
TL;DR: The molecular dynamics of clathrin-mediated endocytosis in living cells has been mapped with an approximately ten-fold improvement in temporal accuracy, yielding new insights into the molecular mechanism.
Abstract: Dual colour total internal reflection fluorescence microscopy is a powerful tool for decoding the molecular dynamics of clathrin-mediated endocytosis (CME). Typically, the recruitment of a fluorescent protein–tagged endocytic protein was referenced to the disappearance of spot-like clathrin-coated structure (CCS), but the precision of spot-like CCS disappearance as a marker for canonical CME remained unknown. Here we have used an imaging assay based on total internal reflection fluorescence microscopy to detect scission events with a resolution of ∼2 s. We found that scission events engulfed comparable amounts of transferrin receptor cargo at CCSs of different sizes and CCS did not always disappear following scission. We measured the recruitment dynamics of 34 types of endocytic protein to scission events: Abp1, ACK1, amphiphysin1, APPL1, Arp3, BIN1, CALM, CIP4, clathrin light chain (Clc), cofilin, coronin1B, cortactin, dynamin1/2, endophilin2, Eps15, Eps8, epsin2, FBP17, FCHo1/2, GAK, Hip1R, lifeAct, mu2 subunit of the AP2 complex, myosin1E, myosin6, NECAP, N-WASP, OCRL1, Rab5, SNX9, synaptojanin2β1, and syndapin2. For each protein we aligned ∼1,000 recruitment profiles to their respective scission events and constructed characteristic “recruitment signatures” that were grouped, as for yeast, to reveal the modular organization of mammalian CME. A detailed analysis revealed the unanticipated recruitment dynamics of SNX9, FBP17, and CIP4 and showed that the same set of proteins was recruited, in the same order, to scission events at CCSs of different sizes and lifetimes. Collectively these data reveal the fine-grained temporal structure of CME and suggest a simplified canonical model of mammalian CME in which the same core mechanism of CME, involving actin, operates at CCSs of diverse sizes and lifetimes.

715 citations

Frequently Asked Questions (1)
Q1. What are the contributions in "Flat-to-curved transition during clathrin-mediated endocytosis correlates with a change in clathrin-adaptor ratio and is regulated by membrane tension" ?

The authors confirm that clathrin-coated structures can initially grow flat 39 and that lattice curvature does not show a direct correlation with clathrin coat 40 assembly. The authors demonstrate that curvature begins when 70 % of the final clathrin 41 content is acquired. 46 47 certified by peer review ) is the author/funder.