
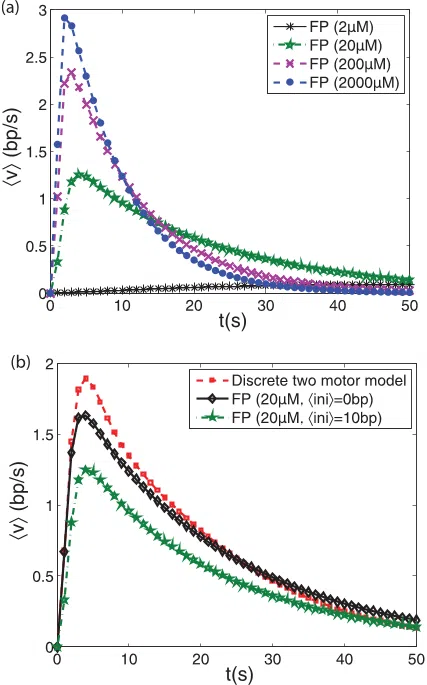
FIG. 4. (Color online) (a) The velocity profiles of the continuum Fokker-Planck model for different concentrations of ATP, starting from a Gaussian initial distribution with an initial mean of 10 bp and standard deviation σ = 1 bp. (b) A comparison of the velocity profiles of the discrete two-motor model and the Fokker-Planck model, for two distinct initial distributions with an initial mean of 0,10 bp and standard deviation σ = 1 bp.
...read more